Introduction
Economically weighted genetic selection indices for Irish beef sires were first published by the Irish Cattle Breeding Federation (ICBF) in 2005 (Evans et al., Reference Evans, Pabiou, Cromie, Kearney and Wickham2007), to aid producers in identification of superior sires based on the expected profitability of their progeny. These indices comprise economically weighted traits, for example, the beef carcass index (BCI) estimates the genetic potential of a sire to generate profitable progeny for slaughter. Genetic evaluations in Ireland utilise purebred and crossbred data, and expected progeny differences (EPD) are expressed on an across-breed basis. Although economic indices are currently being used in Ireland, their efficacy has not yet been validated through research under a controlled environment or under different beef cattle production systems.
Keane and Diskin (Reference Keane and Diskin2007) reported that progeny of sires with high genetic merit for carcass growth had a greater kill-out proportion and carcass weight than the progeny of sires of low genetic merit for carcass growth. In agreement, Crews (Reference Crews2002) reported differences among purebred progeny sired by Charolais bulls, differing in EPD to be at or near the theoretical expectations for hot carcass weight, fat thickness, muscle area, percent lean yield and marbling score. Similarly, Williams et al. (Reference Williams, Moser and Clark2004) reported positive associations between Charolais sire genetic merit, estimated from seedstock herds, and crossbred progeny performance in 31 commercial herds. However, the regression coefficients of weaning weight on sire EPD for weaning weight were significantly lower (0.66) than expected, which those authors suggested may have been due to a genotype by environment interaction between seedstock and commercial herds (Williams et al., Reference Williams, Moser and Clark2004). A similar observation was recorded by Núñez-Dominguez et al. (Reference Núñez-Dominguez, Van Vleck and Cundiff1993) with lower than expected responses to sire genetic merit for weaning weight in F1 crossbred progeny. However, there is a deficit of information published pertaining to economically weighted genetic selection indices, particularly on an across-breed basis.
The objective of this study, therefore, was to quantify the effect of sire genetic merit for BCI on feed intake, growth and carcass traits of progeny managed under bull or steer beef production systems. The phenotypic traits investigated in the present study include all of those actually included in the BCI. Analysis on the effect of BCI on live animal muscular and skeletal scores, scanned muscle and fat depth, carcass composition and carcass value (based on commercial value of meat cuts obtained in carcass dissection work) is discussed elsewhere (Clarke et al., Reference Clarke, Drennan, McGee, Kenny, Evans and Berry2009).
Material and methods
Study design
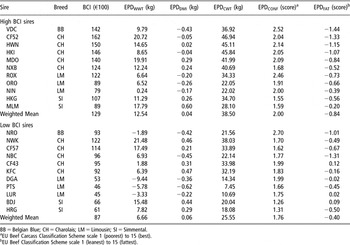
Male progeny from 22 late-maturing beef breed sires selected as either high (n = 11) or low (n = 11) for the Irish genetic index, BCI, were purchased between October 2005 and January 2006. The BCI of a sire is the linear sum of the product between the economic weight and EPD for five individual traits and thus, is related to the expected profitability of the progeny at slaughter. Traits (relative emphasis and direction of economic weight included in parenthesis) included in the current BCI (year: 2008) were weaning weight (+0.24), dry matter (DM) intake (−0.12), carcass weight (+0.46), carcass conformation score (+0.11) and carcass fat score (−0.07). The relative emphasis for each trait is calculated as the product of the economic value and the genetic standard deviation for the trait as a proportion of the other traits in the index. Within both the high and low genetic merit groups, there were five Charolais, three Limousin, two Simmental and one Belgian Blue sires (Table 1). Details of the BCI values for each sire and the EPD for weaning weight (EPDWWT), DM intake (EPDDMI), carcass weight (EPDCWT), conformation score (EPDCONF) and fat score (EPDFAT) are summarised in Table 1. The values used are from the ICBF February 2008 genetic evaluation run. EPDs are expressed in their units of measure with weaning weight, daily DM intake and carcass weight measured in kg, and both carcass conformation and fat score measured separately on a scale of 1 (poor conformation and low fat cover) to 15 (good conformation and high fat cover), as described by Hickey et al. (Reference Hickey, Keane, Kenny, Cromie and Veerkamp2007). Overall, progeny of the high compared with low BCI sires selected were expected to be €42 more profitable. On an individual trait basis, on average, the differences between the high and low BCI sires were 5.9 kg in sire EPDWWT, 0.02 kg in sire EPDDMI, 13.0 kg in sire EPDCWT, 0.24 in sire EPDCONF and 0.44 in sire EPDFAT. The reliabilities for all sires were based on their progeny reared in Irish herds and slaughtered in Ireland. Reliability values for BCI ranged from 91% to 99% with a mean value of 96%, and reliability of sire EPD for the individual traits ranged from 78% to 99% with a mean value of 93%.
Values for the beef carcass index (BCI), expected progeny differences for weaning weight (EPDWWT), dry matter intake (EPDDMI), carcass weight (EPDCWT), carcass conformation score (EPDCONF) and carcass fat score (EPDFAT) for sires of high and low BCI used in the study

BB=Belgian Blue; CH=Charolais; LM=Limousin; SI=Simmental.
aEU Beef Carcass Classification Scheme scale 1 (poorest) to 15 (best).
bEU Beef Classification Scheme scale 1 (leanest) to 15 (fattest).
The progeny originated from 28 commercial suckler beef herds from which, the number of purchased progeny per herd varied from 1 to 10. Animals were primarily born in spring to a multiparous dam and reared on their dam at pasture until weaning at approximately 9 months of age. For the purpose of the analysis in the present study, breed of dam was separated into four groups: (1) Limousin and Limousin cross; (2) Simmental and Simmental cross; (3) Aberdeen Angus and Hereford with their associated crosses; and (4) Belgian Blue and Charolais with their associated crosses.
The purchased weanlings were assembled at the Grange Beef Research Centre, where they remained for the duration of the study until slaughter. Paternal verification of each animal purchased was determined using 11 DNA-markers, including the 9 microsatellite markers recommended by the International Society of Animal Genetics (2008), and only animals with a positive paternal test outcome were retained. A total of 107 animals were included in the study. Number of progeny per sire varied from 1 to 10 with a mean number of 5.
Animal management
Upon arrival at the research centre, all animals were vaccinated as a prophylactic measure against respiratory disease, and treated for the control of ecto- and endo-parasites. Animals were offered grass silage ad libitum and 2 kg of supplementary concentrates during the pre-experimental period. While trying to maintain an equal number of progeny per sire, each animal was randomly allocated to one of two production systems; either an ‘intensive’ bull production system with slaughter age at about 16 months of age, or an ‘extensive’ steer production system with slaughter at about 24 months of age. As some animals were already castrated on arrival, castration of the remaining animals destined for the steer production system took place at this time. A total of 50 bulls and 57 steers were used in the study.
Bulls were housed in groups of seven animals in slatted floor pens and offered feed individually using electrically controlled Calan-Broadbent gates (American Calan, Northwood, New Hampshire, USA). The concentrate allowance was increased gradually until available ad libitum (at 1.10 times each animals daily intake), while concurrently, the grass silage allowance was reduced to 1 kg of DM per head daily. Refused concentrate and silage feed were discarded once weekly and three times weekly, respectively. The bulls remained on this high-concentrate diet for 133 days, from 13 February until slaughter on 26 June 2006. The concentrate offered contained 865 kg barley, 70 kg soya bean meal, 50 kg molasses and 15 kg minerals and vitamins per tonne.
Steers were offered grass silage ad libitum plus 2 kg of concentrates (same formulation as above) per head per day until 13 March 2006, after which, the daily concentrate offered was decreased to 1 kg per head and subsequently discontinued from 3 April 2006. At the end of the winter-housing period, steers were turned out to pasture on 18 April where they grazed a predominantly perennial ryegrass (Lolium perenne) based sward in two batches under a rotational grazing, paddock-based system. Each grazing batch was balanced for genetic merit and as far as possible, for sire. On 18 October 2006, the steers were re-housed in slatted floored pens with seven animals per pen, and offered grass silage ad libitum plus a mineral vitamin supplement through individual electrically controlled Calan-Broadbent gates until 22 December 2006 (59 days). Concentrates (same formulation as above) were then introduced to the diet and the allowance was increased gradually until available ad libitum, in addition to 1 kg of grass silage DM per head daily from January 2007 until slaughter on 13 or 27 April 2007 (mean 87 days). The steers were slaughtered in two groups for logistical reasons and were balanced for genetic merit and as far as possible, for sire on each slaughter date. Slaughter was carried out in the same commercial meat plant.
Animal measurements
Animals were weighed using calibrated scales on 5 January 2006, having received a standard diet from the time of arrival at the research centre. This weight is referred to as weaning weight. Bulls were subsequently weighed at 28-day intervals from then until slaughter resulting in a total of seven weight records per bull. Steers were also weighed at 28-day intervals from the initial weight to housing in October 2006 after which, they were weighed every 14 days until slaughter in April 2007, resulting in a total of 27 weight records per steer. Weighing was always carried out before the morning feeding or when at pasture, prior to movement to the next paddock in the rotation. Live-weight gain was calculated by fitting a linear regression through live weights during each of the feeding periods (grazing period, silage period and finishing period) for each animal, separately. For each period, metabolic weight (MWT) was calculated as average live weight0.75 for the interval in question. Individual daily herbage DM intake was estimated for the steers over a 6-day period in late July and early August, using the n-alkane technique (Mayes et al., Reference Mayes, Lamb and Colgrove1986), by means of a ‘controlled release capsule’ (Captec (NZ) Ltd, Auckland, New Zealand). Dosing, sampling and processing methodology used was as described by Butler et al. (Reference Butler, Stakelum, Murphy, Delaby, Rath and O’Mara2003) with the exception that faecal grab sampling were carried out once daily and all samples were freeze dried. During the intake-recording period, each grazing batch was moved to a new paddock every second day.
Post-slaughter, hot carcass weight was recorded and cold carcass weight was taken as 0.98 of hot carcass weight. Kill-out proportion was cold carcass weight expressed as a proportion of final live weight prior to slaughter. Carcass conformation and fat scores were recorded mechanically (Allen and Finnerty, Reference Allen and Finnerty2000) according to the European Union beef carcass classification scheme (Commission of the European Communities, 1982), on a continuous 15-point scale. Live weight and carcass gain per day of age were calculated by dividing live weight at slaughter and cold carcass weight, respectively, by age in days of each animal at slaughter. Estimated carcass gain (g/day) during the period in which animals were finished on ad libitum concentrates was obtained by multiplying average daily live-weight gain (g/day), during this period, by kill-out proportion (g/kg) at slaughter.
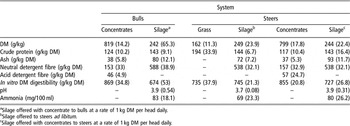
Feed processing and laboratory analysis was as described by Owens et al. (Reference Owens, McGee, Boland and O’Kiely2008). Estimated net energy (NE) content of the various diets was based on the chemical composition and in vitro DM digestibility (Table 2), according to O’Mara (Reference O’Mara1996). Feed efficiency was calculated by dividing live-weight gain into NE intake (expressed as UFV). Residual feed intake (RFI), defined as the difference between an animal’s actual feed intake and that predicted on the basis of requirements for maintenance of live weight and average daily gain (Crews, Reference Crews2005), with negative or lower values more desirable, was calculated. RFI was assumed to be represented by the residuals from a regression of average daily NE intake on MWT and live-weight gain.
Chemical composition and in vitro dry matter (DM) digestibility of concentrates, grass silage and fresh grass (s.e.)

aSilage offered with concentrate to bulls at a rate of 1 kg DM per head daily.
bSilage offered to steers ad libitum.
cSilage offered with concentrates to steers at a rate of 1 kg DM per head daily.
Using the five individual traits of the BCI, the observed phenotypic profit measure (expressed in €) was calculated for each individual animal using the following series of steps. The phenotypic performance for all five BCI traits of one random animal from the experiment were taken and all animals were then expressed, relative to the performance of this animal, by subtraction of the chosen animal’s performance from all the trial animals. These new relative performances for each trait were then multiplied by the economic value for the trait, as used in the BCI, and summed to yield the actual relative profit (in €). Thus, the chosen animal’s performance became the basis of comparison with a zero for all traits. The economic values used in this calculation were the same as those used in the February 2008 release of proofs for the calculation of the BCI. These were €1.04 per kg increase in weaning weight, −€21.94 per kg increase in DM intake consumed, €2.34 per kg increase in cold carcass weight, €10.74 per unit increase in carcass conformation score (scale of 1 to 15) and −€6.08 per kg increase in carcass fat score (scale of 1 to 15). The observed difference in value for the progeny of the high and low BCI sires, for each of the five component traits, was then expressed as a proportion of the total difference in value. The same analysis was carried out on the sire EPD (as in Table 1) with the expected difference in value between the high and low EPDs for each of the five component traits also, and was expressed as a proportion of the total difference in value.
Statistical analysis
The association between genetic merit for BCI, production system and the aforementioned variables was determined using a fixed effect linear model in PROC GLM (Statistical Analysis Systems Institute (SAS), 2008). Both genetic merit and production system were treated as class variables. Confounding variables adjusted for in the statistical model, where significant (P < 0.05), were sire breed, dam breed, dam parity and age at the time of measurement centered within production system. Age centered within production system was treated as a continuous variable. Non-linear associations between age and the dependent variables, as well as the existence of an interaction between genetic merit and production system, were also tested for significance in the model. Significance of individual terms in the model was based on the F-test, with the appropriate degrees of freedom. In the analysis of variables recorded during the grazing and pre-finishing silage periods, only steers were included in the data set and thus, production system was omitted from the model. Grazing batch was included in the model of analysis for data relating to the grazing period. Data pertaining to the finishing periods for both bulls and steers were analysed together.
An additional series of analyses included the independent variable, genetic merit of the sire, as a continuous variable, whereby genetic merit was defined as sire BCI, EPDWWT, EPDDMI, EPDCWT, EPDCONF and EPDFAT. All analyses were undertaken using fixed effect linear models in PROC GLM (SAS, 2008). Non-linear associations between genetic merit and the dependent variable, and interactions between genetic merit and production system were also investigated. Sire breed was not included in these analyses as genetic evaluations in Ireland are evaluated and presented across breeds.
For steers only, the correlation between DM intake during the grazing period, grass silage intake period and ad libitum concentrate-finishing period was estimated. Furthermore, the association between EPDDMI and steer progeny DM intake in the present study was evaluated for steers across the three feed-intake periods in a separate analysis, to determine if the association between sire EPDDMI and steer progeny DMI differed between different diets. The difference between the ‘expected profit’ and ‘observed profit’ between the high and low progeny was determined using PROC GLM (SAS, 2008). The existence of an interaction between genotypes (high and low sires) and measure of value (expected profit and observed profit) was used to determine if the difference between the profit measures differed between genotypes. In a separate analysis, observed profit in the progeny was regressed on sire BCI in an interaction with sire genotype to test whether the slope differed between the different genotypes.
Results
Feed intake
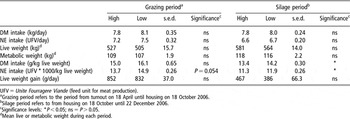
The effect of BCI, when treated as a class variable on feed intake measures in the steers during the grazing and silage periods, is summarised in Table 3. There was no significant difference between the steer progeny of high and low BCI sires for intake, mean live weight, live-weight gain or MWT during the grazing and silage periods. NE intake expressed relative to live weight during the grazing period tended to be significantly lower, while DM and NE intake expressed relative to live weight during the silage period were lower (P < 0.05) in the steer progeny of the high compared with the low BCI sires.
Effect of sire beef carcass index € (BCI) on dry matter (DM) intake and net energy (NE) during the grazing and silage periods in steer progeny

UFV = Unite Fourragere Viande (feed unit for meat production).
aGrazing period refers to the period from turnout on 18 April until housing on 18 October 2006.
bSilage period refers to from housing on 18 October until 22 December 2006.
cSignificance levels: *P < 0.05; ns = P > 0.05.
dMean live or metabolic weight during each period.
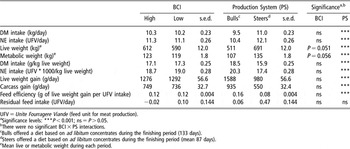
The effects of BCI, when treated as a class variable, and production system (bulls and steers) on feed intake and efficiency measures during the concentrate-finishing period are summarised in Table 4. There was no significant interaction between BCI and production system for any of the traits analysed. There was no significant difference in intake between the genetic groups, although the progeny of the high BCI sires were heavier (P = 0.051) than the progeny of the low BCI sires. No significant difference was evident in live-weight gain or carcass gain, intake expressed relative to live weight, feed efficiency or RFI between the two genetic groups.
Effect of sire beef carcass index € (BCI) and production system on dry matter (DM) intake, net energy (NE) intake, feed efficiency (live weight gain/NE intake) and residual feed intake during the finishing period

UFV = Unite Fourragere Viande (feed unit for meat production).
aSignificance levels: ***P < 0.001; ns = P > 0.05.
bThere were no significant BCI × PS interactions.
cBulls offered a diet based on ad libitum concentrates during the finishing period (133 days).
dSteers offered a diet based on ad libitum concentrates during the finishing period (mean 87 days).
eMean live or metabolic weight during each period.
Bulls had lower (P < 0.001) intake, mean live weight and MWT than steers during the finishing period. Intake expressed relative to live weight and MWT were greater (P < 0.001) in bulls. Greater (P < 0.001) live-weight gain, carcass-weight gain and feed efficiency were found in bulls, compared to steers. There was no significant difference in RFI between bulls and steers during the finishing periods.
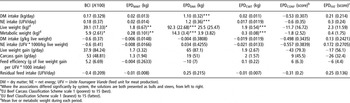
The effect of a €100 increase in sire BCI and a unit increase in sire EPDWWT, EPDDMI, EPDCWT, EPDCONF and EPDFAT on progeny DM intake, live weight, live-weight gain and efficiency measures during the concentrate-finishing period are summarised in Table 5. There was no evidence of non-linear effects between the genetic merit traits and the different performance measures; however, the linear associations sometimes differed with production system.
Regression co-efficients (s.e.) for beef carcass index (BCI), expected progeny differences for weaning weight (EPDWWT), dry matter intake (EPDDMI), carcass weight (EPDCWT), conformation (EPDCONF) and fat (EPDFAT) score on feed intake, efficiency (live weight gain/net energy intake) and residual feed intake during the finishing periodFootnote a

DM = dry matter; NE = net energy; UFV = Unite Fourragere Viande (feed unit for meat production).
a Where the associations differed significantly by system, the solutions are both presented as bulls and steers, from left to right.
b EU Beef Carcass Classification Scheme scale 1 (poorest) to 15 (best).
c EU Beef Classification Scheme scale 1 (leanest) to 15 (fattest).
d Mean live or metabolic weight during each period.
Mean live weight and MWT during the finishing periods increased (P < 0.05) with increasing sire BCI and sire EPDWWT. There was no significant effect of BCI or EPDWWT on intake, live-weight gain, carcass gain, feed efficiency, intake expressed relative to live weight or RFI.
Feed intake during the finishing period increased (P < 0.001) by 1.10 (s.e. = 0.32) kg per day with increasing sire EPDDMI and was consistent across both production systems. The effect of EPDDMI on mean live weight and MWT differed with production system with both escalating (P < 0.001) with increasing sire EPDDMI in bulls, but with no significant effect in steers. There was no other statistically significant effect of sire EPDDMI.
Mean live weight and MWT increased (P < 0.001) with increasing EPDCWT. There were no other significant associations with sire EPDCWT. Sire EPDCONF and sire EPDFAT were not significantly associated with feed intake or feed efficiency measures.
Within the steers, the correlation between DM intake during the grazing period and silage and ad libitum concentrate feeding periods was 0.30 and 0.26, respectively, which were both different (P < 0.05) from zero. A higher correlation of 0.53 was obtained between DM intake in the silage and concentrate feeding periods, which was different (P < 0.001) from zero. The linear regression coefficient of sire EPDDMI on steer DM intake was 0.02 (s.e. = 0.587), 1.04 (s.e. = 0.382), and 1.11 (s.e. = 0.323), when offered grazed grass, silage and concentrates, respectively.
Growth and carcass traits
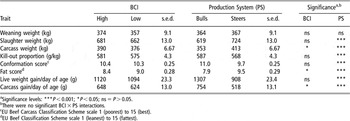
Progeny of high BCI sires had a 14 kg heavier carcass (P < 0.05) and 24 g higher carcass gain per day of age (P < 0.05) than the progeny of the low BCI sires (Table 6). There were no significant differences between the two genetic groups for kill-out proportions and carcass conformation score, but progeny of the high BCI sires had a lower (P < 0.05) carcass fat score. There was no significant difference in weaning weight between the two production systems. Bulls were lighter (P < 0.001) at slaughter, had a higher carcass conformation score, kill-out proportion, live-weight gain per day of age and carcass gain per day of age (P < 0.001), and a lower carcass fat score (P < 0.001) than steers.
Effect of sire beef carcass index (BCI) and production system on growth and carcass traits

aSignificance levels: ***P < 0.001; *P < 0.05; ns = P > 0.05.
bThere were no significant BCI × PS interactions.
cEU Beef Carcass Classification Scheme scale 1 (poorest) to 15 (best).
dEU Beef Classification Scheme scale 1 (leanest) to 15 (fattest).
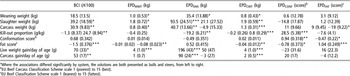
The effect of a €100 increase in sire BCI and a unit increase in sire EPDWWT, EPDDMI, EPDCWT, EPDCONF and EPDFAT, and growth and carcass related traits are detailed in Table 7. Non-linear associations were not evident, although the associations sometimes differed according to production system. Slaughter weight, carcass weight, live-weight gain per day of age and carcass gain per day of age increased (P < 0.05), whereas carcass fat score decreased (P < 0.001) with increasing BCI. The effect of BCI on kill-out proportion differed with production system with no significant effect in bulls and a positive (P < 0.01) effect in steers. There was no significant effect of BCI on weaning weight or carcass conformation score.
Regression co-efficients (s.e.) for beef carcass index (BCI), expected progeny differences for weaning weight (EPDWWT), dry matter intake (EPDDMI), carcass weight (EPDCWT), carcass conformation (EPDCONF) and fat (EPDFAT) score on growth and carcass traitsFootnote a

a Where the associations differed significantly by system, the solutions are both presented as bulls and steers, from left to right.
b EU Beef Carcass Classification Scheme scale 1 (poorest) to 15 (best).
c EU Beef Classification Scheme scale 1 (leanest) to 15 (fattest).
Weaning weight, live weight at slaughter and carcass weight, and live-weight gain per day of age increased (P < 0.05) with increasing sire EPDWWT. Sire EPDWWT was not associated with carcass fat score in bull progeny, but was negatively associated (P < 0.01) with carcass fat score in steers. There were no other significant effects of sire EPDWWT on carcass traits. Weaning weight increased (P < 0.05) and kill-out proportion decreased (P < 0.01) with increasing sire EPDDMI. The effect of sire EPDDMI on slaughter weight, carcass weight, live-weight gain per day of age and carcass gain per day of age was positive (P < 0.01) in the bulls, but with no significant effect (P < 0.05) in the steers.
Carcass weight increased by 1.3 kg (s.e. = 0.31) per kg increase in sire EPDCWT. Additionally, slaughter weight and live-weight gain per day of age also increased (P < 0.01), whereas carcass fat score decreased (P < 0.01) with increasing sire EPDCWT. There was no significant effect of increasing sire EPDCWT on carcass conformation score in the progeny. Carcass conformation score increased by 0.94 (s.e. = 0.318) per unit increase in sire EPDCONF. Kill-out proportion increased (P < 0.001), whereas carcass fat score decreased, (P < 0.05) with increasing sire EPDCONF. There were no other significant effects of sire EPDCONF. Carcass fat score increased by 1.04 (s.e. = 0.249) per unit increase in sire EPDFAT. Increasing sire EPDFAT had no significant effect on carcass weight in bulls and a negative effect (P < 0.05) in steers. Carcass conformation score decreased (P < 0.05) with increasing sire EPDFAT. There were no other significant effects of sire EPDFAT.
Discussion
The objective of this study was to quantify the effect of sire genetic merit for a recently developed, novel economically weighted genetic selection index, the BCI, on performance of both bull and steer progeny, managed in a controlled environment. Although the animals used in this study were included as progeny in the genetic evaluation of the sires for weaning weight and carcass traits, since it was not possible to request a separate genetic evaluation, the effect on the results is expected to be minimal because all sires were of high reliability. Although earlier studies have investigated the association between sire EPD and subsequent progeny performance (Núñez-Dominguez et al., Reference Núñez-Dominguez, Van Vleck and Cundiff1993; Crews, Reference Crews2002; Williams et al., Reference Williams, Moser and Clark2004), the authors are unaware of any other study that has evaluated the effect of the economic index of a sire on the performance of his progeny. The performance of the animals in the present study was similar to the findings of Drennan et al. (Reference Drennan, Moloney and Keane1994) and Drennan et al. (Reference Drennan, Carson and Crosse2005a) for similar bull and steer production systems, respectively, using the suckled progeny of beef cows.
Beef carcass index
The expected profit difference between the high and low BCI sires was €42, and the observed profit difference in the progeny was €53, calculated using the phenotypic performance for all five BCI traits. The €42 and €53 were not significantly different from each other; this implies that the BCI indexes of high reliability sires will be reflected in their progeny performance when evaluated under environmental conditions that are typical of production systems in Ireland, as was the case in this study. When partitioned across the five individual traits making up the BCI, the expected difference between the two genetic groups in BCI of €42 comprised proportionately, 0.14 weaning weight, 0.02 DM intake, 0.72 carcass weight, 0.06 carcass conformation score and 0.06 carcass fat score. The corresponding observed profit differences (€53) expressed in the progeny were 0.20, 0.02, 0.65, 0.07 and 0.06, respectively. This shows a similar pattern in relation to each of the five traits making up the BCI.
The directions of the associations of individual traits with increasing BCI were in agreement with expectations based on the sign of the weighting factors on the individual component traits of the BCI, despite the associations not always being significant. Progeny of high BCI sires had a greater carcass weight and a lower carcass fat score, but had a similar weaning weight, DM intake and carcass conformation score compared to progeny of low BCI sires. However, the effect of BCI on all of the individual traits need not always be significant. For example, selection for greater carcass weight, which is a trait included in the BCI with a large relative emphasis, is expected to increase DM intake, as the genetic correlation between carcass weight and DM intake in the Irish genetic evaluations is 0.46 (Evans R, ICBF, www.icbf.com, personal communication). Hence, the inclusion of negative weightings on some traits, such as DM intake in the BCI, will help in reducing this expected correlated increase in DM intake. This is further substantiated by the result that RFI decreased (P = 0.058) with increasing sire BCI. It may be argued that RFI should be a component of the index rather than DM intake because it is a better reflection of feed efficiency. However, its effectiveness in a selection index will also depend on its heritability, degree of genetic variation and genetic correlation with other important traits, all requiring further investigation.
The absence of a significant effect of BCI on weaning weight may be due to a number of reasons. For example, in comparison to the measurement of carcass weight, an inherently greater relative variation in the measurement of weaning weight would be expected due to the absence of a standard recording procedure for weaning weight, and the substantial effect on live weight, of both diet offered and the duration between feeding and weight recording, due to variation in the weight of rumen contents (Bath et al., Reference Bath, Ronning, Lofgreen and Meyer1966; Keane, Reference Keane1987). Weaning weight is included in the BCI because data shows that in spring-calving, temperate, pasture-based calf-to-beef production systems, live-weight differences at weaning are largely retained until slaughter (Drennan and McGee, Reference Drennan and McGee2004; Drennan et al., Reference Drennan, McGee and Keane2005b) and additionally, generally produced at a relatively lower cost than subsequent indoor winter finishing diets, given that pre-weaning growth is predominately a function of intake of grazed grass and dam milk yield. Weaning weight is also included in the genetic evaluation multi-trait model as an early predictor of carcass weight.
The fact that there were no production system interactions with increasing BCI, demonstrates that the index can be applied to both production systems that enhance its usefulness to the Irish beef industry, which although dominated by steer-based production systems, has a small but increasing bull beef element (Bord Bia, 2008).
Expected progeny differences
Weaning weight
The observed increase in progeny weaning weight was 1.0 kg (s.e. = 0.53) per kg increase in sire EPDWWT. Similarly, Barkhouse et al. (Reference Barkhouse, Van Vleck, Cundiff, Buchanan and Marshall1998) and Núñez-Dominguez et al. (Reference Núñez-Dominguez, Van Vleck and Cundiff1993) observed an increase in weaning weight of 0.98 kg and 0.88 kg, respectively, per kg increase in sire EPDWWT. Williams et al. (Reference Williams, Moser and Clark2004) reported an observed weaning weight of 0.66 (s.e. = 0.11) kg/kg in sire EPDWWT, and suggested that environmental differences such as differences in nutritional and health management may have been the cause of the lower association in their study. The variation in increases (0.66 to 0.98) in weaning weight per kg increase in sire EPD, may be influenced by pre-weaning nutrition in the animals on which the sire EPD was regressed. Another reason for the differences between studies may be due to the statistical model used for the regression analysis. For example, Williams et al. (Reference Williams, Moser and Clark2004) undertook the regression analysis using a mixed model with sire EPD treated as a random effect, whereas both Barkhouse et al. (Reference Barkhouse, Van Vleck, Cundiff, Buchanan and Marshall1998) and Núñez-Dominguez et al. (Reference Núñez-Dominguez, Van Vleck and Cundiff1993) treated sire EPD as a fixed effect, although the latter study used a mixed model with year of birth as a random effect. Numerous studies have shown that the main determinant of pre-weaning live-weight gain and consequently weaning weight in suckled calves is milk yield of the dam (Drennan and Bath, Reference Drennan and Bath1976; Gregory et al., Reference Gregory, Cundiff and Koch1992; McGee et al., Reference McGee, Drennan and Caffrey2005a). It is not clear from the earlier studies (Núñez-Dominguez et al., Reference Núñez-Dominguez, Van Vleck and Cundiff1993; Barkhouse et al., Reference Barkhouse, Van Vleck, Cundiff, Buchanan and Marshall1998; Williams et al., Reference Williams, Moser and Clark2004) that whether a maternal variance component was included in the genetic evaluation model to account for the effect of the dam (e.g., milk yield). Sire EPDWWT in Ireland are estimated using an across-breed animal model accounting for maternal effects such as parity of the dam.
Feed intake
The observed increase in progeny DM intake was 1.1 kg (s.e. = 0.32) per kg increase in sire EPDDMI. There was no interaction between sire EPDDMI and DM intake of the steer progeny on the three diets (grass, grass silage and concentrates). This suggests that the effect of sire EPDDMI, as estimated in Ireland, on feed intake is applicable across a wide range of diets. This is an important consideration as bull performance tests are generally carried out using high-concentrate diets offered ad libitum, whereas the main feed supply of their progeny in Ireland is grazed grass (Drennan et al., Reference Drennan, Carson and Crosse2005a). The near-zero regression coefficient (0.02, s.e. = 0.587) observed with grass DM intake per unit increase in sire EPDDMI probably partially reflects the difficulty in determining DM intake accurately with grazing cattle (Romanczak, Reference Romanczak2005). This is further supported by the fact that a correlation of 0.53 was obtained between daily DM intake during the silage and concentrate feeding periods, whereas the corresponding correlations with grass intake were close to zero.
As EPDDMI increased, RFI increased showing that increased intake was associated with decreased efficiency. This trend is undesirable. Although not always significant, feed intake was positively associated with carcass weight, and negatively associated with kill-out proportion and carcass conformation score. The indications are that selection for increased intake would result in increased size but decreased feed efficiency. The significant increase in live and carcass weight in bulls, with increasing EPDDMI, may be due to their superior growth potential compared to steers (Vanderwert et al., Reference Vanderwert, Berger, McKeith, Baker, Gonyou and Bechtel1985). While numerical increases in slaughter weight and decreases in carcass weight with increasing EPDDMI were obtained in steers, these were not significant.
Carcass weight
The observed increase in carcass weight of 1.3 kg (s.e. = 0.31) per kg increase in sire EPDCWT did not differ from the theoretical expectation of unity. Some reasons for the consistent result are the high reliability of the sires used in the present study, the moderate heritability for carcass weight (Hickey et al., Reference Hickey, Keane, Kenny, Cromie and Veerkamp2007) and the production environments adopted in the present study being reflective of commercial situations, especially for the steer production, thereby minimising any potential genotype by environment effects. Carcass weight responses to selection on sire EPDCWT reported in the present study were similar to results of Sasaki (Reference Sasaki1992) and Crews (Reference Crews2002), who reported observed increases of 1.05 kg and 1.16 kg in carcass weight, respectively, per 1 kg increase in the sire EPDCWT. Similarly, Keane and Diskin (Reference Keane and Diskin2007) reported that due to a combination of heavier live weight and better kill-out proportion, carcass weight in progeny of sires with higher genetic merit for growth were heavier (296 v. 277 kg) than progeny of sires with low genetic merit for growth. The lack of a significant relationship between EPDCWT and carcass conformation score agrees with the non-significant genetic correlation between carcass weight and carcass conformation in Irish cattle (Hickey et al., Reference Hickey, Keane, Kenny, Cromie and Veerkamp2007). However, a positive (0.49) genetic correlation between carcass weight and carcass conformation is assumed in the national genetic evaluations (Berry et al., Reference Berry, Shalloo, Cromie, Veerkamp, Dillon, Amer, Kearney, Evans and Wickham2007). As the sire EPDCWT increased, progeny carcass fat score decreased indicating that animals of greater growth potential are leaner, which agrees with the finding of Purchas et al. (Reference Purchas, Burnham and Morris2002). However, Hickey et al. (Reference Hickey, Keane, Kenny, Cromie and Veerkamp2007), using data on Irish cattle sired by Holstein sires, reported a positive genetic correlation (0.26; s.e. = 0.08) between carcass weight and carcass fat suggesting that genetic selection for heavier carcasses would, on an average, increase genetic predisposition for fatter carcasses. In contrast, a negative (−0.29) genetic correlation between carcass weight and carcass fat score is assumed in the national genetic evaluation (Berry et al., Reference Berry, Shalloo, Cromie, Veerkamp, Dillon, Amer, Kearney, Evans and Wickham2007), agreeing with the associations observed in the present study.
Conformation
The observed progeny increase in conformation score of 0.94 (s.e. = 0.32) per unit increase in sire EPDCONF is not different from the theoretical expectation of unity. Drennan and McGee (Reference Drennan and McGee2009) reported large differences between bulls and heifers for change in conformation (1.83 v. 0.01 for bulls and heifers, respectively; scale 1 to 15) per unit increase in sire EPDCONF. The increase in kill-out proportion with increasing sire EPDCONF, in the present study (29 g/kg increase in kill-out proportion per 1 unit increase in EPDCONF), was much higher than the value of 11 g/kg reported by Drennan and McGee (Reference Drennan and McGee2009). The decrease in carcass fat score with increasing sire EPDCONF agrees with the genetic correlations included in the national genetic evaluation (Berry et al., Reference Berry, Shalloo, Cromie, Veerkamp, Dillon, Amer, Kearney, Evans and Wickham2007). Similarly, Drennan et al. (Reference Drennan, McGee and Keane2008) reported a negative phenotypic correlation between carcass conformation score and carcass fat proportion.
Fat
A unit increase in sire EPDFAT accurately predicted the observed increase of 1.0 in carcass fat score in the progeny. In agreement, Drennan and McGee (Reference Drennan and McGee2009) reported an increase in carcass fat score of 0.95 per unit increase in sire EPDFAT. Similarly, Crews et al. (Reference Crews, Pollak and Quaas2004) reported an increase of 0.74 (s.e. = 0.26) in carcass subcutaneous fat thickness per unit increase in sire EPD for that trait. Increasing EPDFAT resulted in a significant decrease in the carcass weight of steers but had no significant effect in bulls. This is most likely due to the substantially greater fat deposition in steers than in bulls, resulting in steers being more responsive to changes in fat EPD.
The relationships between the expected and observed progeny differences in all five EPD traits were not different to the theoretical expectation of unity. This is a reflection of the fact that sires with high reliability were used in the study and hence, the more accurate estimations.
Production system
In agreement with the literature (Steen, Reference Steen1995; Keane, Reference Keane2003; Juniper et al., Reference Juniper, Bryant, Beever and Fisher2007), bulls in the present study had better conformation scores (11.0 v. 9.7; scale 1 to 15) and lower fat scores (7.9 v. 9.5; scale 1 to 15) than steers. The trends in kill-out proportion also agree with McGee et al. (Reference McGee, Keane, Neilan, Moloney and Caffrey2005b) who reported values of 548 and 535 g/kg in Charolais cross Holstein-Friesian bulls and steers, respectively. The lower kill-out proportion reported by McGee et al. (Reference McGee, Keane, Neilan, Moloney and Caffrey2005b) compared to the present study was due to the fact that their animals also consisted of Friesian and Holstein-Friesian breeds, whereas only continental breeds were included in this study. In addition, production system in the present study was also confounded with age, in that bulls and steers were slaughtered on average at 480 and 720 days of age, respectively.
Conclusions
Sire EPD values for weaning weight, DM intake, carcass weight and carcass conformation and fat scores were shown to be an accurate reflection of progeny performance. Furthermore, the regression of sire EPDDMI, estimated from data from a performance test station where animals are fed an ad libitum high-concentrate diet as well as from correlated traits, on steer DM intake did not differ when the animals were fed contrasting diets. Additionally, the observed differences in profitability of progeny of sires differing in BCI show good agreement with the expected profitability values. Results from this study indicate that the BCI is a useful tool in the selection of genetically superior sires and that actual progeny performance under the conditions of this study is within expectations for both bull and steer beef production systems.
Acknowledgements
The authors wish to acknowledge the farmers who provided the progeny required for this study, ICBF for help in identifying suitable progeny, Mr J. Marron for technical assistance, Grange farm staff for their detailed care and management of the animals and Dr A. Black for assistance with the grass intake experiment.