1 Introduction
Controlling transition to turbulence is vitally important in a variety of applications ranging from pipeline flows to mixing devices. In the former, turbulence undesirably enhances transport losses, whilst in the latter, it improves mixing efficiency. A large body of research has been devoted to specific passive and active control strategies to decrease transport losses by reducing the friction drag of turbulent flows (Jung, Mangiavacchi & Akhavan Reference Jung, Mangiavacchi and Akhavan1992; Baron & Quadrio Reference Baron and Quadrio1995; Quadrio & Ricco Reference Quadrio and Ricco2004; Kasagi, Suzuki & Fukagata Reference Kasagi, Suzuki and Fukagata2009; Quadrio Reference Quadrio2011; Brunton & Noack Reference Brunton and Noack2015). Another ongoing effort to control transition is aimed at manipulating the robustness of the laminar flow to perturbations via passive modifications of channel surfaces and linear feedback control techniques (Sreenivasan Reference Sreenivasan1982; Kim & Bewley Reference Kim and Bewley2007; Hof et al. Reference Hof, De Lozar, Avila, Tu and Schneider2010; Rabin, Caulfield & Kerswell Reference Rabin, Caulfield and Kerswell2014; Marensi, Willis & Kerswell Reference Marensi, Willis and Kerswell2019). The resulting strategies are largely based on the knowledge that, in subcritical shear flows, transition to long-lived turbulence occurs when both the Reynolds number, quantifying the ratio of the inertia of the flow to the viscous forces, exceeds a critical value  $Re_{c}$ (Avila et al. Reference Avila, Moxey, de Lozar, Avila, Barkley and Hof2011; Shi, Avila & Hof Reference Shi, Avila and Hof2013), and a sufficiently energetic disturbance is applied (Schmiegel & Eckhardt Reference Schmiegel and Eckhardt1997; Duguet et al. Reference Duguet, Monokrousos, Brandt and Henningson2013). A strategy designed to prevent transition can be deemed successful when it increases the volume of the basin of attraction of the laminar flow relative to the state-space volume. This relative volume is related to the edge of chaos, the manifold separating initial conditions that decay from those that transition (Skufca, Yorke & Eckhardt Reference Skufca, Yorke and Eckhardt2006; Schneider et al. Reference Schneider, Gibson, Lagha, De Lillo and Eckhardt2008; Chantry & Schneider Reference Chantry and Schneider2014). The edge of chaos comprises local attractors, the edge states and their stable manifolds. The importance of edge states has indeed been highlighted for boundary-layer and pipe flows, where their neighbourhood is often visited before transition (Mellibovsky et al. Reference Mellibovsky, Meseguer, Schneider and Eckhardt2009; Khapko et al. Reference Khapko, Kreilos, Schlatter, Duguet, Eckhardt and Henningson2016), and for plane Couette flow, where they have been related to optimal energy growth disturbances (Duguet, Brandt & Larsson Reference Duguet, Brandt and Larsson2010; Olvera & Kerswell Reference Olvera and Kerswell2017) and utilized for controlling transition to turbulence (Kawahara Reference Kawahara2005). The energy of the edge state, together with that of minimal seeds, i.e. that of the minimal-energy perturbations that trigger turbulence (Pringle, Willis & Kerswell Reference Pringle, Willis and Kerswell2012; Duguet et al. Reference Duguet, Monokrousos, Brandt and Henningson2013), can therefore be thought of as main scalar indicators of the robustness of the laminar flow to finite-amplitude perturbations.
A tempting way to design control strategies for transition is via the maximization of the energy of the minimal seed (Rabin et al. Reference Rabin, Caulfield and Kerswell2014) or of the edge state. In this paper, we show that such quantities may be insufficient to provide a reliable conclusion about the efficiency of control strategies. To address such shortcomings, we introduce a novel methodology: the statistical sampling of the phase space to determine the probability that perturbations laminarize as a function of their energy. We apply this approach in plane Couette flow where control is imposed via transverse wall oscillations (Jung et al. Reference Jung, Mangiavacchi and Akhavan1992; Baron & Quadrio Reference Baron and Quadrio1995; Quadrio & Ricco Reference Quadrio and Ricco2004; Rabin et al. Reference Rabin, Caulfield and Kerswell2014).
2 Protocol
We consider plane Couette flow, i.e. the flow confined between two infinite plates separated by a gap  $2h$ and moving in opposite directions with constant velocity
 $U$. The domain is periodic in the streamwise (period
 $\unicode[STIX]{x1D6E4}_{x}=4\unicode[STIX]{x03C0}h$) and in the spanwise (period
 $\unicode[STIX]{x1D6E4}_{z}=32\unicode[STIX]{x03C0}h/15$) directions, and no-slip boundary conditions are applied at the walls (Pershin, Beaume & Tobias Reference Pershin, Beaume and Tobias2019). The non-dimensionalized Navier–Stokes equation and the incompressibility condition are given by
 $$\begin{eqnarray}\displaystyle & \displaystyle \unicode[STIX]{x2202}_{t}\boldsymbol{u}+v\boldsymbol{e}_{\boldsymbol{x}}+y\unicode[STIX]{x2202}_{x}\boldsymbol{u}+(\boldsymbol{u}\boldsymbol{\cdot }\unicode[STIX]{x1D735})\boldsymbol{u}=-\unicode[STIX]{x1D735}p+\displaystyle \frac{1}{Re}\unicode[STIX]{x1D6FB}^{2}\boldsymbol{u}, & \displaystyle\end{eqnarray}$$
 $$\begin{eqnarray}\displaystyle & \displaystyle \unicode[STIX]{x1D735}\boldsymbol{\cdot }\boldsymbol{u}=0, & \displaystyle\end{eqnarray}$$
where  $Re=Uh/\unicode[STIX]{x1D708}$ is the Reynolds number,
 $\unicode[STIX]{x1D708}$ is the kinematic viscosity,
 $p$ is the pressure,
 $\boldsymbol{e}_{\boldsymbol{x}}$ is the unit vector in the streamwise direction and
 $\boldsymbol{u}$ satisfies homogeneous boundary conditions in
 $y$. To obtain these equations, we have decomposed the non-dimensional velocity
 $\boldsymbol{U}=\boldsymbol{U}_{lam}+\boldsymbol{u}$, where the laminar flow
 $\boldsymbol{U}_{lam}=y\boldsymbol{e}_{\boldsymbol{x}}$ and
 $\boldsymbol{u}$ is the incompressible perturbation with
 $v$ its
 $y$-component. The no-slip boundary conditions read
 $\boldsymbol{u}(y=\pm 1)=\mathbf{0}$.
We use Channelflow (Gibson Reference Gibson2014) to solve for the flow at various values of the Reynolds number  $Re>Re_{c}$, where
 $Re_{c}=325\pm 10$ is the critical value above which sustained turbulence can be observed (Dauchot & Daviaud Reference Dauchot and Daviaud1995; Shi et al. Reference Shi, Avila and Hof2013), and in the presence of control by wall oscillations at
 $Re=500$. The streamwise and spanwise coordinates are discretized using
 $N_{x}=32$ and
 $N_{z}=34$ Fourier coefficients and the wall-normal coordinate is discretized using
 $N_{y}=33$ Chebyshev coefficients based on the numerical resolution used in Pershin et al. (Reference Pershin, Beaume and Tobias2019). The temporal discretization is performed by means of third-order semi-implicit backward differentiation with time step
 $\unicode[STIX]{x0394}t=1/Re$. For
 $Re=500$, the time-averaged kinetic energy of turbulent flow realizations is
 $E_{turb}\approx 6\times 10^{-2}$, where the instantaneous kinetic energy
 $E$ for the state
 $\boldsymbol{u}$ is defined as
 $$\begin{eqnarray}E=\frac{1}{2}\langle \boldsymbol{u},\boldsymbol{u}\rangle =\frac{1}{2}\Vert \boldsymbol{u}\Vert ^{2}=\frac{1}{2V}\int _{\unicode[STIX]{x1D6FA}}\boldsymbol{u}\boldsymbol{\cdot }\boldsymbol{u}\;\unicode[STIX]{x2202}\unicode[STIX]{x1D6FA},\end{eqnarray}$$
where  $V=2\unicode[STIX]{x1D6E4}_{x}\unicode[STIX]{x1D6E4}_{z}=256\unicode[STIX]{x03C0}^{2}/15$ is the volume of the domain
 $\unicode[STIX]{x1D6FA}$. We time-integrate a number of initial conditions and assess their behaviour in the following way. If the kinetic energy of the resulting flow decays below
 $E_{lam}=E_{turb}/100$ for at most
 $t_{turb}=400$ time units, the flow is said to have laminarized. Conversely, if the energy exceeds
 $E_{turb}$, the flow is said to have transitioned. The role of the non-zero waiting time
 $t_{turb}$ is to ensure that an event where the flow exceeds
 $E_{turb}$ and decays immediately after is not counted as transitional. Such events associated with high-energy perturbations may be due to the crossing of the upper edge of chaos (Budanur et al. Reference Budanur, Marensi, Willis and Hof2020).
We compute  $P_{lam}(E^{(j)})$, the laminarization probability of a random initial perturbation (RP) of energy
 $E^{(j)}$. To do so, we consider
 $40$ energy levels
 $E^{(j)},j=1,\ldots ,40$, equispaced between
 $0$ and
 $(2/3)E_{turb}$. For each energy level, we generate
 $N$ RPs,
 $\boldsymbol{u}^{(j,k)},k=1,\ldots ,N$, which we time-integrate until one of the aforementioned energy thresholds is crossed to determine the type of flow. We use
 $N=100$ RPs per energy level, except for the
 $Re=500$ case, for which we considered
 $N=200$ to generate more accuracy and allow for a better assessment of the control strategy. We approximate
 $P_{lam}(E^{(j)})$ by the fraction of laminarizing RPs of energy
 $E^{(j)}$. One may observe that, due to the finite lifetime of turbulent trajectories in shear flows in small domains (Hof et al. Reference Hof, Westerweel, Schneider and Eckhardt2006), the laminarization probability may depend on the choice of
 $t_{turb}$. The transient lifetimes that we observed were all, at least, an order of magnitude larger than
 $t_{turb}$, making our results independent on this value. We also computed the edge-state kinetic energy
 $E_{edge}$ at
 $Re=400,500$ and
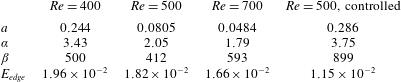
 $700$ using edge tracking (Skufca et al. Reference Skufca, Yorke and Eckhardt2006) and report the corresponding values in table 1. We demonstrate the edge tracking procedure at
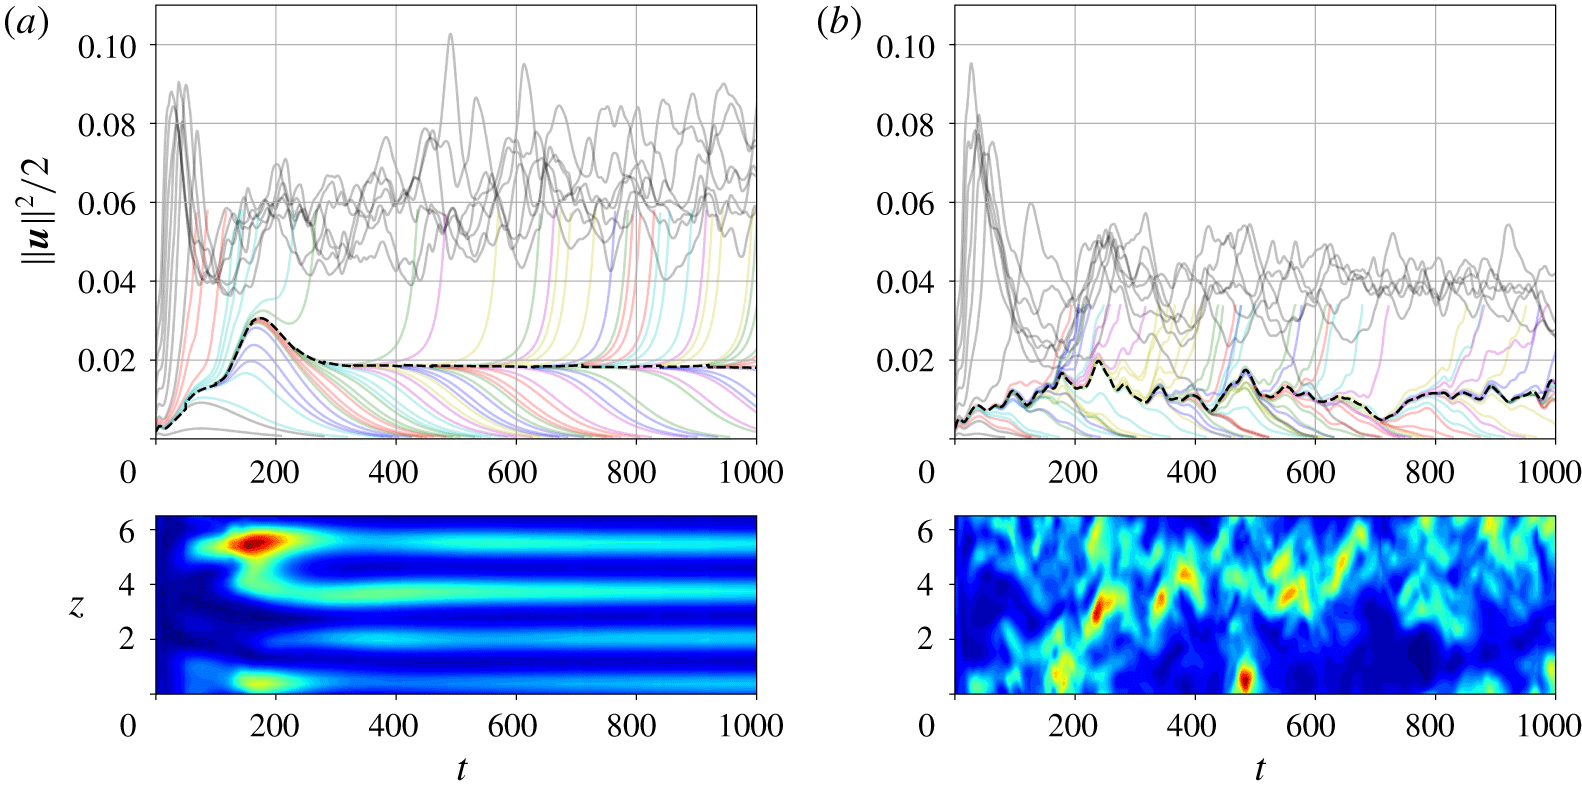
 $Re=500$ in figure 1(a), which yields
 $E_{edge}\approx 1.82\times 10^{-2}\approx (1/3)E_{turb}$. As can be seen from the bottom plane in figure 1(a), the edge state for the uncontrolled case is an equilibrium structurally similar to the edge state identified in Schneider et al. (Reference Schneider, Gibson, Lagha, De Lillo and Eckhardt2008) in a similar domain.
Values of parameters  $a,\unicode[STIX]{x1D6FC}$ and
 $\unicode[STIX]{x1D6FD}$ of the fitting function
 $p(E)$, as explained in the text, and of the time-averaged edge-state energy
 $E_{edge}$. These values are reported in four cases: for the uncontrolled system at
 $Re=400,500$ and
 $700$ and for the controlled system (spanwise wall oscillations with amplitude
 $W=0.3$ and frequency
 $\unicode[STIX]{x1D714}=1/16$) at
 $Re=500$.

Edge tracking results for (a) the uncontrolled and (b) the controlled cases at  $Re=500$ shown via the evolution of the norm
 $\Vert \boldsymbol{u}\Vert ^{2}/2$ in time (top panels). A set of initial conditions differing only by their amplitude are integrated forward in time (evolution shown in grey lines) to find the two closest trajectories that display different behaviour. At their point of divergence, both flow states are fed into the bisection-type algorithm in a repeated process (Skufca et al. Reference Skufca, Yorke and Eckhardt2006). Successive iterations are shown in light colours, together with the resulting edge trajectory in thick dashed line. The time evolution of the kinetic energy of the edge trajectories, averaged in the streamwise and wall-normal directions, is shown in the bottom panels for (a) the uncontrolled and (b) the controlled cases. Each edge trajectory approaches the corresponding edge state, which appears to be an equilibrium in the uncontrolled case (a) and a chaotic object in the controlled case (b).

To generate RPs, we first express them as a linear combination of the laminar flow field  $\boldsymbol{U}_{lam}$ and an incompressible orthogonal component
 $\boldsymbol{u}_{\bot }^{(j,k)}$, i.e.
 $\boldsymbol{u}^{(j,k)}=A\boldsymbol{u}_{\bot }^{(j,k)}+B\boldsymbol{U}_{lam}$, where
 $A$,
 $B$ and
 $\boldsymbol{u}_{\bot }^{(j,k)}$ are generated randomly,
 $\langle \boldsymbol{u}_{\bot }^{(j,k)},\boldsymbol{U}_{lam}\rangle =0$ and
 $\Vert \boldsymbol{u}_{\bot }^{(j,k)}\Vert ~=~1$. To ensure that
 $\boldsymbol{u}^{(j,k)}$ has energy
 $E^{(j)}$, we further impose
 $\Vert A\boldsymbol{u}_{\bot }^{(j,k)}+B\boldsymbol{U}_{lam}\Vert ^{2}=2E^{(j)}$. Turbulence in plane Couette flow is associated with shear concentration at the wall, yielding lower kinetic energies for the turbulent states than for the laminar flow. We thus find it intuitively useful to distinguish RPs with weakened bulk shear (
 $B<0$) from those that display stronger bulk shear (
 $B\geqslant 0$), the sets of which are hereafter called
 $\text{RP}-$ and
 $\text{RP}+$, respectively. The former can be thought of as being mostly located in phase space between the laminar (energetically higher) and the turbulent (energetically lower) flows, while the latter are located farther away from turbulence. We create such perturbations in three steps. First, we generate the random orthogonal component
 $\boldsymbol{u}_{\bot }^{(j,k)}$ by drawing its spectral coefficients from the uniform distribution so that the homogeneous boundary conditions are satisfied and
 $\Vert \boldsymbol{u}_{\bot }^{(j,k)}\Vert =1$. Next, we draw
 $B$ from the uniform distribution between
 $-2E^{(j)}/\Vert \boldsymbol{U}_{lam}\Vert$ and
 $2E^{(j)}/\Vert \boldsymbol{U}_{lam}\Vert$ and compute
 $A=\pm \sqrt{2E^{(j)}-B^{2}\Vert \boldsymbol{U}_{lam}\Vert ^{2}}$. To ensure that the RPs satisfy the no-slip boundary condition, we take advantage of the properties of our numerical scheme (Spalart–Moser–Rogers Runge–Kutta, see Spalart, Moser & Rogers (Reference Spalart, Moser and Rogers1991); leading to spatial operators solved using a Chebyshev tau algorithm, see Canuto et al. (Reference Canuto, Hussaini, Quarteroni and Zang1988)) and take two (small) time steps starting from
 $\boldsymbol{u}^{(j,k)}$. The resulting state is RP
 $\boldsymbol{u}^{(j,k)}$. (For small enough time steps, this procedure leads to negligible deviations in the energy level and in the coefficients
 $A$ and
 $B$ of the RP.) To ensure fair sampling, we use an equal number of positive and negative
 $B$ for each energy level.
3 Results
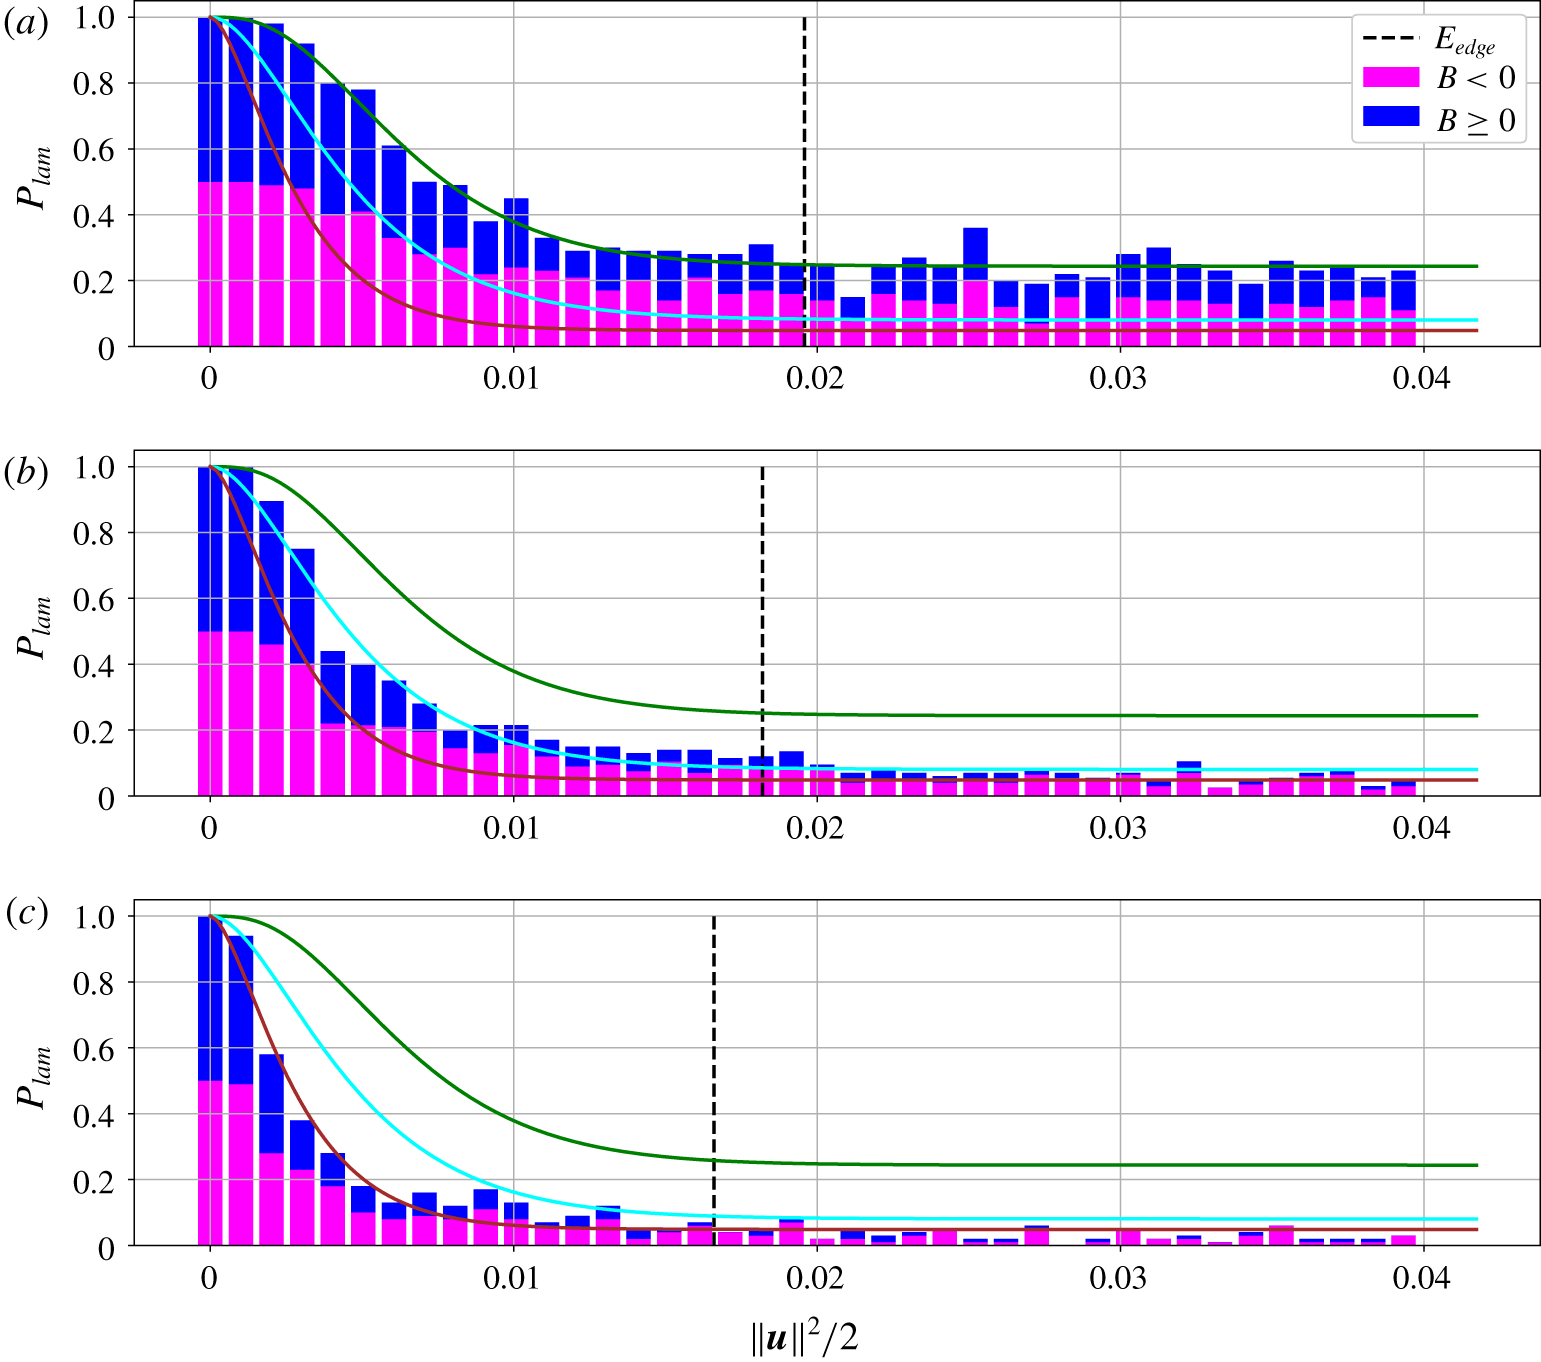
The results in the absence of any transition control are reported in figure 2 via the laminarization probability as a function of the RP energy at  $Re=400,500$ and
 $700$. We start the description from the
 $Re=500$ case. For sufficiently small initial disturbance energies, the laminarization probability tends to 1, owing to the fact that the laminar flow is linearly stable. The first transitioning RP was found at the third energy level
 $E^{(3)}\approx 4\times 10^{-3}$, providing an upper bound for the minimal seed energy,
 $E_{min}\leqslant 4\times 10^{-3}$, so that the minimal seed is located very close to the laminar fixed point. The laminarization probability decreases nearly monotonically as the RP energy increases to saturate at
 $P_{lam}\approx 0.08$, which we will hereafter quantify by
 $a$. Most of the laminarization probability decay occurs at small amplitude, i.e. for
 $E<E_{edge}$ (
 $P_{lam}(E_{edge})\approx 0.12$). For the most part, RP
 $-$ is responsible for the non-vanishing laminarization probability as the energy increases. The fact that
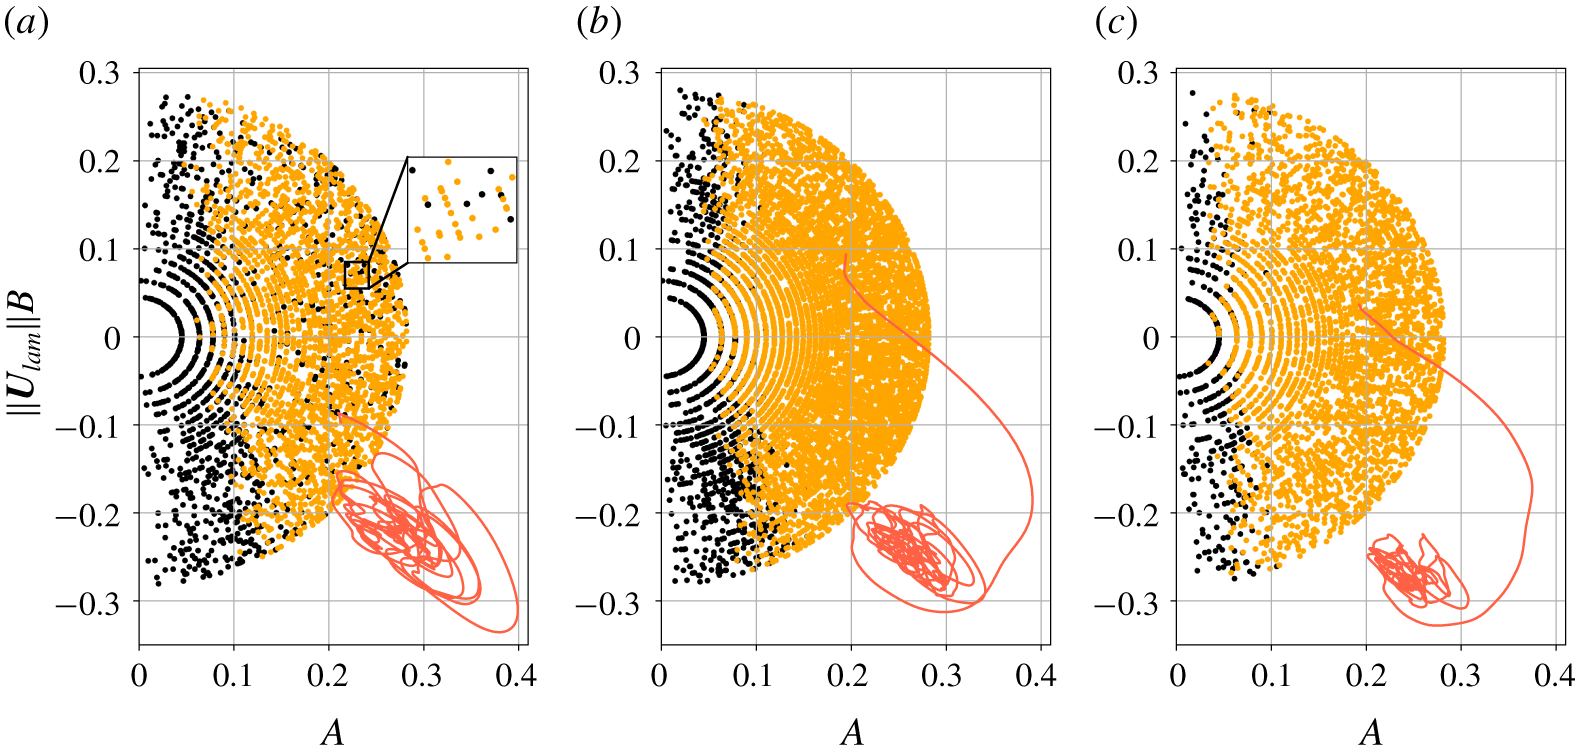
 $P_{lam}$ does not tend to zero even for large energies is a consequence of the edge structure: it has been shown to be wrapped around the turbulent saddle such that laminarizing RP regions are locally interleaved with transitioning RP regions (Chantry & Schneider Reference Chantry and Schneider2014), and to be fractal (Moehlis, Faisst & Eckhardt Reference Moehlis, Faisst and Eckhardt2004; Skufca et al. Reference Skufca, Yorke and Eckhardt2006). To understand further which RPs laminarize, we colour code them in the
 $A$–
 $\Vert \boldsymbol{U}_{lam}\Vert B$ plane according to their dynamics. The results for
 $Re=500$ are shown in figure 3(b).
Laminarization probability  $P_{lam}$ for
 $40$ equispaced energy levels from
 $0$ to
 $0.04$ in plane Couette flow calculated for three Reynolds numbers: (a)
 $Re=400$, (b)
 $Re=500$ and (c)
 $Re=700$. The probability contributions from RP
 $-$ (respectively RP
 $+$) are shown in magenta (respectively blue). The solid fitting curves (green for
 $Re=400$, cyan for
 $Re=500$ and brown for
 $Re=700$) correspond to
 $p(E)$, as explained in the text. The vertical dashed lines indicate the energy of the edge state at the relevant
 $Re$.

Representation of all the initial perturbations considered in figure 2 in the  $A$–
 $\Vert \boldsymbol{U}_{lam}\Vert B$ plane shown for (a)
 $Re=400$, (b)
 $Re=500$ and (c)
 $Re=700$. Laminarizing (respectively transitioning) perturbations are shown in black (respectively orange). Energy levels correspond to half-circles centred at
 $A=B=0$. Examples of turbulent trajectories emanating from transitioning perturbations and time-integrated for
 $t=2000$ time units are shown by red curves for each considered Reynolds number. Note that the distribution of the points in panel (b) is denser since we used
 $N=200$ RPs per energy level at
 $Re=500$.

Laminarizing RPs are found for small  $A$ and their number decreases as
 $B$ increases. Outside this clearly identifiable region, we observe very rare transitional events, evidencing the usefulness of our decomposition of the initial condition for the study of the robustness of the laminar flow. In addition, figure 3(b) shows a typical trajectory undertaken by a transitioning perturbation. This turbulent trajectory gets trapped in a small region located in the lower right corner of the figure and associated with the projection of the turbulent saddle onto the reduced subspace. This region corresponds to negative
 $B$, which confirms the physical reasoning behind our decomposition.
We now explore the dependence of these results on the Reynolds number. Increasing the Reynolds number from  $500$ to
 $700$ (figures 2c and 3c) reduces the upper bound for the minimal seed energy, which reflects the fact that the minimal seed energy exhibits a power-law decay as a function of
 $Re$ (Duguet et al. Reference Duguet, Monokrousos, Brandt and Henningson2013). Similarly, increasing
 $Re$ reduces the edge-state energy, in agreement with past studies (Wang, Gibson & Waleffe Reference Wang, Gibson and Waleffe2007). The probability associated with the distribution plateau also decreases as the Reynolds number increases (
 $a=0.244$ at
 $Re=400$ and
 $a=0.0484$ at
 $Re=700$), implying that less large-energy RPs laminarize. In general, the distribution
 $P_{lam}(E)$ becomes more peaked at
 $E=0$ as
 $Re$ increases, which reflects the anticipated shrinkage of the basin of attraction of the laminar flow as
 $Re$ is increased away from criticality. We can analyse the evolution of the basin of attraction of the laminar flow with
 $Re$ by inspecting the distribution of laminarizing and transitioning RPs in the
 $A$–
 $\Vert \boldsymbol{U}_{lam}\Vert B$ plane in figure 3. At
 $Re=700$, the laminarizing RPs are heavily concentrated in the region around
 $A=0$. Decreasing
 $Re$ slightly expands this region and, close to criticality, leads to the appearance of laminarizing RPs outside this region. Additionally, the representative transitioning trajectories shown in figure 3 indicate that the turbulent saddle expands in our projection of phase space as the Reynolds number is decreased. This reflects the fact that the variance of the turbulent kinetic energy grows as the Reynolds number is reduced towards the criticality (Faranda et al. Reference Faranda, Lucarini, Manneville and Wouters2014). Finally, figures 2 and 3 suggest that RP
 $+$ behaves similarly to RP
 $-$ for
 $Re=400$ but that their laminarization probability tends to decrease much faster than that of RP
 $-$ as the Reynolds number is increased.
The probability distribution for the uncontrolled case can be approximated by the cumulative distribution function for the gamma distribution reflected around  $0.5$ and saturated at
 $a$, i.e.
 $p(E)=1-(1-a)\unicode[STIX]{x1D6FE}(\unicode[STIX]{x1D6FC},\unicode[STIX]{x1D6FD}E)$, where
 $\unicode[STIX]{x1D6FE}(\unicode[STIX]{x1D6FC},\unicode[STIX]{x1D6FD}E)$ is the lower incomplete gamma function and the values of
 $\unicode[STIX]{x1D6FC}$,
 $\unicode[STIX]{x1D6FD}$ and
 $a$ are reported in table 1. The various coefficients have been determined via least-squares fitting and the resulting functions are shown in figure 2 by the solid lines. One can assess control strategies by simple quantitative comparison with the distribution at a particular Reynolds number. If the action of a control strategy leads to an increase of the laminarization probability, it is successful. The difference in the shape of the laminarization probability reveals important information about the sensitivity of the laminar flow to perturbations of various amplitudes and can be used as a measure for the relative increase of the size of the basin of attraction of the laminar flow, thereby quantifying control efficiency.
To demonstrate this, we impose in-phase spanwise wall oscillations, a strategy known to reduce the turbulent drag (Quadrio & Ricco Reference Quadrio and Ricco2004) and increase the energy of the minimal seed (Rabin et al. Reference Rabin, Caulfield and Kerswell2014). Under these oscillations, the modified boundary conditions read  $\boldsymbol{U}(y=\pm 1)=[\pm 1,0,W\sin (\unicode[STIX]{x1D714}t+\unicode[STIX]{x1D719})]$, where
 $W$,
 $\unicode[STIX]{x1D714}$ and
 $\unicode[STIX]{x1D719}\in [0;2\unicode[STIX]{x03C0})$ are the amplitude, the frequency and the phase of the oscillations. The laminar flow becomes oscillatory, which modifies equation (2.1) into equation (2.5) of Rabin et al. (Reference Rabin, Caulfield and Kerswell2014). We use parameter values close to the ones considered by Rabin et al. (Reference Rabin, Caulfield and Kerswell2014):
 $W=0.3$ and
 $\unicode[STIX]{x1D714}=1/16$, and set
 $Re=500$. For these parameter values and domain size, we find that the edge state is chaotic, as shown in figure 1(b), with average kinetic energy
 $E_{edge}^{(osc)}\approx 1.15\times 10^{-2}$, approximately 37 % less than for the uncontrolled edge state. We generate the RPs in the same way as for the uncontrolled case, except that we also impose a random phase
 $\unicode[STIX]{x1D719}$ drawn from a uniform distribution between
 $0$ and
 $2\unicode[STIX]{x03C0}$.
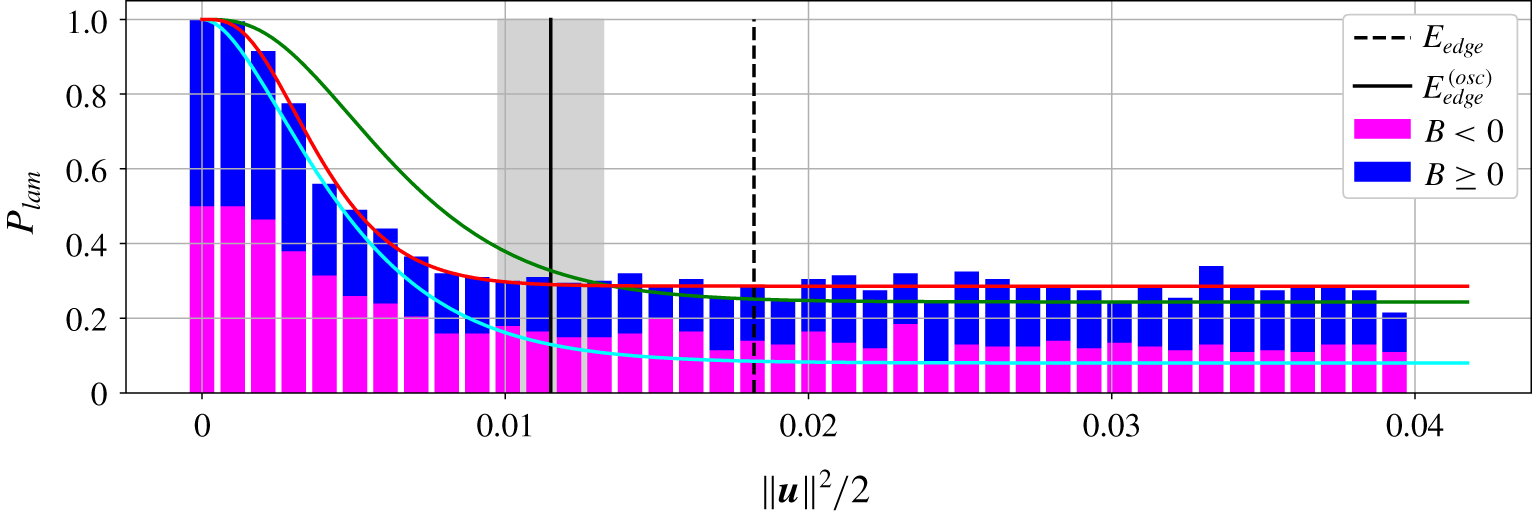
The laminarization probability for the controlled case is shown in figure 4. The resulting probability distribution decreases nearly monotonically to saturate around  $P_{lam}=0.3$ for large-energy RPs. This behaviour is qualitatively similar to that observed in the absence of control, but fundamental quantitative differences can be reported. Firstly, the probability distribution plateaus at lower RP energy than in the uncontrolled case. This results in a larger asymptotic value of
 $P_{lam}$, more than double its value in the absence of wall oscillation. Secondly, a non-negligible fraction of large-energy initial perturbations of
 $\text{RP}+$ are now found to laminarize.
Same as figure 2(b) but with the oscillating wall control enabled at  $Re=500$ as explained in the text. The green and cyan curves correspond to the fitting curves obtained in figure 2 for the uncontrolled case at
 $Re=400$ and
 $Re=500$, respectively, whereas the red fitting curve corresponds to that of the controlled case,
 $p_{osc}(E)$, as explained in the text. The region of standard deviation of the edge-state energy about its mean value is shaded in grey.

The effect of applying this control strategy onto transition at  $Re=500$ seems to be similar to that of reducing the Reynolds number in the absence of control (see figure 2a for
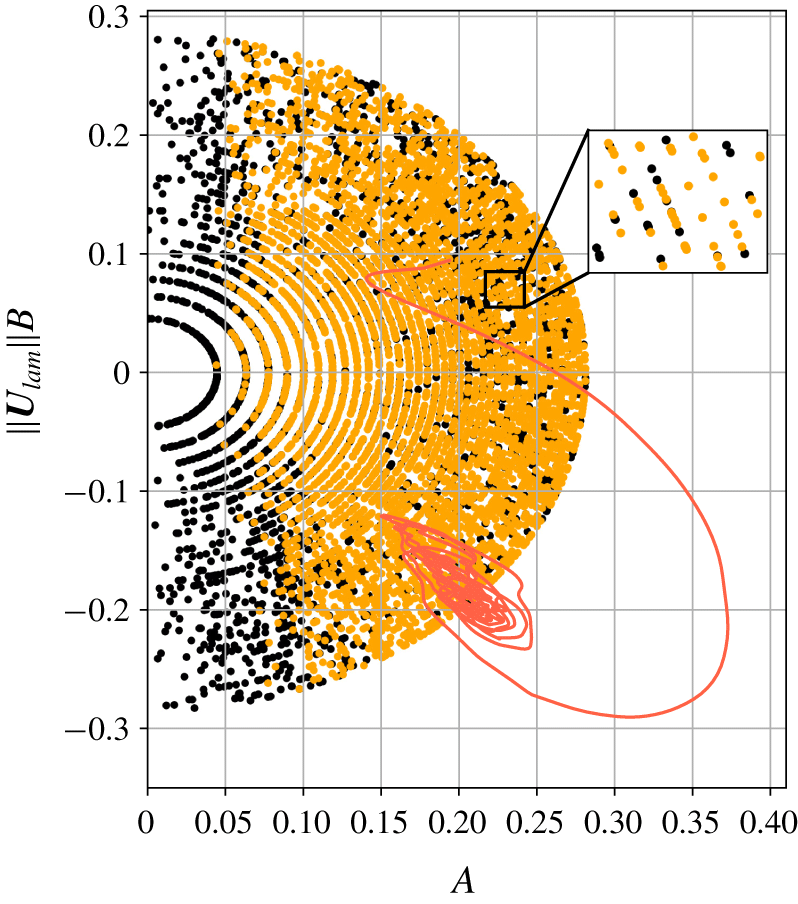
 $Re=400$) despite the fact that wall oscillations effectively increase the Reynolds number by making the walls move in the spanwise direction in addition to their steady motion in the streamwise direction. An important difference can, however, be highlighted: this control strategy did not statistically affect the behaviour of small-energy perturbations from the laminar flow. To shed more light on the effect of control on the distribution of the laminarizing and transitioning RPs, we show, in figure 5, a similar representation of the initial conditions as in figure 3(b) but for the controlled case. We recover the small-
 $A$ region where laminarization was found in the uncontrolled case; however, we also found laminarizing RPs at larger amplitude, scattered around the region where all RPs transitioned in the absence of control. This result also bears resemblance with that at
 $Re=400$ in the absence of control (see figure 3a). The newly controlled RPs decay via overshooting, i.e. their energy first significantly exceeds
 $E_{turb}$ before decaying nearly monotonically. The initial phase
 $\unicode[STIX]{x1D719}$ of the RPs did not seem to play any role in determining whether or not the flow will laminarize.
Same as figure 3(b) but with the oscillating wall control as explained in the text.

The laminarization probability in the controlled case can be approximated by the fitting function  $p_{osc}(E)$, which shares the same structure as
 $p(E)$ but with parameter values shown in table 1. The relative probability increase can thus be computed as
 $(p_{osc}(E)-p(E))/p(E)$ averaged over the range of the considered energies. We found that this quantity is equal to
 $1.8$, so that, on average, the laminarization probability of an RP nearly doubles under the action of the aforementioned control strategy. When a single value is not satisfactory to assess the control efficiency, more detailed information can be obtained via inspecting the differences between the laminarization probabilities at each energy level.
While the fate of perturbations in the uncontrolled flow at  $Re=500$ is sensitive to the strength of the initial bulk shear measured by parameter
 $B$, this is no longer the case in the presence of control via spanwise wall oscillation. Furthermore, the energy of the edge state decreases under the effect of the oscillating wall. Assuming that the edge-state energy is proportional to the relative volume of the basin of attraction of the laminar fixed point, this could be interpreted as the failure of the control strategy to postpone transition. However, the more exhaustive analysis of phase space provided here shows that the chosen control strategy increases the laminarization probability of perturbations, which implies that this strategy is effective. The use of the minimal seed does not seem to provide a better basis for control assessment: the shape of the basin of attraction of the laminar flow is such that, in this study, most perturbations generated with four times the energy of the minimal seed laminarized, making it difficult to extrapolate any reliable information. These observations further strengthen our approach to consider a more exhaustive method to assess control.
4 Discussion
In this paper, we have introduced a new way to analyse the robustness of the laminar flow to perturbations and to assess control strategies. We proceeded by sampling phase space in the neighbourhood of the laminar flow and evaluating the probability that the sampled initial conditions laminarize as a function of their initial energy. Our laminarization probability bears similarities with the notion of basin stability introduced in the dynamical system context of vegetation growth (Menck et al. Reference Menck, Heitzig, Marwan and Kurths2013). Our results for plane Couette flow in a small domain indicate that the laminarization probability decreases as the kinetic energy of the initial perturbation from the laminar flow is increased. It may increase back to  $1$ for sufficiently large initial energy levels as a consequence of the location of the upper edge of chaos (Budanur et al. Reference Budanur, Marensi, Willis and Hof2020). We identified that the laminarization probability decreases as the Reynolds number is increased, which reflects the contraction of the basin of attraction of the laminar flow. Two plausible scalar proxies for the relative volume of this basin, the edge state and the minimal seed energies, though having different asymptotic scalings with respect to
 $Re$, similarly reflect this expansion: their values increase as
 $Re$ is reduced towards the criticality (Wang et al. Reference Wang, Gibson and Waleffe2007; Duguet et al. Reference Duguet, Monokrousos, Brandt and Henningson2013).
To assess how the basin of attraction of the laminar flow changes under the action of control, the distribution of the laminarization probability obtained in the uncontrolled set-up can easily be recomputed and compared in the presence of control. We tested this methodology under control via spanwise wall oscillations at  $Re=500$. It was shown that, under the action of similar control, the minimal seed energy increases (Rabin et al. Reference Rabin, Caulfield and Kerswell2014), while we observed that the energy of the edge state decreases. The use of the newly introduced laminarization probability provides a much more in-depth understanding of the alteration of the robustness of the laminar flow. In particular, it revealed that the control strategy under consideration provided a major improvement in the robustness of the laminar flow, especially against large-energy perturbations. The controlled case gave similar results to the uncontrolled flow at
 $Re=400$. The laminarization probabilities differ in a subtle way: the control strategy is not efficient in laminarizing small-energy RPs but acts favourably on large-energy RPs. These observations suggest that, in contrast to the laminarization probability, scalar criteria for the robustness of the laminar flow, such as the energy of the edge state or of the minimal seed, may not be able to capture enough information to assess control strategies, a fact already noted for the edge states in the polymer drag reduction studies (Stone, Waleffe & Graham Reference Stone, Waleffe and Graham2002; Stone et al. Reference Stone, Roy, Larson, Waleffe and Graham2004).
In setting up our protocol, we had to make a choice on the form of the random initial perturbation. We opted for randomizing their spectral coefficients uniformly, which might not be the ideal choice if one knows what form of perturbations are triggered in a given configuration. We stress that the current work represents a proof of concept to pave the way to customizable and more relevant protocols. There are many possibilities to constrain the initial perturbations and increase their relevance to given situations. For example, one can impose a certain shape for the spectral energy of the initial perturbations, or confine them to certain locations in the physical domain.
We believe that the methodology introduced in this paper will prove useful to control other flows (Khapko et al. Reference Khapko, Kreilos, Schlatter, Duguet, Eckhardt and Henningson2013; Zammert & Eckhardt Reference Zammert and Eckhardt2015; Watanabe, Iima & Nishiura Reference Watanabe, Iima and Nishiura2016; Chantry, Tuckerman & Barkley Reference Chantry, Tuckerman and Barkley2017) and anticipate that, owing to the nature of transition to turbulence, it will be helpful to the study and control of a range of nonlinear systems displaying finite-amplitude instability.
Acknowledgements
This work was undertaken on ARC3, part of the High Performance Computing facilities at the University of Leeds, UK. The authors wish to thank C. Bick and R. Kerswell for fruitful discussions and the anonymous referees for their suggestions, which led to a significant improvement of the paper.
Declaration of interests
The authors report no conflict of interest.