


Introduction
To contain the projected increase of long-term care (LTC) costs due to population ageing, many Western societies, including the Netherlands, have reformed their LTC system in the past decades. These reforms necessitated ‘ageing in place’, implying that older people with impaired health continue to live at home as long as possible (Pani-Harreman et al. Reference Pani-Harreman, Bours, Zander, Kempen and van Duren2021). As a consequence, the demand for home care has increased. Home care is often provided by a mix of unpaid informal care-givers (i.e. care provided by people located in one’s social network), assisted by publicly and privately paid formal care-givers (Colombo et al. Reference Colombo, Llena-Nozal, Mercier and Tjadens2011). Yet, the possibilities to provide informal care are expected to decrease due to the rising labour market participation of women, higher retirement age, higher age of partner care-givers and more complex family structures (Pickard Reference Pickard2015; Broese van Groenou and De Boer Reference Broese van Groenou and De Boer2016; Wu et al. Reference Wu, Margolis, Verdery and Patterson2024). In addition, the availability of publicly provided care also suffers from a decreasing number of employees in the care sector (Organisation for Economic Co-operation and Development (OECD) 2023). Given the projected scarcity of both informal and publicly paid care-givers in the years to come (Freedman et al. Reference Freedman, Agree, Seltzer, Birditt, Fingerman, Friedman, Lin, Margolis, Park, Patterson, Polenick, Reczek, Reyes AM, Truskinovsky, Wiemers, Wu, Wolf, Wolff and Zarit2024), this may leave care recipients at risk of unmet care needs and hampered wellbeing. Therefore, it is imperative that care recipients develop well-functioning care networks, to receive optimal levels of care and wellbeing.
To gain insight into LTC networks and wellbeing in future cohorts of older care recipients, we may learn from studying these associations in changing LTC contexts. Long-term comparison of care use is preferably examined in single country studies, in which the total population experiences the same macro-level developments (e.g. socio-demographic changes and cultural perspectives on care) over time. The present long-term within-country comparisons show a consistent substitution effect between formal care and informal care use, in the UK (Pickard Reference Pickard2012), the Netherlands (Plaisier et al. Reference Plaisier, Verbeek-Oudijk and de Klerk2017; Van den Broek et al. Reference Van den Broek, Dykstra and van der Veen2019), Scandinavian countries (Rostgaard and Szebehely Reference Rostgaard and Szebehely2012; Dahlberg et al. Reference Dahlberg, Berndt, Lennartsson and Schön2018; Szebehely and Meagher Reference Szebehely and Meagher2018) and the USA (Tennstedt et al. Reference Tennstedt, Harrow, Crawford, Cowart and Quadagno2013; Van Houtven et al. Reference Van Houtven, Konetzka, Taggert and Coe2020). Even despite their differences in LTC regimes, these studies imply that austerity measures in publicly provided care might increase the use of informal or privately paid care by older adults.
This study builds on previous work on LTC use in the Netherlands, using data from the Longitudinal Aging Study Amsterdam (Hoogendijk et al. Reference Hoogendijk, Deeg, de Breij, Klokgieters, Kok, Stringa, Timmermans, van Schoor, van Zutphen and van Der Horst2020, Reference Hoogendijk, van Schoor, Qi, Visser, Swinkels, Broese van Groenou, Kok, Holwerda, Pasman, Onwuteaka-Philipsen, Remmelzwaal, Van Ingen, Van Tilburg, Van Haaster, Van der Horst, Poppelaars, Deeg and Huisman2025) between 1992 and 2022. In these 30 years the LTC regime in the Netherlands shifted from a rather generous and universal LTC system steered at the national level into a regime with limited access to residential care and decentralization of the allocation of formal care (Da Roit Reference Da Roit, Ranci and Pavolini2012; Maarse and Jeurissen Reference Maarse and Jeurissen2016). In such a long period, changes in LTC policies coincide with other societal developments as the increased labour market participation of women, shifting values regarding the role of government versus families in providing care for older adults, and extended healthy life expectancies in the population (Kroneman et al. Reference Kroneman, de Jong, Polin K and Webb2025). These macro-level changes indicate shifting opportunities and preferences regarding LTC use which may explain why Dutch older adults in recent years use less LTC in general (Aaltonen et al. Reference Aaltonen, Deeg and Broese van Groenou2024), but in particular less residential care (Alders et al. Reference Alders, Comijs and Deeg2017) and informal care (Aaltonen et al. Reference Aaltonen, Deeg and Broese van Groenou2024) compared to their age-peers in the nineties. What seems consistent is the fact that formal care use is the most negatively associated with wellbeing in different time periods (Abbing et al. Reference Abbing, Suanet and Broese van Groenou2022; Swinkels et al. Reference Swinkels, Abbing and Broese van Groenou2025). The current study extends our previous work by (1) focusing on specific care network types compared to use of single types of care-giver (Aaltonen et al. Reference Aaltonen, Deeg and Broese van Groenou2024) and (2) comparing the prevalence of care network types and their association with wellbeing (Abbing et al. Reference Abbing, Suanet and Broese van Groenou2022; Swinkels et al. Reference Swinkels, Abbing and Broese van Groenou2025) in four different time periods ten years apart (1992, 2002, 2012 and 2022), representing shifting LTC policies in the Netherlands. Specific research questions are elaborated after a short description of the LTC policies in the four time periods.
Developments in LTC care regimes in the Netherlands between 1992 and 2022
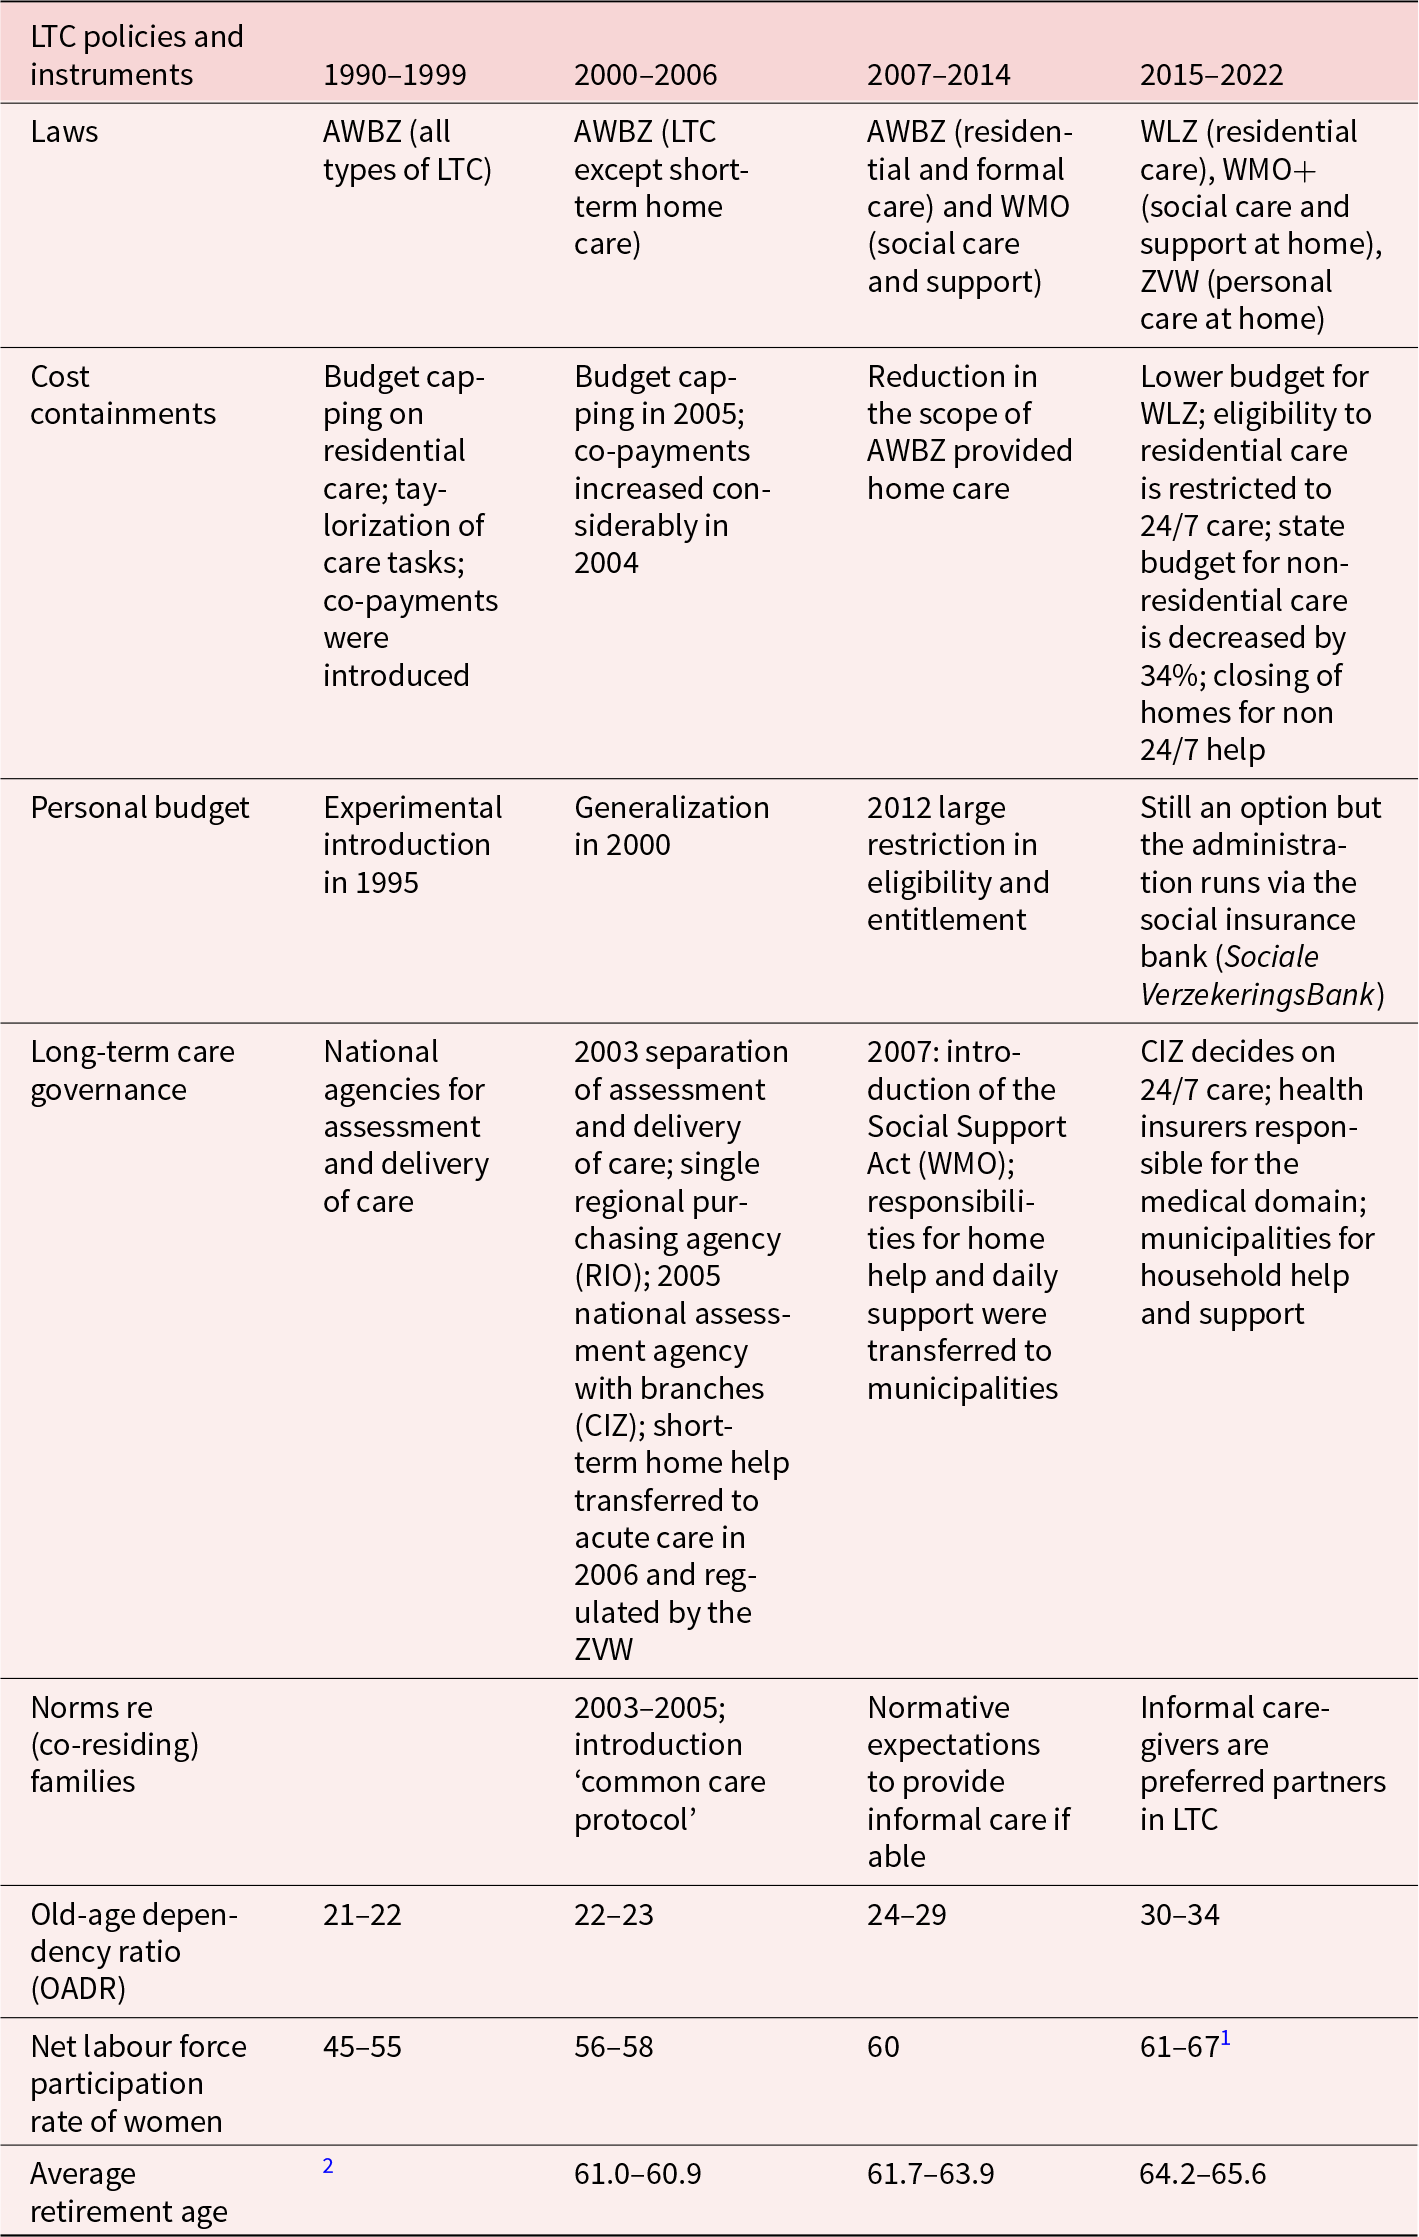
Although LTC policies in the Netherlands are subject to a continuous process of reform, the developments between 1992 and 2022 can be described in specific choices for cost containment, governance of types of care and normative expectations regarding families. The overview in Table 1 is compiled from several papers on LTC changes in the Netherlands (Da Roit Reference Da Roit, Ranci and Pavolini2012; Van Ginneken and Kroneman Reference Van Ginneken and Kroneman2015; Maarse and Jeurissen Reference Maarse and Jeurissen2016; Kroneman et al. Reference Kroneman, de Jong, Polin K and Webb2025). Overall, the Dutch LTC regime is a system with large national coverage, it is mainly needs based and it mainly provides services for all types of home care in addition to residential care. The budget spent on LTC is, even after the budget cuts resulting from the 2015 reform, among the highest in Europe (OECD 2023). The generosity of the system is still remarkable, but in the past decades cost-containment strategies, governance responsibilities and normative discourse on family care have followed a certain pattern, which is made visible in Table 1.
An overview of the changes in LTC policies in the Netherlands between 1992 and 2022

Table 1 Long description
Four time periods from 1990–1999 to 2015–2022 compare Dutch long-term care laws, cost-containment measures, personal budgets, governance, family-care norms, and selected demographic indicators. Legal responsibility moves from AWBZ covering most LTC in the 1990s to a split system by 2015–2022: WLZ for residential care, WMO for social support at home, and ZVW for personal care at home. Cost containment intensifies over time, from budget caps and new co-payments in the 1990s to reduced home-care scope in 2007–2014 and, after 2015, lower WLZ budgets, stricter residential eligibility focused on round-the-clock care, a large cut to non-residential budgets, and closures of homes for people without round-the-clock needs. Personal budgets start as an experiment in 1995, become general in 2000, face major restrictions in 2012, and remain available later with administration routed through the Social Insurance Bank. Governance shifts from national assessment and delivery to separated assessment and purchasing bodies in the early 2000s, then to greater municipal responsibility under the Social Support Act (WMO) from 2007, with CIZ deciding on round-the-clock care after 2015 while insurers cover medical care. Expectations of family and informal care become more explicit from the mid-2000s onward, culminating in informal caregivers being treated as preferred partners. Over the same decades, the old-age dependency ratio rises from the low twenties to the low-to-mid thirties, women’s labour force participation increases from mid-forties to the sixties, and average retirement age rises into the mid-sixties; some later-year statistics are limited by data availability and methodological changes.
Notes: AWBZ: Exceptional Health Expenditure Law (Algemene Wet Bijzondere Ziektekosten); WMO: Social Support Act (Wet Maatschappelijke Ondersteuning); WLZ: Long-Term Care Act (Wet Langdurige Zorg); ZVW: Health Insurance Act (Zorgverzekeringswet); RIO: Regional Purchasing Agency (Regionaal Inkooporgaan); CIZ: Center for Care Assessment (Centrum Indicatiestelling Zorg).
Sources: Da Roit Reference Da Roit, Ranci and Pavolini2012; Van Ginneken and Kroneman Reference Van Ginneken and Kroneman2015; Maarsse and Jeurissen Reference Maarse and Jeurissen2016. OADR = The old-age dependency ratio is the ratio of the number of persons aged 65 and over to the number of persons aged 20–64, expressed per 100 persons of working age; Net labour force participation rate = the percentage of the employed labour force in the total population (both active and inactive) aged 15 to 75 years.
1 Due to methodological changes, statistics are available until 2021.
2 Statistics not available.
Our empirical baseline is 1992, for which the LTC regime can be described as generous, universalistic and completely governed by the state. During the 1990s, new public management terms were introduced in the care system to make it more cost-efficient. During our second time point (the year 2002), the organization of home care was on its way to several cost-containment strategies that became effective after 2003. Many cost-containment strategies followed in the early 2000s with a concrete new law, the Social Support Act (Wet maatschappelijke ondersteuning, WMO) in 2007, with municipalities taking over the responsibility for household care and support. At our third empirical time point in 2012, the LTC regime was on its way to an important shift in governmental responsibilities and this was introduced with a discourse on caring communities and more reliance on informal care (Kroneman et al. Reference Kroneman, de Jong, Polin K and Webb2025). With the 2015 reform, the original Exceptional Health Expenditure Law (Algemene Wet Bijzondere Ziektekosten AWBZ) was abolished, and residential care was restricted to those in need of 24/7 care. The municipality and care insurers were responsible for LTC at home, as they were seen as being closer to the care recipients and thus better able to tailor the care to individual needs. A larger support system for informal care-givers also became the responsibility of municipalities. Our fourth empirical time point in 2022 may reflect how citizens and care organizations have adjusted to the new legislation and eligibility criteria, and to what degree ‘ageing in place’ is translated in specific types of care network. At the same time, one major policy shift occurred, when the Covid-19 pandemic hit the world in early 2020. Like many Western European countries, the Netherlands implemented lockdowns with various levels of strictness including general social distancing rules, a night-time curfew and complete closure of non-essential stores. The last partial lockdown was implemented from November 2021 until January 2022 (Klokgieters et al. Reference Klokgieters, Penninx, Rius Ottenheim, Giltay, Rhebergen and Kok2023), which coincided with our data collection. While the exact consequences for care-giving to older adults are unknown, it is known that many formal home‐care services and day programmes were curtailed or reorganized to limit infection. Families and neighbours often stepped in, making the experience of ‘formal vs. no care’ less distinct (Tur-Sinai et al. Reference Tur-Sinai, Bentur, Fabbietti and Lamura2021). None of the studies investigating changes in care networks in the Netherlands (e.g. Abbing et al. Reference Abbing, Suanet and Broese van Groenou2022) have included a time point in this setting .
Socio-demographic changes between 1992 and 2022
Other changes related to broader socio-demographic changes that occurred during the same time period are also listed in Table 1. The old-age dependency ratio, defined as the number of persons aged 65 and over relative to those aged 20–64, has risen sharply over the past three decades, reflecting the significant population ageing that has occurred between the 1990s and the 2020s. As a result, fewer younger adults are available to support a growing share of older adults. At the same time, women, who have traditionally provided much of this informal care (Brandt Reference Brandt2024), have increasingly entered the workforce. While this shift marks an important step towards emancipation, it raises questions about the overall availability of care-givers and whether men will step in to fill this role. Furthermore, the steady rise in the average retirement age reduces the pool of potential partner care-givers. Other, less clear-cut demographic and social changes include individualization, heightened divorce rates and the weakening of traditional ties and family bonds, enhancing the complexity of forming well-functioning informal care networks (Fingerman et al. Reference Fingerman, Pillemer, Silverstein and Suitor2012).
Research questions
Care network types: prevalence over time
Many studies use rather broad categories of care arrangements such as informal care only, formal care only and mixed care arrangements (Floridi et al. Reference Floridi, Carrino and Glaser2021). Yet, this disregards the fact that many older adults receive care from multiple types of informal care-givers and diverse mixed care arrangements, and this diversity can be captured better by studying care network types (Fast et al. Reference Fast, Keating, Otfinowski and Derksen2004; Ho et al. Reference Ho, McGill, Malden, Wilson, Pearce, Kaner, Vines, Aujla, Lewis and Restocchi2023). Different types of care network do exist, ranging from the small (marital) partner only care network to large mixed care networks with a majority of either formal or informal care-givers (Jacobs et al. Reference Jacobs, Broese van Groenou, Aartsen and Deeg2018; Gardeniers et al. Reference Gardeniers, Huisman, Meijboom, Hoogendijk and Broese van Groenou2024). In studying the association between care network types and wellbeing, the presence of specific types of care-giver is most important. In particular, the presence of either a spouse or formal care-givers seems distinctive for wellbeing (Broese van Groenou Reference Broese van Groenou2020; Abbing et al. Reference Abbing, Suanet and Broese van Groenou2022; Swinkels et al. Reference Swinkels, Abbing and Broese van Groenou2025). Therefore, this study uses four a priori care network types, each including a specific type of care-giver present, who may (or not) be complemented by other types of care-giver: (1) a partner care network, with possibly other types of informal or privately paid care-giver present, but without the presence of formal care-givers; (2) a non-partner care network, with only informal care-givers, possibly privately paid care, but no formal care-givers; (3) a formal publicly paid care network, with or without the presence of other types of care-giver; and (4) a privately paid only care network with no other formal or informal care-givers present. A fifth group (5) is composed of persons using no care at all.
The composition of the four care network types is largely dependent on individual-level factors that in general determine care use as predicted by the Andersen and Newman model (Andersen and Newman Reference Andersen and Newman1973): need for care (indicated by health problems), disposition to use care (e.g. gender, age, education) and factors enabling the use of care (e.g. income, presence of a spouse, availability of formal care-givers). Yet, the prevalence of these individual-level drivers has changed in the population between 1992 and 2022 (Broese van Groenou and De Boer Reference Broese van Groenou and De Boer2016; Kroneman et al. Reference Kroneman, de Jong, Polin K and Webb2025). For example, regarding the need for care, current generations of older people report a later onset of health problems than their age-peers a few decades ago, although consequences for care-giving are unclear as older people more often report to suffer from multiple diseases (Timmermans et al. Reference Timmermans, Hoogendijk, Broese van Groenou, Comijs, van Schoor, Thomése and Huisman2019). Regarding dispositional factors, more older people are higher educated (Klokgieters et al. Reference Klokgieters, Kok, Visser, Broese van Groenou and Huisman2021), and regarding enabling factors, more older people have a (marital) partner who lives longer, allowing them to share their lives together until later in life, but have fewer children (Brandt Reference Brandt2024). In addition, broader social demographic and LTC policies may have added to differences in the prevalence of care network types, as both informal and formal care may have become less available, as discussed earlier.
Adjusting for individual-level drivers of care use (physical and cognitive health, gender, age, education, marital status), a comparison of the prevalence in care networks over time will indicate the potential impact of (un)observed changes at the macro level. The first research question (RQ1) asks: to what degree does the prevalence of care network types in 2002, 2012 and 2022 differ from 1992, after adjusting for individual drivers of care use?
Care network types and psychological wellbeing
The empirical link between care network types and psychological wellbeing has been fairly consistent in various studies. Generally, receiving care from a partner and other informal care-givers and privately paid care-givers is associated with higher levels of psychological wellbeing, whereas the use of publicly paid formal care is in general negatively associated with wellbeing (Broese van Groenou Reference Broese van Groenou2020; Abbing et al. Reference Abbing, Suanet and Broese van Groenou2022; Swinkels et al. Reference Swinkels, Abbing and Broese van Groenou2025). These studies argue that informal care-givers foster greater emotional closeness than publicly or privately paid care-givers, and therefore have a more positive impact on care recipients’ wellbeing. However, others suggest that a sense of control and mastery over care contributes more strongly to wellbeing, which is more commonly associated with publicly or privately paid care arrangements (Wylie et al. Reference Wylie, Boerner, Miller, Kim and Burr2024). Consistent with this perspective, some studies indicate that care networks combining both formal and informal care-givers are associated with the best wellbeing outcomes for care recipients (Liu et al. Reference Liu, Prvu-Bettger, Sheehan, Huang and Roth2021).
Given the expected differences in the prevalence of care network types (and possibly in levels of wellbeing) over time, the question arises whether this also has an impact on the differences in wellbeing across the care network types. Noted changes are the more limited availability of publicly provided formal care, both due to LTC reforms and due to lockdown-related measures implemented during Covid-19 times. This may make the associations between care networks and psychological wellbeing stronger (Abbing et al. Reference Abbing, Suanet and Broese van Groenou2022). If our theoretical understanding of the association between care network types and wellbeing is robust, however, we would expect no large impact of time, even if the prevalence of care network types and wellbeing changed. Our second research question (RQ2) asks: to what degree do the direct associations between care network types and psychological wellbeing differ between the four time periods?
Method
Sample
The data for this study were taken from the Longitudinal Aging Study Amsterdam (LASA), an ongoing research project that began in 1992 and examines various aspects of ageing, including physical, emotional, cognitive and social functioning among adults aged 55 and older in the Netherlands. The study participants were randomly selected from the population registers of 11 municipalities across three distinct regions in the Netherlands, chosen to reflect diversity in religion and urbanization levels, ensuring that the sample represents the broader Dutch older adult population.
The initial cohort, recruited in 1992–1993, included 3,107 individuals aged 55 to 84 years. In subsequent years, two additional cohorts were introduced: one in 2002 comprising 1,002 respondents (cooperation rate: 62%) and another in 2012 with 1,023 participants (cooperation rate: 63%). For the latter two cohorts participants were aged between 55 and 64. Starting from inclusion of each of the cohorts, data collection occurs every three to four years, with trained interviewers visiting respondents in their homes. For a more comprehensive overview of LASA, please refer to the website and relevant cohort publications (https://lasa-vu.nl/; Huisman et al. Reference Huisman, Poppelaars, van der Horst, Beekman, Brug, Van Tilburg and Deeg2011; Hoogendijk et al. Reference Hoogendijk, Deeg, Poppelaars, van der Horst, Broese van Groenou, Comijs, Pasman, van Schoor, Suanet and Thomése2016, Reference Hoogendijk, Deeg, de Breij, Klokgieters, Kok, Stringa, Timmermans, van Schoor, van Zutphen and van Der Horst2020, Reference Hoogendijk, van Schoor, Qi, Visser, Swinkels, Broese van Groenou, Kok, Holwerda, Pasman, Onwuteaka-Philipsen, Remmelzwaal, Van Ingen, Van Tilburg, Van Haaster, Van der Horst, Poppelaars, Deeg and Huisman2025).
Analytical sample
Participants were selected from the LASA cycles in 1992–1993, 2001–2003, 2011–2013 and 2021–2022 to reflect four distinct timepoints, indicated for short as 1992, 2002, 2012 and 2022 with 9,212 observations from 4,954 respondents. Because only the first cohort included adults up to age 84, we selected individuals aged 65–85 across all cohorts to ensure comparability and to avoid confounding by differences in age composition; this cut-off makes it possible to distinguish genuine temporal changes from shifts that merely reflect differences in the age structure of the samples. For all other variables, missing information was imputed using the closest available wave. The total sample yielded 5,496 observations from 3,999 respondents.
Measurements
To indicate psychological wellbeing, the frequency of depressive symptoms was assessed using the 20-item Center for Epidemiologic Studies Depression Scale (CESD-20; Radloff Reference Radloff1977). Participants rated how often they experienced each symptom, with response options ranging from 0 (‘rarely or never’) to 3 (‘mostly or always’). The total scores could range from 0 to 60.
Care network types were categorized based on participants’ reports of receiving assistance (yes or no) with personal or household care (two separate questions). If any help was received, participants indicated the source, including a partner, informal care-givers (children, relatives, neighbours, friends), publicly funded formal care-givers (district nurses, home help) or privately paid care-givers. Participants were then classified into five distinct groups: (1) ‘No Care’ (no assistance received with these two tasks); (2) ‘Partner Care Network’ (care from a partner, possibly with other informal care-givers, but no formal care); (3) ‘Informal Care Network’ (informal care without a partner or formal care, possibly with privately paid care); (4) ‘Formal Care Network’ (any publicly paid formal care, with or without other care-givers); (5) ‘Privately Paid Care Network Only’ (care exclusively from privately paid care-givers).
Control variables – individual drivers of care
Physical functioning was assessed using participants’ ability to perform seven daily tasks, including using transportation, dressing and bathing. Participants rated their difficulty with these tasks on a scale from 4 (unable) to 0 (no difficulty), generating sum scores that ranged from 6 to 30 for activities of daily living, with higher scores indicating better physical functioning.
Cognitive functioning is measured using the 20-item Mini-Mental State Examination (MMSE;Folstein and Folstein Reference Folstein and Folstein1975), with scores ranging from 0 to 30, where higher scores reflect better cognitive abilities.
The total number of chronic diseases ranged from 0 to 7 and was counted by respondents’ reporting a total of seven diseases (lung disease, cardiac disease, arterial disease, diabetes, CVA/stroke, arthritis and cancer).
Education was based on nominal years it takes to complete a level, which ranged from 5 to 18 (5 ‘elementary not completed’ to 18 ‘university education’).
The sex of the respondent was noted with female coded as ‘1’and male coded as ‘0’.
Age was assessed through subtracting the interview date from the birth date.
Partner status asked whether or not the respondent has a partner living at home (1).
Procedure
Data were analysed using STATA V.17. First, descriptive statistics (mean/SD and N/%, as appropriate) were derived by time period and care network type. Differences between time periods were tested using F-tests (ANOVA), chi-squared (χ2) tests and subsequent post hoc tests (Bonferroni). Because the data were structured longitudinally (with respondents at level 1 nested within time points at level 2), multi-level regression models were employed for all further analyses. Table 2 shows the descriptives for all variables at the four points in time and Table S1 shows the descriptives for all variables at the four points in time for each of the network types.
Description of study variables by year (N = 5,496 observations from N = 3,999 respondents)

Table 2 Long description
Yearly summaries for 1992, 2002, 2012, and 2022 report sample size plus care network type percentages and mean scores with variability for health, demographics, and education. Respondents decreased from 1,963 in 1992 to 1,076 in 2022. The share with no care increased from 44% in 1992 and 45% in 2002 to 65% in 2012 and 70% in 2022. Partner-only care dropped from 17% to 4%, and informal-only care dropped from 11% to 4% over the same period; formal care declined from 16% to 12%, while privately paid care stayed near 11% to 12%. Depressive symptoms decreased overall, from a mean of 8.3 in 1992 and 9.1 in 2002 to 7.3 in 2022. Physical functioning improved from 25.0 to 27.7, and cognitive functioning improved from 26.7 to 28.0, while the average number of chronic diseases rose from 1.1 to 1.4. Mean age was highest in 1992 at 75.2 years and about 73 to 74 years thereafter; the percentage female ranged from 51% to 57%. Education increased steadily from 8.5 to 11.5 years. Letter markers indicate statistically significant differences between specific years based on post-hoc comparisons, so small numeric gaps may not reflect meaningful change.
Notes: Post hoc tests Bonforroni p < 0.05:
A different from 1992,
B different from 2002,
C different from 2012,
D different from 2022.
To answer RQ1, we first assessed the prevalence of care networks across time points (Table 3). To statistically test these differences, multi-level multinomial logistic regression analysis was used with the five care network types as the dependent variable (formal care is the reference category) and dummy variables for time points as the independent variables, with 1992 as the reference category, adjusted for all individual control variables. Subsequently, predicted probabilities were calculated and shown in Figure 1. Next, to answer RQ2 we constructed three multi-level linear regression models with depressive symptoms as the dependent variable. First, a baseline model was established (Table 4, Model 1), including control variables (age, sex, education, partner status, physical functioning, cognitive functioning and chronic diseases) and the independent variable dummies for care networks. All continuous variables (i.e. education, physical functioning, cognitive functioning and chronic diseases) were mean centred prior to inclusion. The second model also included dummy variables for time points, and a third model included the interactions between care networks and time (RQ2, Table 4, Models 2 and 3).
Results
Descriptives for all variables
Table 2 provides the descriptive statistics for all variables at the four time points and shows a higher percentage of individuals receiving no care in more recent years, while lower percentages used partner care and informal care in 2012 and 2022 compared to 1992. Post hoc tests showed no differences across time periods between private care and formal care. Depressive symptoms fluctuated across time periods, with the highest average reported in 2002 (mean = 9.1) and the lowest in 2022 (mean = 7.3). Additionally, physical and cognitive functioning, as well as education levels, were highest in the most recent period. The highest number of chronic diseases was reported in 2012 (mean = 1.5). Finally, the percentage of females was higher in 2002 (57%) compared to 1992 (51%). These descriptives show that the 65–85-year-olds were relatively healthy and higher educated in the most recent sample (2022), with the majority (70%) using no care and reporting on average lower levels of depressive symptoms compared to those receiving care.
Prevalence of care networks across time periods
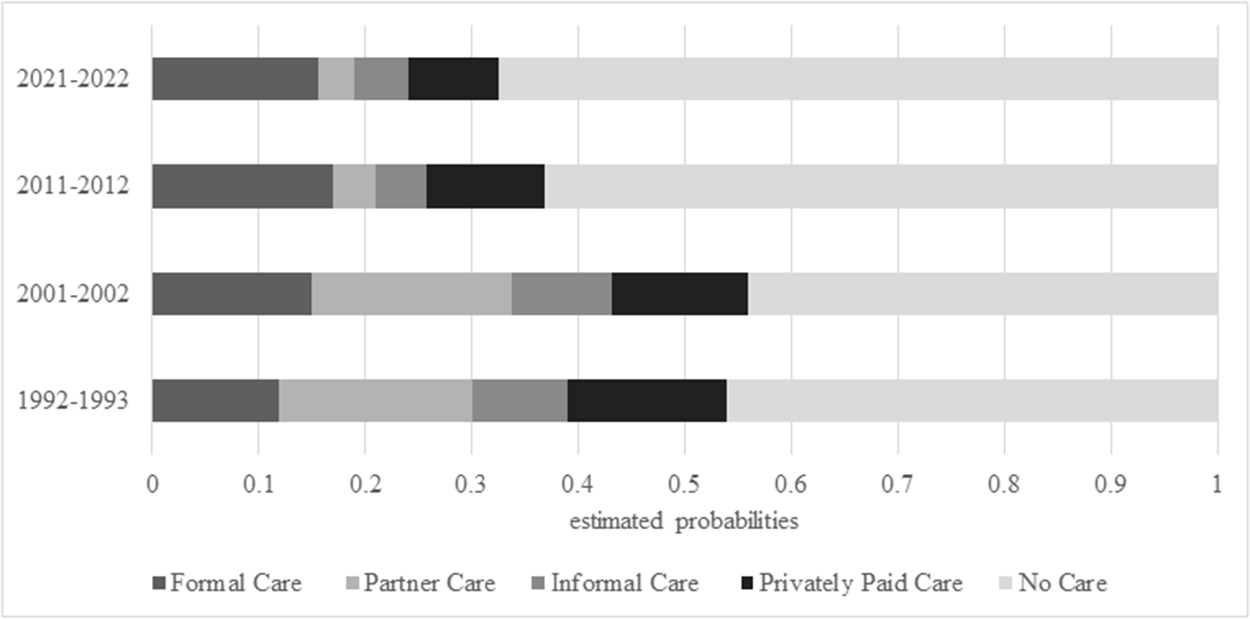
Table 3 shows the results of the multinomial logistic regression analyses of time on care network types as dependent variables. Estimated probabilities are depicted in Figure 1 (RQ1). This illustrates that the likelihood of receiving formal care or no care was higher in more recent time periods, while the likelihood of receiving partner, informal and private care was lower in 2002, 2012 and 2022 compared to 1992.
Multi-level multinominal logistic regression analysis with dummies for care network as dependent and dummies for time period as independent variables

Notes: Standard errors in parentheses.
*** p < 0.001, ** p < 0.01, * p < 0.05.
Reference of dependent variable is the formal care network.
Reference of independent variable is 1992–1993.
Adjusting for age, sex, education, physical functioning, cognitive functioning, chronic diseases.
Estimated probabilities derived from multi-level multinominal logistic regression with care network type (reference: formal care network) as outcome and time period (reference: 1992) as predictor adjusting for age, sex, physical functioning, chronic diseases and cognitive functioning.

Figure 1 Long description
Multinomial logistic regression coefficients compare each care network category with formal care across time periods, controlling for demographics and health factors. Relative to 1992–1993, partner care drops strongly in 2011–2013 and 2021–2022, with coefficients around minus 2.0 and highly significant. Informal care also declines in 2011–2013 and 2021–2022, with coefficients near minus 1.0 and minus 0.79, both highly significant. Private care decreases in every later period, from about minus 0.48 in 2001–2003 to about minus 0.70 and minus 0.86 in 2011–2013 and 2021–2022, all statistically significant. No care shows only modest decreases, significant in 2001–2003 but not in 2011–2013 or 2021–2022. Standard errors are provided for each estimate, and significance markers indicate which changes are unlikely to be due to chance.
Linear mixed model analysis with depressive symptoms as dependent variable and dummies for care network (reference category: formal care network), control variables and two-way interactions between care network and time period (reference category: 1992)

Table 3 Long description
Linear mixed-model results report coefficients and standard errors for depressive symptoms across three models, comparing care-network categories to a formal-care network reference group and later time periods to a 1992 reference. In all models, higher physical functioning and higher cognitive functioning are linked to fewer depressive symptoms, while more chronic diseases are linked to more symptoms. Having a partner and being female are consistently associated with higher depressive symptoms, and higher education is associated with slightly lower symptoms. Relative to formal care, the no-care, partner-care, and informal-care categories show lower depressive symptoms in the main effects; private care is also lower in models 1 and 2 but is not clearly different from formal care in model 3. Time-period indicators added in model 2 suggest higher depressive symptoms in 2001 to 2003, 2011 to 2013, and 2021 to 2022 compared with 1992, with the largest increase in 2001 to 2003. Model 3 adds care-network by time interactions; most are not clearly different from zero, but no-care shows additional decreases in 2011 to 2013 and 2021 to 2022, and private care shows an additional decrease in 2021 to 2022. Interpret results as associations from a mixed model with reference categories; coefficients reflect differences relative to those references and statistical significance varies by term.
Notes: Standard errors in parentheses.
*** p < 0.001, ** p < 0.01, * p < 0.05.
Care networks and depressive symptoms across time periods
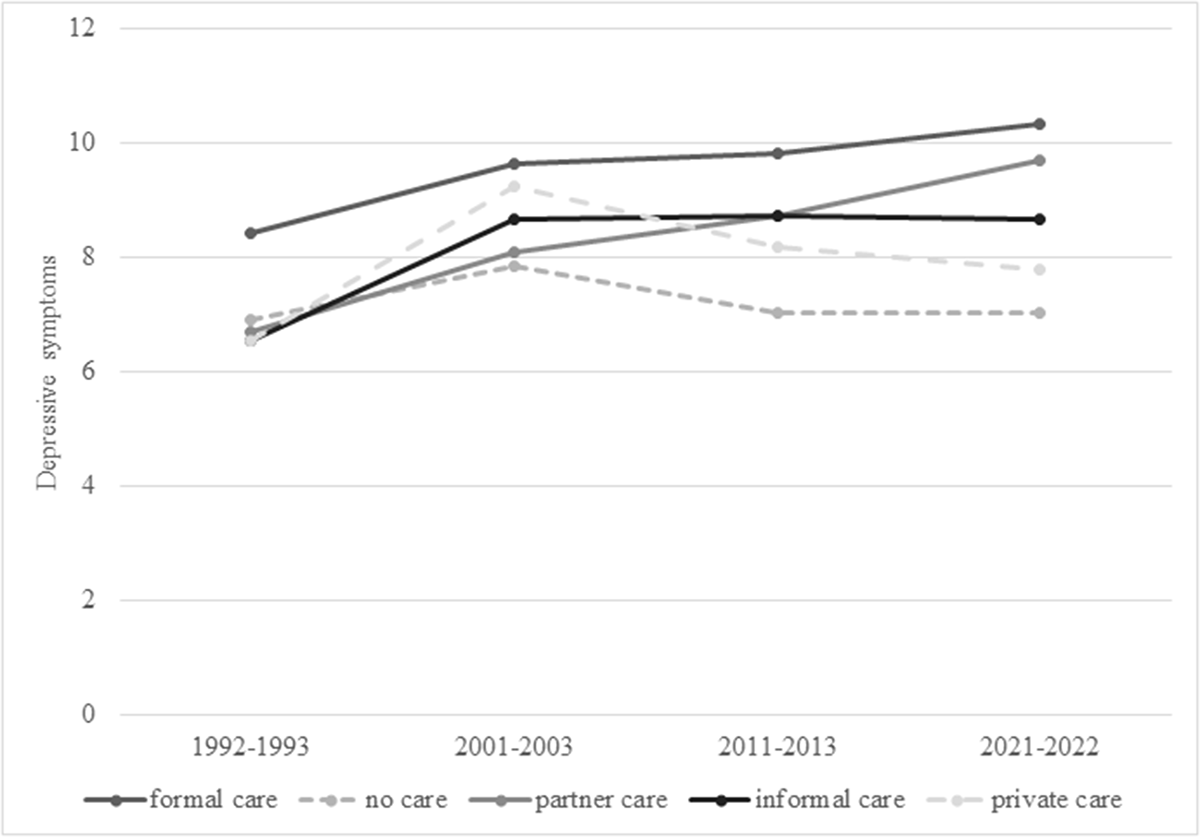
Table 4 presents the associations between care network types and depressive symptoms over time (RQ2). After adjusting for individual drivers of care use, individuals receiving no care consistently reported significantly fewer depressive symptoms compared to those receiving formal care (B = −2.22, SE = 0.32, p < 0.001: Model 1). This pattern is also observed for individuals receiving partner care (B = −1.84, SE = 0.39, p < 0.001), informal care (B = −1.66, SE = 0.40 p < 0.001) and privately paid care (B = −1.19, SE = 0.38, p < 0.01). Model 2 shows that the association between network type and depressive symptoms slightly attenuated after the addition of time period, suggesting a slight explanatory role of time in the association between network and depressive symptoms. Model 3 shows that the interaction terms for time period with partner care, informal care and privately paid care were not significant, implying that differences in depressive symptoms between these care networks and the formal care network remained stable over time. However, the interaction between 2022 and no care was significant: in 2022, the relative negative effect of receiving no care compared to formal care had become larger compared to 1991 (B = −1.78, SE = 0.79, p < 0.05). Figure 2 shows that the widening of this gap is primarily due to formal care users reporting higher levels of depressive symptoms over time, particularly in 2022.
Average depressive symptoms per care network per time period (adjusted for control variables).

Models 1–3 also highlight the influence of several control variables. All associations were in the expected directions: individuals with a partner, poorer cognitive functioning, more chronic conditions and females reported higher levels of depressive symptoms, whereas those with better physical functioning, older age and more years of education reported fewer depressive symptoms. Importantly, all variables remained statistically significant across the models, indicating a robust explanatory contribution.
Discussion
The main aim of the study was to test the prevalence of care networks (i.e. no care, partner care, informal care, mixed publicly provided formal care and privately paid care) and associations between care network types and wellbeing among older adults (aged 65–85) across time periods, covering 30 years of LTC and societal contexts in the Netherlands. While previous studies have investigated the links between care network type and wellbeing (Broese van Groenou Reference Broese van Groenou2020; Swinkels et al. Reference Swinkels, Abbing and Broese van Groenou2025) and changes in this link over time (Abbing et al. Reference Abbing, Suanet and Broese van Groenou2022), this study is the first to cover a period of three decades incorporating time points as recent as 2022. There are three key conclusions: (1) from 2012 onward, there was a (slight) increase in the use of formal care and no care, but a decline in the use of partner care, informal care and privately paid care; (2) formal care users reported the highest number of depressive symptoms in all time periods; and (3) only the gap in depressive symptoms between formal care and no care users widened significantly in the most recent 2022 period.
The four time periods are chosen to represent shifts in LTC policies, which became increasingly restrictive in terms of access to residential care and reductions of home-care budgets over time (see Table 1). The last time period also includes the Covid-19 pandemic during which the availability of all forms of care, but particularly formal care, was even more constrained. Notable changes in care use were particularly evident from 2012 onwards, coinciding with the introduction of new legislation, such as the WMO (Social Support Act) in 2007 and the WLZ (Long-Term Care Act) in 2015. These laws imposed higher thresholds for accessing residential care and emphasized the use of home care organized by the local government and care practitioners. Our results showed a slight increase in formal care use and a decline in informal and privately paid care after 2012, alongside a steady rise in individuals receiving no care. This indicates an overall decrease in care usage, with better health and potentially a preference for accessible formal care over informal support from family, friends or neighbours. These trends suggest that heightened barriers to residential care access and decentralization policies since 2012 may have increased reliance on publicly provided formal home care while failing to mobilize informal care networks. Yet, this may also coincide with the tendency of care recipients to lower the dependence on their families and prefer using formal care if available (Wylie et al. Reference Wylie, Boerner, Miller, Kim and Burr2024). In addition, the drop in partner- and other informal care use might reflect demographic trends in the availability of informal care users such as greater proportion of older adults in society, smaller families, higher average retirement age and higher labour force participation of women (Broese van Groenou and De Boer Reference Broese van Groenou and De Boer2016). Moreover, the heightened use of informal care that was expected based on the absence of availability of formal care did not appear within our data. It is possible that, even despite limited availability of formal care, recipients were more inclined to seek solutions independently of care-givers and temporarily rather than burdening their family members and friends who may have been in precarious positions themselves.
The increased use of ‘no care’ after 2012 (up to 70% in 2022) may not solely indicate shortage in the availability of LTC. An alternative explanation could be the growing impact of information and communication technologies (ICT), which may enable older adults to live more independently and self-care than they could 10 or 20 years ago. Research has shown that ICTs can enhance older adults’ independence and wellbeing (Baraković et al. Reference Baraković, Baraković Husić, Van Hoof, Krejcar, Maresova, Akhtar and Melero2020). In addition, older adults use ICTs when help from other informal sources is not available or desired (Lin Reference Lin2024). Thus, the rise in individuals not receiving care might partly result from increased ICT-enabled independence, such as with the use of online grocery delivery services, telehealth consultations or digital platforms that allow older adults to manage appointments and medications on their own. Our models, adjusted for physical and cognitive functioning, support this possibility. Another consideration is the study design and sample characteristics. The study included adults aged 65–85 living at home in each of the four time periods. By setting the upper age limit at 85, the study excluded the ‘oldest old’, who more often use care (McGrail et al. Reference McGrail, Green, Barer, Evans, Hertzman and Normand2000). This raises the question of whether changes in the number of people receiving no care reflect enhanced independence or sample characteristics, which needs to be addressed in future research assessing cohort differences in care use and unmet needs resulting from educational expansion and ICT use among older generations.
A robust finding was that use of the formal care network was associated with the highest level of depressive symptoms, while receiving no care is linked to the lowest level. Moreover, the disparity between those receiving no care and formal care increased from 2012 onward, as formal care users reported higher levels of depressive symptoms over time. This trend suggests that the experience of formal care use has become more negative over time. One potential explanation may be the cost-containing strategies explained in Table 1, some of the consequences of which include the shortages of personnel, the increased work pressure and the diminished job security of formal health-care workers that ensued after policy changes in 2012 (Da Roit Reference Da Roit, Ranci and Pavolini2012; Janssen et al. Reference Janssen, Jongen and Schröder-Bäck2016; Kromhout et al. Reference Kromhout, Klerk and Kornalijnslijper2018). The marketization of LTC has also been linked to worsening working conditions in home care (Schwiter et al. Reference Schwiter, Berndt and Truong2018). These developments, in turn, may have negatively impacted care recipients by increasing care-giver stress and reducing the quality of care provided. In addition, Figure 2 shows the growing diversity in depressive symptoms of the care network types in 2022 compared to 1992. Although it did not reach statistical significance, partner care use in 2022 neared the level of depressive symptoms of formal care users, and this was clearly not the case in 1992. This suggests that receiving care, albeit formal or informal care, is evaluated more negatively in recent times, for possibly multiple reasons (Asadi-Lari et al. Reference Asadi-Lari, Packham and Gray2003; Dostalova et al. Reference Dostalova, Bártová, Blahova and Holmerova2021). One possibility is that needing care, when it results in a loss of independence, has become especially difficult in today’s increasingly individualistic society, where ideals of autonomy are deeply ingrained. As a result, being dependent on a partner or spouse, and feeling like a burden to them, may be experienced more negatively now than a decade ago. Another possibility includes the role of the restrictions during the Covid-19 pandemic, which are argued to particularly impact formal care while informal care was considered more resilient (Tur-Sinai et al. Reference Tur-Sinai, Bentur, Fabbietti and Lamura2021). A big question here is whether this trend regarding the lowered wellbeing among those who receive formal care will continue over time beyond the Covid-19 pandemic.
This study has many strengths, including a time span of over 30 years which allowed conclusions based on advanced multi-level analysis and statistical power for interactions which are needed to test our models. An important limitation is that we are not able to exactly pinpoint which changes in LTC policies over the years contributed to our findings. Studies including macro-level information and connecting this to micro-level outcomes are needed but still limited (Verbakel et al. Reference Verbakel, Glaser, Amzour, Brandt and Broese Van Groenou2023). Using only four points in time also limited our understanding about which elements in the four time periods differed. Yet, using these four time points also revealed that the largest developments in care use and wellbeing appeared after 2012, showing the impact of the new laws and decentralization starting in 2007. In addition, socio-historical developments are difficult to detect as they are more gradual and take place over longer periods of time. Lastly, it is important to note that this study focused solely on the presence of specific types of care-giver within the care network and did not account for care intensity or the stability of care arrangements. Previous research examining single time points suggests that intensive care-giving, rather than moderate care-giving, as well as unstable informal care arrangements are associated with poorer mental health outcomes (Li et al. Reference Li, Angrisani and Lee2023; Li et al. Reference Li, Vedel and Quesnel-Vallée2024). Future research could build on these findings by explicitly examining how changes in care intensity and stability unfold over time, and how these temporal dynamics shape care-giver and care recipient wellbeing across different life stages and care contexts.
Despite an increase in overall health status and the explicit stimulus for informal care-givers and growing options to purchase care on the market, these formal and informal forms of care were used less often. Where the LTC reforms aimed to shift our welfare state from a universal to a more familial or market-steered regime, this is not clear yet from our findings. As said, our sample population may yet not show a need for care that is really pressing the LTC system to its limits. More research is needed on those aged 85+ and in follow-ups that LASA collects from 2024 onward, to examine whether the probabilities of using formal and informal care may change in the near future.
To conclude, our study showed important changes in the past decade compared to the early nineties: the use of formal care is increasingly negatively related to wellbeing, even when health and other predictors of wellbeing are taken into account. This may also suggest that individuals who require formal home care are particularly vulnerable to depressive feelings, highlighting the importance of paying closer attention to this form of care. At the same time, it should be recognized that reliance on care from relatives can place a substantial burden on informal care-givers and negatively affect their wellbeing. Overall, the results underscore the need for greater insight into how the provision of formal care can be improved in a way that supports both care recipients and their care-givers.
Supplementary material
The supplementary material for this article can be found at https://doi.org/10.1017/S0144686X26100956.
Acknowledgements
LASA data collections have been approved by the Medical Ethical Committee of the VU University Medical Center, number 2012.361.
Author contributions
SK performed all statistical analyses and revised the article; MB wrote and planned the study and revised the article; JS prepared data, supervised the data analysis and revised the article; and JA supervised the data analysis and contributed to revising the article.
Financial support
The Longitudinal Aging Study Amsterdam is supported by a grant from the Netherlands Ministry of Health, Welfare and Sport, Directorate of Long-Term Care. The data collection in 2012–2013 was financially supported by the Netherlands Organization for Scientific Research (NWO) in the framework of the project ‘New Cohorts of Young Old in the Twenty First Century’ (grant number 480-10-014). The study is overall supported by a grant from the Netherlands Organization for Scientific Research (NWO) for the project ‘FAMCARE: The Changing Role of Families in Care Networks and Wellbeing of Older Adults in the Netherlands’ (grant number 406.21.SW.027).
Competing interests
No potential conflict of interest was reported by the authors.
Ethical standards
The LASA study is conducted in line with the Declaration of Helsinki and was approved by the Medical Ethics Committee of the VU University Medical Center. For the purpose of replication, data supporting the findings of this study are available upon request at https://lasa-vu.nl/en/request-data/.




 Open access

