I. INTRODUCTION
Controllable synthesis of micro/nanocrystals has sparked considerable interest driven primarily by the fact that the shape and size of micro/nanocrystals have tremendous effects on their properties.Reference Wang, Zhuang, Peng and Li1–Reference Shang, Wang and Xu3 Among the micro/nanocrystals reported, hierarchical architectures, as a series of structures composed of low-dimensional nanostructured building blocks, have been extensively investigated for their novel properties and potential applications in many fields.Reference Zheng, You, Liu, Song, Jia, Huang, Yang, Zhang and Ning4, Reference Tian, Chen, Zhou, Pan, Dong, Tian and Fu5
Semiconductor photocatalysis has received increasing attention since the discovery of water splitting on a TiO2 electrode.Reference Fujishina and Honda6–Reference Akhavan and Ghaderi9 Among many candidates for photocatalysts, Bi2MoO6 has attracted a great deal of attention for its good photocatalytic performance.Reference Yin, Wang and Sun10–Reference Bi, Wu, Li, Li, Wang and Fu13 In this process, only the light whose energy matches or exceeds the band gap energy of the semiconductor can excite the photocatalyst to generate electron–hole pairs, which oxidizes toxic organic pollutants and/or reduces toxic metal ions. And thus, the low usage of sunlight has restrained the photocatalytic efficiency of photocatalysts in the environmental remediation.
The upconversion (UC) of RE ions, which can emit higher-energy photons when excited by lower-energy photons, brought a new opportunity for the utilization of long-wave length sunlight. Among all the trivalent lanthanide ions, Er3+ has attracted considerable attention due to the richest spectrum in the infrared–ultraviolet (UV) range that makes it ideally suited for energy UC studies.Reference Wang, Peng and Li14–Reference Wang and Liu17
Herein, enhanced photocatalytic activity was successfully achieved in Bi2MoO6 by tridoping with Er3+ ions. We suggest that the enhancement of photocatalytic activity of Bi2MoO6:Er3+(0.5%) is related to the UC luminescence of Er3+ ions. In addition, the UC luminescence properties of Bi2MoO6:Er3+ microspheres were studied in detail.
II. EXPERIMENTAL
In a typical synthesis, 2 mmol of Bi(NO3)3·5H2O and 1 mmol of Na2MoO4·2H2O were separately dissolved in 5 mL of ethylene glycol. After vigorous stirring and bath ultrasonication for 30 min, the two solutions were mixed together, then 20 mL ethanol was slowly added into the above solution, followed by stirring for 10 min. Subsequently, the resulting clear solution was transferred to a 50-mL Teflon-lined autoclave, and heated at 160 °C for 20 h. The systems were then allowed to cool to room temperature. The final products were collected by means of centrifugation, washed with distilled water and ethanol, and dried at 80 °C in air. The as-prepared Bi2MoO6 was then annealed in air at 200–500 °C for 3 h. Bi2MoO6:Er3+ were prepared by the same procedure, except for adding additional Er(NO3)3 into the solution of Bi(NO3)3 at the initial stage.
The crystal structure was analyzed by a Rigaku RU-200b x-ray powder diffractometer (Tokyo, Japan) using a nickel-filtered Cu Ka radiation (λ = 1.5418Å). The size and morphology of the final products were investigated by scanning electron microscope (SEM; Hitachi, S-4800, Tokyo, Japan). UC luminescence spectra were recorded using a Hitachi F-4500 fluorescence spectrophotometer (Tokyo, Japan) with an adjustable laser (980 nm) as the excitation source with a fiber optic accessory. All the experiments were performed at room temperature. Nitrogen adsorption–desorption isotherms were collected using an Autosorb-1 (Quantachrome Instruments, Boynton Beach, FL) nitrogen adsorption apparatus at 77 K. The pore size distribution plots were obtained by the Barret–Joyner–Halenda (BJH) model.
The photodegradation experiments were performed in a glass reactor containing 50 mL of a 5 mg/L solution of rhodamine B (RhB) and 0.05 g of catalyst. A 150-W Xenon lamp was used as a simulated solar light source, and a 420 nm cutoff filter was placed above the reactor to cutoff UV light. Prior to irradiation, the suspension was kept in the dark under stirring for 30 min to ensure the establishing of an adsorption/desorption equilibrium. At given time intervals, 4 mL aliquots were collected from the suspension and immediately centrifuged, the concentration of RhB after illumination was determined at 553 nm using a UV–vis spectrophotometer (Shimadzu UV-2550, Kyoto, Japan).
III. RESULTS AND DISCUSSION
A. Crystal structure and morphology
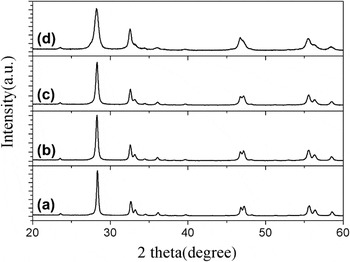
The crystal structure and particle size of products were obtained by x-ray diffraction (XRD) patterns. Figure 1(a) shows the XRD pattern of Bi2MoO6 prepared at 160 °C for 20 h before annealing. The patterns are in agreement with the orthorhombic Bi2MoO6 (JCPDS 76-2388). No other impurity peaks were detected. Figures 1(b)–1(e) show the XRD patterns of Bi2MoO6 prepared at 160 °C for 20 h after annealing at 200, 300, 400, and 500 °C, respectively. From the bottom to the top in Fig. 1, the XRD patterns become narrower gradually, suggesting that the crystalline size increased with increasing annealing temperature. It is noted that when the annealing temperature is raised to 500 °C, impurity peaks were detected. Figure 2 shows the XRD pattern of Bi2MoO6:Er3+ with different Er3+ concentrations after annealing at 400 °C. It was found that the XRD patterns of samples become broader with increasing Er3+ concentration, suggesting that the crystalline size gradually decreases.
X-ray diffraction (XRD) patterns of (a) Bi2MoO6 before annealing and (b–e) Bi2MoO6 after annealing at 200, 300, 400, and 500 °C, respectively.

XRD patterns of (a) Bi2MoO6, (b) Bi2MoO6:Er3+(0.25%), (c) Bi2MoO6:Er3+(0.5%), and (d) Bi2MoO6:Er3+(1.5%) after annealing at 400 °C.

Figure 3(a) shows the SEM images of pure Bi2MoO6 prepared at 160 °C for 20 h before annealing, which are flowerlike microspheres with a mean length of ∼2 μm. Each flowerlike hierarchical microsphere consists of many nanoplates. Figures 3(b)–3(e) show the SEM images of Bi2MoO6 after annealing at 200, 300, 400, and 500 °C, respectively. It is observed that the hierarchical spheres cannot be destroyed after annealing at 200, 300, and 400 °C. However, when the annealing temperature is 500 °C, the nanoplates grew into larger particles, as shown in Fig. 3(e). Figures 3(f) and 3(g) show the SEM images of Bi2MoO6:Er3+(0.5%) before annealing and after annealing at 400 °C. Figures 3(h) and 3(i) show the SEM image of Bi2MoO6:Er3+(1.5%) before annealing and after annealing at 400 °C. Obviously, the incorporation of Er3+ has no evident influence on the morphology of Bi2MoO6.
Scanning electron microscope images of samples: (a–e) Bi2MoO6 before annealing and after annealing at 200, 300, 400, and 500 °C; (f, g) Bi2MoO6:Er3+(0.5%) before annealing and after annealing at 400 °C; (h, i) Bi2MoO6:Er3+(1.5%) before annealing and after annealing at 400 °C.

B. Photocatalytic activity of Bi2MoO6 and Bi2MoO6:Er3+
The photocatalytic activity of the as-synthesized Bi2MoO6 and Bi2MoO6:Er3+ was evaluated by the degradation of RhB aqueous solution under simulated solar light from a 150-W Xenon lamp (a 420-nm cutoff filter was placed above the reactor to cutoff UV light). Figure 4 shows the degradation rate of RhB by Bi2MoO6 prepared at 160 °C for 20 h before annealing and after annealing at 300, 400, and 500 °C, respectively. C x was the absorption of RhB at the wave length of 553 nm, and C 0 was the absorption of RhB after the adsorption equilibrium on catalyst before irradiation. The results indicated that after 100 min irradiation, the photodegradation efficiencies of RhB reached 24.8, 73.5, 90.4, and 30.8% for Bi2MoO6 before annealing and after annealing at 300, 400, and 500 °C, respectively. Obviously, the best photocatalytic performance was observed when the annealing temperature was 400 °C.
The degradation rates of rhodamine B (RhB) by Bi2MoO6 before annealing and after annealing at 300, 400, and 500 °C under simulated solar light irradiation (λ > 400 nm).

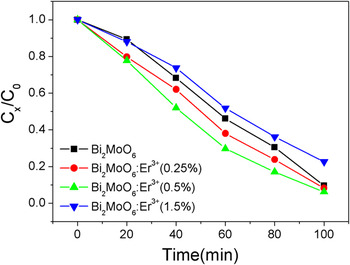
Figure 5 shows the degradation rates of RhB by Bi2MoO6:Er3+ with different Er3+ concentrations after annealing at 400 °C. For comparison, the degradation rate of RhB by Bi2MoO6 is also shown in Fig. 5. After 100 min irradiation, the photodegradation efficiencies of RhB reached 91.8, 93.8, and 77.4% for Bi2MoO6:Er3+(0.25%), Bi2MoO6:Er3+(0.5%), and Bi2MoO6:Er3+(1.5%), respectively. Obviously, the best photocatalytic performance was observed when the Er3+ concentration was 0.5%.
The degradation rates of RhB by Bi2MoO6:Er3+ with different Er3+ concentrations under simulated solar light irradiation (λ > 400 nm).

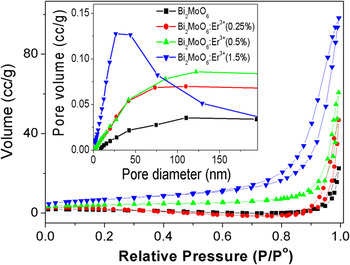
We suggest that two possible mechanisms might be responsible for the enhancement of photocatalytic activity of Bi2MoO6:Er3+. First, the photocatalytic degradation activity is related to the RhB adsorbance. N2 adsorption–desorption isotherms and the corresponding BJH pore size distribution plots of the as-obtained Bi2MoO6:Er3+ with different Er3+ concentrations were performed to determine the surface area of the samples, as shown in Fig. 6. The BET surface areas for the prepared Bi2MoO6, Bi2MoO6:Er3+(0.25%), Bi2MoO6:Er3+(0.5%), and Bi2MoO6:Er3+(1.5%) are 5.3587, 6.9420, 14.2824, and 24.3204 m2/g, respectively. Obviously, the BET surface areas increased with increasing Er3+ concentration, which is benefit for RhB adsorption. The larger BET surface area can be attributed to the incorporation of Er3+ ions in the lattice, which will be discussed in a separated article. Second, the enhancement of photocatalytic activity of Bi2MoO6:Er3+ is related to the visible-to-ultraviolet UC of Er3+ ions.Reference Wang, Ma, Zhang, Zhang, Zhang, Jiang, Zhao and Zhang18 According to previous reports, the emission bands around 318.7 and 320.1 nm could be observed in Er3+-doped compounds under the pumping of 486.5 and 542.4 nm (or 548.8 nm), respectively.Reference Zu, Yang and Dai19, Reference Xu and Jiang20 In addition, the emissions in the regions of 326–342 and 354–359 nm were also detected by 652.2 nm (or 657.8 nm) pumping.Reference Yang, Dai and Sun21 Here, the visible light may be converted to UV light, which can effectually activate the Bi2MoO6. And thus, Bi2MoO6:Er3+ presents higher photocatalytic degradation activity. It is imperative to point out that when the Er3+ concentration reached 1.5 mol%, the photocatalytic activity decreased remarkably (Fig. 5), which was even poorer than that of the pure Bi2MoO6. We suggest that the decrease of the photocatalytic activity of Bi2MoO6:Er3+(1.5%) was mainly caused by the quenching of UC luminescence. In addition, at higher Er3+ concentration, the distances between two Er3+ ions are shortening, thus leading to formation of Er3+ clusters, which acted as electron–hole recombination centers, resulting in poor photocatalytic activity.Reference Zhang, Wang, Yin, Shang, Wang and Sun22
N2 adsorption–desorption isotherm curves and pore size distribution (inset) of Bi2MoO6:Er3+ with different Er3+ concentrations.

C. UC luminescence properties of Bi2MoO6:Er3+
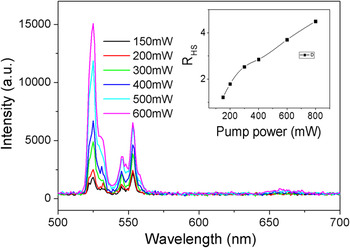
To prove the effect of UC luminescence of Er3+ ions on the photocatalytic activity of Bi2MoO6:Er3+, the UC luminescence properties of Bi2MoO6:Er3+ was studied under 980-nm excitation. Figure 7 shows the UC luminescence spectra of the as-prepared Bi2MoO6:Er3+(0.5%) after annealing at 400 °C under different excitation powers. It was found that the green emissions (2H11/2/4S3/2 → 4I15/2) were observed, and the red emission (4F9/2 → 4I15/2) almost disappeared. The intensity ratio of 2H11/2 → 4I15/2 to 4S3/2 → 4I15/2 increased with increasing excitation power, as shown in the inset of Fig. 6.
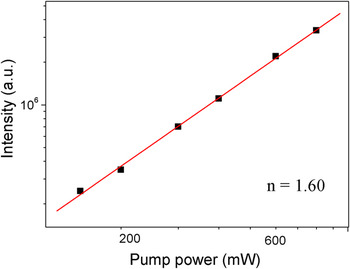
For an unsaturated UC process, the emission intensity is proportional to the n-th power of the excitation intensity, and the integer n is the number of the laser photons absorbed per upconverted photon emitted.Reference Pollnau, Gamelin and Lüthi23 To investigate the fundamental UC mechanism of Bi2MoO6:Er3+(0.5%), the pumping power dependence of the fluorescent intensity was investigated, as shown in Fig. 8. The value of n for the green emission bands was determined to be 1.60, indicating that a two-photon process might be involved in populating the 2H11/2/4S3/2 levels. This is in agreement with the discussion above. Two 980-nm infrared photons may elevate an electron from the ground level up to the 4F7/2 level. Subsequently, the nonradiative relaxations of 4F7/2 → 2H11/2/4S3/2 populate the 2H11/2/4S3/2 levels.Reference Bai, Song, Pan, Lei, Wang, Ren, Lu, Dong, Dai and Fan24, Reference Wang, Qin, Zhang, Zhang, Wang, Cao, Wang, Wei, Zhu and Kim25
Upconversion luminescence spectra of Bi2MoO6:Er3+(0.5%) under different excitation powers. Inset: the intensity ratio of 2H11/2 → 4I15/2 to 4S3/2 → 4I15/2 as a function of excitation power in Bi2MoO6:Er3+(0.5%).

Plot (log−log) of green emission intensity versus excitation power.

IV. CONCLUSION
Flowerlike hierarchical Bi2MoO6 and Bi2MoO6:Er3+ microspheres were synthesized by a hydrothermal method. The BET surface areas increased with increasing Er3+ concentration. The photodegradation of RhB was used to evaluate the photocatalytic activities of Bi2MoO6 and Bi2MoO6:Er3+ under simulated solar light irradiation (λ > 400 nm). The photodegradation efficiencies of RhB increased with increasing Er3+ concentration, up to about 0.5 mol%, and then decreased abruptly. In addition to the aforementioned high photocatalytic activity, the Bi2MoO6:Er3+ microspheres can emit pure green UC luminescence (2H11/2/4S3/2 → 4I15/2) under 980-nm excitation. We suggest that the enhancement of photocatalytic activity of Bi2MoO6:Er3+(0.5%) is related to the larger RhB adsorbance together with the UC luminescence of Er3+ ions.
ACKNOWLEDGMENTS
This work was supported by the National Natural Science Foundation of China (10979032, 21001042, 21171052, 20872030, and 21101060), the Program for New Century Excellent Talents in University (NCET-11-0959), the Special Financial Grant from China Postdoctoral Science Foundation (No.201104456), the Postdoctoral Science Foundation of Heilongjiang Province, and the Youth Foundation for Distinguished Young Scholars of Heilongjiang University.