Introduction
GaN and its related ternaries, AlGaN and InGaN, are being widely developed for blue/uv optical emitters and detectors, and high-temperature/high-power electronics [Reference Mohammand, Salvador and Morkoç1]. For both optical and electronic devices, deep centers, which could act as traps and/or recombination centers, are very important, and must be understood. A number of deep centers in n-GaN, measured by deeplevel transient spectroscopy (DLTS), with activation energies in the range of 0.25-0.87 eV and trap densities in the range of 1013−1015 cm−3, have been reported [Reference Hacke, Detchprohm, Hiramatsu, Sawaki, Tadatomo and Miyake2-Reference Wang, Yu, Lau, Yu, Kim, Botchkarev and Morkoç5]. Most of these studies have dealt with n-type GaN grown by either metalorganic chemical-vapor deposition (MOCVD) or hydride vapor-phase epitaxy (HVPE). In a recent DLTS study of deep centers in Si-doped n-GaN grown by reactive molecular beam epitaxy (RMBE), we reported the observation of a trap E1 (0.21 eV) in a particular group of samples (set I), and a dominant trap C1 (0.44 eV) in another group (set II); both centers are peculiar to the RMBE-grown GaN material [Reference Fang, Look, Kim, Fan, Botchkarev and Morkoç6]. In this paper, we present more details on the characteristics of the centers found in samples in set II, i.e., the strong electric-field effect and the unusual capture kinetics of C1 and the relationship between the observation of E1 and the ammonia flow rate (AFR) during RMBE growth. The associations of C1 with dislocations and E1 with nitrogen vacancies will be discussed.
Samples and Experiments
Four, ∼0.5-μm-thick Si-doped n-GaN samples from set II were used in the present study. The samples were grown at 800 °C on sapphire by RMBE, employing AFRs of 20, 60 and 73 sccm and keeping the Si flux constant. Schottky barrier diodes (SBDs) were prepared from these materials (for the details see [Reference Fang, Look, Kim, Fan, Botchkarev and Morkoç6]). A Bio-Rad DL4600 system with a 100-mV test signal at 1 MHz was used to take capacitance-voltage (C-V) and DLTS data. In order to observe the deepest possible centers within a restricted temperature range (up to 400 K), the smallest rate window (0.8 s−1) in our DLTS system was used. To determine the parameters of the deep-centers, i.e. the activation energy ET and capture cross section σT, the DLTS spectra were taken at different rate windows, from 0.8 to 200 s−1. To study the unusual capture kinetics of C1, DLTS spectra were measured, at a fixed bias (−2.0 V) and a fixed filling pulse height (+0.5 V), by varying the filling pulse width from 0.2 up to 100 ms.
Results and Discussion
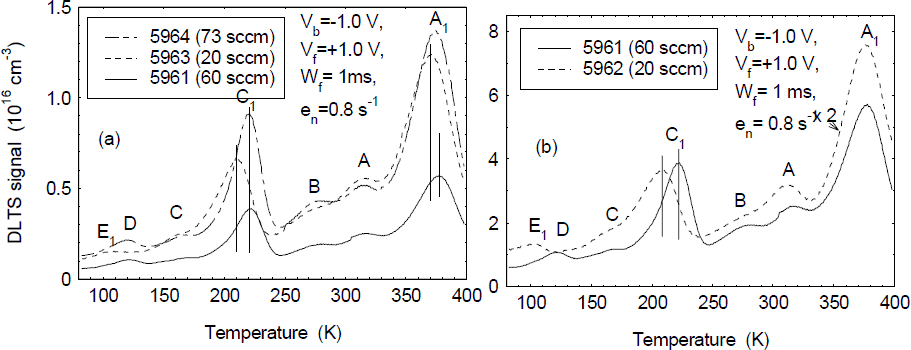
The profiles of the electron concentrations for four SBD samples, obtained from 300-K C-V measurements, are basically flat as shown in figure 1. (The earlier rise observed in the concentration of sample 5964 is evidently due to a smaller n-GaN thickness above the n+-GaN layer). An interesting observation is that the electron concentration in the n-GaN layers seems to depend on the AFR; i.e., the lower AFRs for samples 5962 and 5963 result in higher electron concentrations, as compared to those for samples 5961 and 5964. The DLTS spectra for three samples, 5963, 5961, and 5964, with n-GaN layers grown by using AFRs of 20, 60, and 73 sccm, respectively, are shown in figure 2a, and a DLTS spectral comparison for samples 5962 (20 sccm) and 5961 (60 sccm) is shown in figure 2b. From the DLTS spectra of the figures, we can observe seven deep centers, labeled as A1, A, B, C1, C, D, and E1. A1, with concentrations of mid-1015 to low-1016 cm−3, is a dominant center in RMBE-GaN layers, while C1,with concentrations in the 1015-cm−3 range, is also a prominent center in the layers. Two interesting observations are: 1) the peak positions of A1 and, especially, C1 are found to be sample-dependent: i.e. their peak positions shift to lower temperatures as the electron concentrations in the samples increase; and 2) D, with concentrations in the 1014-cm−3 range, is clearly observed in samples 5961 and 5964, grown using higher AFRs, while E1, with concentrations also in the 1014-cm−3 range, is only observed in samples 5962 and 5963, grown using lower AFRs (see figure 2b for a detailed comparison). The Arrhenius plots of T2/en for all the deep centers are presented in figure 3. To understand the possible defect nature of E1, the Arrhenius plot for the electron-irradiation (EI) induced trap E in n-GaN grown by MOCVD [Reference Fang, Hemsky, Look, Mack, Molnar and Via7] is also presented in the figure. A1, with an average ET=0.89 eV and σT=3 ×10⁻¹⁴cm2, has an energy close to that of DLN4 (0.86 to 0.91 eV) [Reference Gotz, Walker, Romano, Johnson and Molnar4] and E4 (0.88 eV) [Reference Hacke, Okushi, Kuroda, Detchprohm, Hiramatsu and Sawaki8], while A, with ET=0.67 eV and σT=1 ×10⁻¹⁵ cm2, can be compared with E3 (0.665 eV) [Reference Hacke, Detchprohm, Hiramatsu, Sawaki, Tadatomo and Miyake2] and D3 (0.67 eV) [Reference Haase, Schmid, Kurner, Dornen, Harle, Scholz, Burkard and Schweizer3]. B, with ET=0.62 eV and σT=1.2 × 10⁻¹⁴ cm2, has an energy close to that of E2 (0.58 eV) [Reference Hacke, Detchprohm, Hiramatsu, Sawaki, Tadatomo and Miyake2], D2 (0.60 eV) [Reference Haase, Schmid, Kurner, Dornen, Harle, Scholz, Burkard and Schweizer3], and DLN3 (0.59 to 0.63 eV) [Reference Gotz, Walker, Romano, Johnson and Molnar4]. C, with ET=0.41 eV and σT=2.8 × 10⁻¹⁴ cm2, has similarities to the center reported by us in n-GaN grown by both MOCVD and HVPE [Reference Fang, Hemsky, Look, Mack, Molnar and Via7]. D, with ET=0.25 eV and σT=2.6 × 10⁻¹⁵ cm2, is reminiscent of E1 (0.26 eV) [Reference Hacke, Detchprohm, Hiramatsu, Sawaki, Tadatomo and Miyake2] and DLN1 (0.23 to 0.25 eV) [Reference Gotz, Walker, Romano, Johnson and Molnar4]. Thus, we can state that these five deep centers can be observed in n-GaN grown by various techniques. However, the concentrations of the centers can be very different, depending on the growth technique. For example, the concentrations of A1 (or E4, DLN4) can be very minor (below 1013 cm−3) in MOCVD-GaN [Reference Hacke, Okushi, Kuroda, Detchprohm, Hiramatsu and Sawaki8], in contrast to the high concentrations (above 1016 cm−3) observed here in RMBE-GaN. On the other hand, C1 and E1 are specific to the n-GaN layers grown by RMBE. C1 has a low-field ET of 0.43 to 0.48 eV and a σT of 3 × 10⁻¹⁵ to 6.4 × 10⁻¹⁵ cm2, while E1 has an ET of 0.25 eV and a σT of 4.3 × 10⁻¹³ cm2, which are close to the values in the EI induced center E in MOCVD-GaN, with ET=0.18 eV and σT=2.5 × 10⁻¹⁵ cm2 [Reference Fang, Hemsky, Look, Mack, Molnar and Via7].
Profiles of electron concentrations for four SBD samples (note the dependence of the electron concentration on AFR).

(a) DLTS spectra for three samples, with n-GaN grown using different AFRs, and (b) a DLTS spectral comparison for two samples with different AFRs.

Arrhenius plots of T2/en for all seven deep centers; also presented is the plot of EI induced trap E in n-GaN grown by MOCVD.

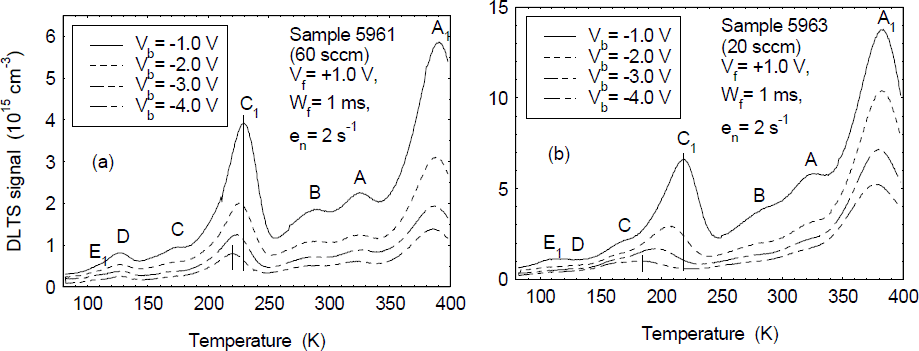
C1 is a very peculiar trap. First, its DLTS peak position is found to be changed not only in different samples, but also in the same sample if Vb is varied. Typical DLTS spectra measured at different Vb’s (keeping Vf fixed at +1.0 V) are shown in figure 4a and figure 4b for samples 5961 (60 sccm) and 5963 (20 sccm), respectively. From the figures, we find that: 1) C1 is the only peak shifted to lower temperatures as Vb increases and the total peak shift is found to be more significant in sample 5963 (shift of ∼35 K) than in sample 5961 (shift of ∼10 K); and 2) the overall DLTS peak height of C1 drops as Vb increases, especially in sample 5963. Such a large DLTS peak shift as a function of Vb implies a very strong electric-field effect on the electron emission from trap C1. Detailed DLTS measurements on sample 5962 (20 sccm), with a total peak shift of ∼30 K, indicate that the apparent ET and σT values are changed from 0.44 eV and 3.0 × 10⁻¹⁵ cm2 to 0.31 eV and 6.4 × 10⁻¹⁷ cm2, respectively, as Vb is increased from −1.0 to −4.0 V. Since the peak shift is most likely related to the barrier lowering effect due to a high electric-field, the different shifts found in samples 5961 and 5963 can be interpreted in terms of the different carrier concentrations in the samples (4 × 1016 cm−3 vs 1.2 × 1017 cm−3), which result in different electric-fields in the depletion regions. The DLTS peak height drop in C1 and the other DLTS peaks may be related to carrier tunneling or hopping through deep centers at high electric-field. For centers in the highest field region, this process could lead to a high emission rate, which would not be seen by the DLTS sampling mechanism. We checked the reverse I-V characteristics of the SBD samples used in the study and found a strong electric-field dependence of the reverse leakage currents (so-called soft breakdown characteristic), which is typical for p-n junctions made on GaN-based materials grown on sapphire and believed to be caused by carrier tunneling or hopping through the defect states associated with the omnipresent threading dislocations in the materials [Reference Kuksenkov, Temkin, Osinsky, Gaska and Khan9,Reference Eliseev, Perlin, Furioli, Sartori, Mu and Osinski10].
Typical DLTS spectra measured at different Vb’s for (a) sample 5961 (60 sccm), and (b) sample 5963 (20 sccm).

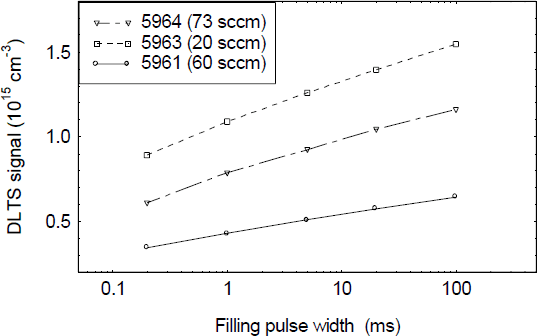
Another distinguishing feature of C1 is that it is found only in the top region of the n-GaN layers. Typical DLTS spectra measured at different Vf’s (keeping Vb fixed at −1.0 V) for sample 5964 are shown in figure 5. From the figure, we see that the peak height of C1 precipitously drops as Vf decreases from 0.6 to 0 V, resulting in nearly no observation of C1 in the deeper region of the n-GaN layer, which is in contrast with the observation of A1 in the whole layer. A final feature of C1 is the appearance of very unusual electron capture kinetics; i.e., the DLTS peak height of C1 versus Wf does not show saturation when Wf is increased from 0.2 up to 100 ms, as pictured in figure 6 for three different samples. From the figure, we see that the DLTS signals show a logarithmic dependence on the filling pulse width, Wf. Such a dependence was experimentally observed for dislocation-related deep centers in plastically deformed Si [Reference Kveder, Osipyan, Schroter and Zoth11] and GaAs [Reference Wosinski12], and explained in terms of a barrier model of electron capture via dislocations [Reference Figielski13]. This model assumes that the electron capture rate is limited by a time-dependent Coulomb barrier, with a height proportional to the number of electrons already trapped. Such a situation occurs when the traps are not randomly distributed throughout the crystal but are arranged along lines (so-called “line defects”). Recently, Auret et al. reported a deep center, ER5 (EC−0.95 eV), which was introduced by an irradiation of 5.4-MeV He ions, and found that the electron capture kinetics of ER5 were similar to those of a line defect [Reference Auret, Goodman, Koschnick, Spaeth, Beaumont and Gibart14]. In our case, the line-defect-like trap occurs in as-grown material, which gives good evidence that C1 is associated with dislocations. Note that thick MOCVD- and HVPE-GaN layers typically have dislocation densities in the 108-cm−2 range, while thin MBE-GaN layers usually have higher dislocation densities, by one to two orders of magnitude. That might be the reason why we can observe C1 only in thin RMBE-GaN layers, but not in MOCVD and HVPE layers.
Typical DLTS spectra measured at different Vf’s for sample 5964.

DLTS signal of C1 versus filling pulse width (Wf) for three samples.

E1, with a trap concentration in the mid-1015 cm−3 range, was first observed in the RMBE-GaN samples in set I [Reference Fang, Look, Kim, Fan, Botchkarev and Morkoç6]. Here, in the RMBE samples of set II, we also observe E1, but with lower trap concentrations (in the 1014 cm−3 range), and only in those samples (5962 and 5963) grown with lower AFRs. The higher concentrations of E1 in the samples of set I might be related to the undoped SI GaN layer under the n-GaN layer, since we have found a significant thermally stimulated current trap at low temperatures in RMBE-grown SI-GaN, with an approximate activation energy of 0.17 eV [Reference Look, Fang, Kim, Aktas, Botchkarev, Salvador and Morkoç15]. Note that this energy is also close to that of the EI-induced trap E, thought to be related to an N vacancy. In this light, the variation of E1 with AFR can be understood in terms of the existence of VN-related defects; i.e., the lower AFR would result in a higher concentration of VN and vice versa. Also, the observed dependence of carrier concentration with AFR (figure 1) may involve VN-related donors, or impurity donors, such as oxygen, on the N site. Note that Si donors, on the Ga site, would be expected to increase at higher AFR. The EI-induced trap E most likely has a Frenkel pair (VN-NI) nature and anneals out at about 300 °C [Reference Look, Reynolds, Hemsky, Sizelove, Jones and Molnar16]. Thus, the trap E1, which is stable at the growth temperatures of 750-800 °C, cannot be identical to E, but is probably a defect complex involving VN.
Conclusions
Deep centers in Si-doped n-GaN samples grown on sapphire by RMBE, using different AFRs, have been studied by DLTS over a temperature range of 80 to 400 K. In addition to DLTS centers A1 (0.89 eV), A (0.67 eV), B (0.62 eV), C (0.45 eV) and D (0.24 eV), which are commonly observed in MOCVD- and HVPE-GaN, two new centers C1 and E1 are found in RMBE-GaN. C1, with a low-field activation energy of 0.43 to 0.48 eV, depending on the carrier concentration, shows strong electric field effects. Its unusual electron capture kinetics suggests that it might be related to a dislocation. E1, with an activation energy of 0.25 eV, shows a close connection with the AFR and is believed to be a defect complex involving the nitrogen vacancy.
Acknowledgements
The work of Z-Q.F. and D.C.L. was supported by U.S. Air Force Contract No. F33615-95-C-1619. Part of the work was performed at the Air Force Research Laboratory, Wright-Patterson Air Force Base, OH. Also, partial support was received from the Air Force Office of Scientific Research. The research at VCU is funded by AFOSR, ONR, and NSF.