A contaminated healthcare environment contributes to pathogen transmission.Reference Ray, Deshpande and Fertelli1, Reference Weinstein and Hota2 Environmental evaluation with fluorescent gel (EFG) is recommended to improve patient room cleaning.3, Reference Carling, Briggs, Perkins and Highlander4 In this method, fluorescent gel, only visible with ultraviolet (UV) light, is placed on high-touch surfaces (HTSs) in patient rooms and bathrooms. After an interval, removal is checked using UV light.Reference Rock, Xie and Andonian5 Removed FG (ie, no visible mark remaining using UV light) indicates a cleaned surface, and remaining FG indicates an uncleaned HTS. However, the number of HTSs to check and the number of rooms to check, balancing data accuracy with resource conservation, was unknown. In this study, we aimed to determine the lowest numbers of HTSs and rooms required to accurately predict the FG removal rate of the room and the hospital unit.
Methods
The Johns Hopkins Hospital (JHH) is a 1,020-bed tertiary acute-care teaching facility in Maryland. Between December 2016 and August 2017, we assessed FG (DAZO, Ecolab, St Paul, MN) removal for largest number of HTSs (minimum, 7; maximum, 21), in 228 rooms from 13 varied specialty hospital units, that is, the optimal method. Standardized protocol and random-number generators selected units and rooms. Assessment occurred 36 hours after placement. We noted whether a room required contact precautions and whether cleaning was daily or performed upon discharge. Daily cleaning occurred if same patient room occupied the room occupant at FG placement and checking; discharge cleaning occurred if a different patient occupied the room.
During the study, the routine hospital infection prevention EFG program with feedback continued. No changes in environmental care associate (ECA) education occurred, and ECAs were unaware of the extra FG markings. The Johns Hopkins Medicine Institutional Review Board approved the study.
We examined 6 different sampling strategies to determine the least number of HTSs needed per room. We chose strategies we considered feasible: 1, 2, 3, 4, or 5 random HTSs per room, or 1 random HTS in the main room plus 1 in the bathroom. We calculated each room’s actual FG removal rate by dividing number of HTSs with removed FG by the total number of HTSs checked. We generated 100 bootstrap samples for each strategy to ensure that the results did not depend on a single sample. We calculated sampling error, the distance between each sample removal rate, and the actual FG removal rate. We report the percentage of samples with sampling error of ≤10% and ≤5%, for each strategy. The optimal sampling strategy was the least number of HTSs for which all samples had tolerable sampling error frequency (≤10%). This optimal strategy is the point at which checking more HTSs does not significantly increase accuracy but does increase labor effort and cost. We stratified rooms into high (≥80%) and low (<80%) FG removal rate as well as discharge and daily cleaning, and we explored how the prediction might vary.
We applied the same approach for sampling rooms on a unit. If rooms were randomly selected more than once, we included only the first observation. We used Stata version 15 software (StataCorp, College Station, TX) for our analyses.
Results
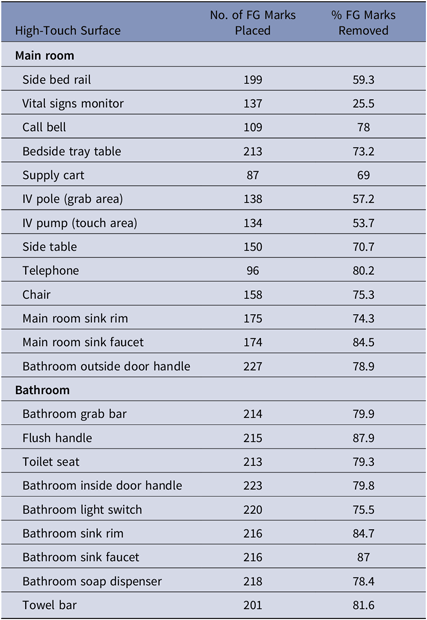
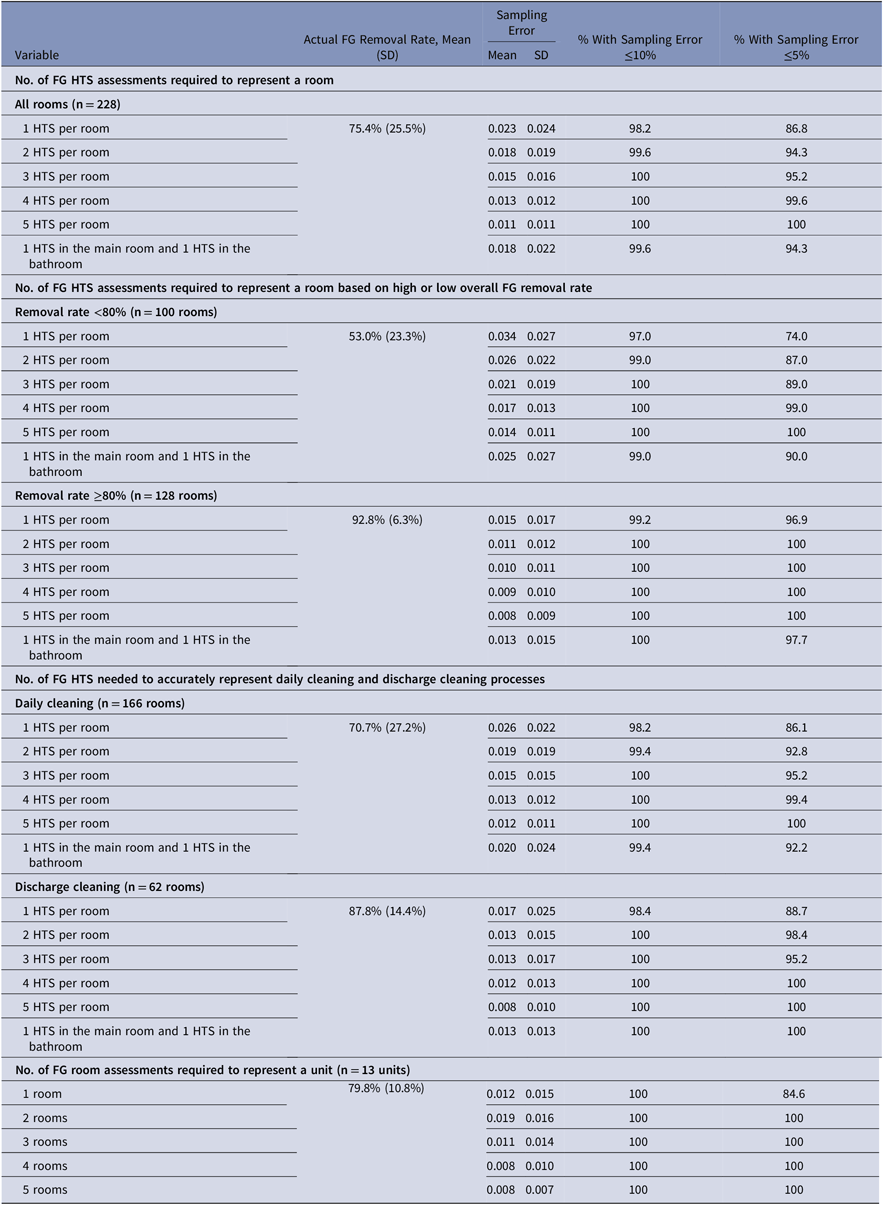
We placed and checked FG marks on 2,942 HTSs in 228 rooms on 13 units at JHH. The average number of FG HTS placements per room was 17. The overall FG removal rate was 75%; the removal rate after discharge cleaning was 88% (SD, 27%); and the removal rate after daily cleaning was 71% (SD, 27%). Table 1 shows the frequency at which each HTS was checked and its FG removal rate. Contact precautions were in place at room cleaning for 22 of 228 rooms (10%). Table 2 compares actual FG removal rates with the sampling strategies and frequency of sampling errors.
Frequency of Fluorescent Gel (FG) Placement and Removal on High-Touch Surfaces in the Observed Roomsa

a N = 228 rooms.
Summary Statistics of Actual Fluorescent Gel Removal Rates, Sampling Errors, and Percentage of Rooms with Sampling Error ≤10% and 5%
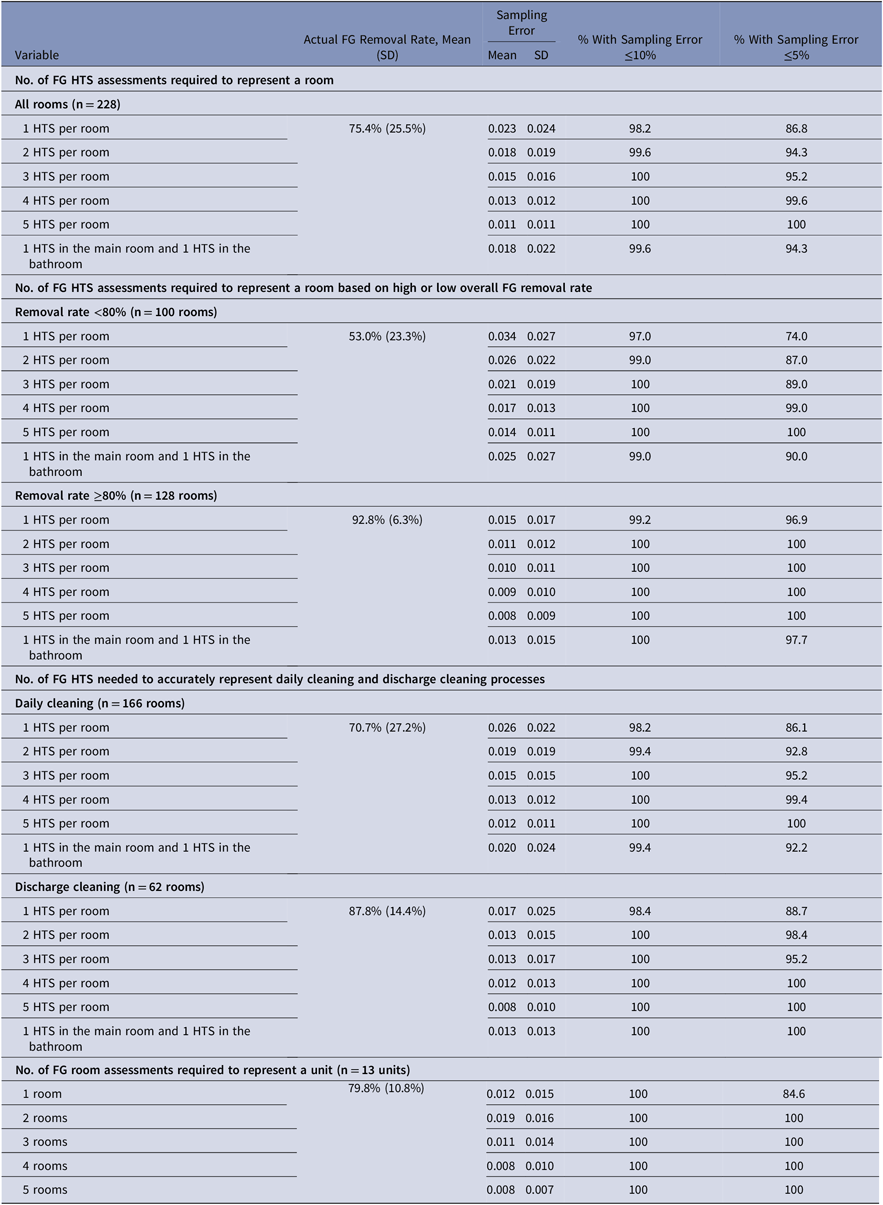
Note. FG, fluorescent gel markers; SD, standard deviation; HTS, high-touch surface.
Three randomly selected HTS from 2 randomly selected rooms was the optimal number to check to predict FG removal on the unit. Our analysis of combined sampling strategies for the numbers of HTSs and rooms revealed an average sampling error of 0.02 (standard error, 0.01). Of the 13 units, 1 had a sampling error >0.05. Moreover, 3 randomly selected HTSs remained the optimal number for rooms with low FG removal rates (n = 62) and for daily cleaning assessment (n = 166). For rooms with higher overall FG removal rates (n = 128) and for discharge cleaning (n = 62), 2 randomly selected HTSs was optimal.
Discussion
We evaluated 2,942 HTSs in 228 rooms on 13 hospital units; consistent FG assessment of 3 HTSs in 2 rooms reflects the overall room and unit removal rates. Inclusion of more HTSs or rooms did not significantly enhance accuracy. We found that near-patient, higher-risk HTSs (eg, patient area; bedrails, IV keypad, and vitals monitor) were cleaned less often. Evaluating at least 1 near-patient, high-risk HTS for each room was enough to ensure the accuracy of the data from these critical areas for monitoring and feedback. Our FG removal rates (overall 75%, discharge 88%, daily 77%) were higher than those in the published literature, which reported discharge rates of 49%–61%.Reference Carling, Parry and Von Beheren6– Reference Carling, Parry, Rupp, Po, Dick and Von Beheren8 The optimal HTS number could depend on the FG removal rate. To enhance generalizability, we stratified into low and high FG removal rates as well as discharge and daily cleaning. With less variability in FG removal rate, for example >80%, or discharge cleans only, 1 fewer HTS assessment per room provided similar accuracy. Overall, for hospitals with unknown FG removal rates, or where the rate is <80%, 3 HTSs from 2 rooms (all randomly selected) should accurately represent that unit, according to our results.
These findings provide guidance to infection prevention or environmental services teams starting EFG program. Hospitals yet to start a program may perceive significant extra human resources needed. However, choosing every 2 weeks as a reasonable interval, we estimate that EFG for 3 HTSs in 2 rooms on 5 units requires a total of 5 hours per month. Random selection of rooms and HTS ensures representation of contact precaution rooms and rooms where patients are present. This method may enhance the validity and efficiency of existing EFG programs. Some existing programs selectively target FG assessment of discharge cleaning only. Identifying those patients planned for discharge, or FG placement after patient has left but before cleaning starts, is challenging due to the postponement of discharges and the need for timely turnover of rooms. These study data may simplify that process and, importantly, expand EFG programs to include daily cleaning.
This study has several limitations. FG assessment of every HTSs in every room every day is not feasible. Our method used 228 randomly selected rooms to represent the hospital. This study was conducted in a single academic hospital, and cleaning practices may differ in other settings. However, our stratification of FG removal rate into high and low may help hospitals adapt these findings to their own cleaning programs.
Our results suggest that sampling a small number of HTSs in a small number of rooms is enough to check environmental cleaning on a unit. Hospitals should focus resources here given the importance of improving room cleanliness and relatively low human resource need. Studies using systems engineering initiatives to improve patient room cleaning are underway.Reference Rock, Cosgrove and Keller9
Acknowledgments
We thank Dr Philip Carling for providing us with fluorescent gel marker DAZO. Neither Dr Carling nor EcoLab participated in the design, analysis, interpretation, or manuscript preparation of our findings.
Financial support
This study was supported by Centers for Disease Control and Prevention, Prevention Epicenters Program, Johns Hopkins University, grant no. 1U54CK000447-01.
Conflicts of interest
ClareRock andLisa L.Maragakis report grant funding from Clorox Company, outside the submitted work. AaronM. Milstone serves as a consultant for Becton Dickinson and Company (BD), outside the submitted work.
Supplementary material
To view supplementary material for this article, please visit https://doi.org/10.1017/ice.2019.102.