Implications
In this study, the performance test effect, genealogical information and the genetic variability of the Maremmano population were analyzed. The results highlight the importance of monitoring the population structure to avoid the risk of a dangerous reduction in genetic diversity. The presence of seven blood lines, which are transmitted as a paternal attribute along with 440 female lines, is an important factor in maintaining genetic variability across the population that can be used to obtain a totipotent national saddle horse capable of satisfying all possible demands of an international market.
Introduction
Maremma is the Italian territory along the Tyrrhenian coast of Southwestern Tuscany and Northern Latium. Located about 100 to 200 km Northwestern of Rome, this geographical area spreads in two neighboring Italian provinces: Grosseto in the South of Tuscany region, and Viterbo in the North of Latium; there is evidence of horse breeding in Maremma in the Etruscan civilization (VI century B.C.). The wild and difficult environment of Maremma shaped the Maremmano which is the most important native saddle horse. In the past centuries in Italy other Mediterranean populations, like Arab and Spanish, carried out raids, wars and invasions, which shaped the Maremmano; therefore, this horse is strongly linked to Italian history and represents an important cultural resource. These aspects, especially from 1861, along with the evolution of Maremmano, have been described by Bonavolontà (Bonavolontà and Silvestrelli, Reference Bonavolontà and Silvestrelli1989).
During the time, the Maremmano’s versatility allowed it to be adapted to the following requested roles: a stock horse, a war horse, a farm horse, and finally a sport horse. The selection of Maremmano, therefore, was influenced by the historical context and market demands rather than by the attention to safeguard its typical traits. The only unchanged condition during the time was the wild environment in which the horse lives.
The Maremmano maintained its typical identity until the first half of the 19th century when it was strongly crossed with the Thoroughbred and the Arabian horse as other breeds around the world; however, this breed has preserved its genetic diversity until now (Petersen et al., Reference Petersen, Mickelson, Cleary and McCue2013). The Maremmano breeders have traditionally given importance to the male-to-male path so that every living horse is officially assigned to one of the following seven lines: Ussero (born in 1920), Ajace (1926), Otello (1927), Ingres (1946), Le Brun (1960), Noris (1961) and Ognon (1964) (Bonavolontà and Silvestrelli, Reference Bonavolontà and Silvestrelli1989). Otello is considered as the ‘true’ Maremmano horse; Ussero was a Salerno horse while the other five were Thoroughbreds.
In the past, the main buyers of Maremmano horses were the cavalry and the so-called butteri, ‘Italian cow-boys’ who used to tend cattle; however, the demand for cavalry horses and draught horses suddenly dropped after World War II causing a severe market decline.
During this period, many prestigious farms stopped horse breeding, and a lot of fine mares were dispersed so that in the ‘60 s this ancient Italian native breed was close to extinction.
At the beginning of the ‘70 s, the local breeder associations started looking for horses that showed the original traits of Maremmano such as suitability to hard work, adaptability to severe environmental conditions; in addition, the following morphological traits were taken into consideration: height around 160 cm, ram’s head profile, solid legs with hard hooves, and black or bay coat color. In 1979, the Maremmano horse breeders’ National Association (Associazione Nazionale Allevatori Cavallo di Razza Maremmana (ANAM)) was founded, and the following year the Studbook was officially appointed by the Italian law.
A 100-day station test was organized to approve the 3-year old Maremmano stallions in 1993: it was the first horse breeding evaluation in Italy; the test became mandatory 3 years later. Starting from 1999, the Maremmano was officially evaluated by 100-day station test together with Italian Saddle Horse. Because of the economic crisis in 2010, the breeders of other horse breeds suspended the stallion testing; on the contrary, the station testing of the Maremmano breed has continued, although the period was reduced to 70 days.
In addition, Maremmano mares were the first horses to be tested in Italy; in fact, ANAM has organized a 30-day station test since 1996; this test became compulsory 3 years later to appoint 3-year-old ‘elite mares.’ The results from station testing of both sexes have greatly helped breeders in planning matings.
The aim of this study is to estimate inbreeding and genetic variability of the Maremmano horse breed from genealogical data, to check the contribution of male ancestors on the actual population, and to evaluate the effects of the performance test on the genetic structure and conservation of this important ethnological resource.
Material and methods
Data
The data were obtained from National Horse Breeders Association of Maremmano Breed (ANAM) and from Sport Horse Research Centre (University of Perugia) archives. To improve the quality of the animal registration program, ANAM controlled breeders’ declarations by verifying every year the parentage of some new colts by microsatellite markers: because of the possibility of this control, the reliability of the genealogical data in the last generations should be good; however, these data are not sufficient to support a pedigree analysis.
Pedigree completeness
The completeness of pedigree information for each individual was based on: (a) the number of fully traced generations, (defined as the generations, g, separating the individual from the furthest generation where all the 2g ancestors are known); (b) the maximum number of generations traced (the number of generations separating the individual from its furthest ancestor); (c) the equivalent complete generations (computed as the sum of (1/2) n where n is the number of generations separating the individual from each known ancestor) (Boichard et al., Reference Boichard, Maignel and Verrier1997).
Genetic variability
The genetic variability of the population was identified by the following parameters: (a) individual inbreeding (F) (Wright, Reference Wright1931) defined as the probability that an individual has two identical alleles by descent computed according to Meuwissen and Luo (Reference Meuwissen and Luo1992); (b) average relatedness coefficients (AR) (Goyache et al., Reference Goyache, Gutiérrez, Fernández, Gómez, Álvarez, Díez and Royo2003; Gutiérrez et al., Reference Gutiérrez, Altarriba, Díaz, Quintanilla, Cañón and Piedrafita2003) defined as the probability that an allele randomly chosen from the whole population belongs to a given animal. In the founders AR values show their genetic contribution to the entire pedigree (Gutiérrez et al., Reference Gutiérrez, Cervantes, Molina, Valera and Goyache2008); (c) effective number of founders (f e) is the number of equally contributing founders that are expected to produce the same genetic diversity of the studied population, it is computed using the AR coefficients of founder individuals; (d) effective number of ancestors (f a) is the minimum number of ancestors, not necessarily founders, explaining the whole genetic diversity of a population. This parameter complements the effective number of founders information in accounting for the bottleneck produced by the unbalanced use of reproductive individuals (Boichard et al., Reference Boichard, Maignel and Verrier1997); (e) the ratio between the effective number of founders and the effective number of ancestors (f e /f a) indicates if the analyzed population is affected by bottleneck; in fact, a bottleneck effect occurs if f a is clearly lower than f e (ratio f e/f a >1) (Boichard et al., Reference Boichard, Maignel and Verrier1997); (f) founder genome equivalents (f g) (Ballou and Lacy, Reference Ballou and Lacy1995) can be defined as the number of founders that would be expected to produce the same genetic diversity as in the studied population if the founders are equally represented and no alleles lost occurs (Caballero and Toro, Reference Caballero and Toro2000); (g) the ratio between the founders genome equivalent and the effective number of founders (f g /f e) indicates if the analyzed population is affected by genetic drift (Boichard et al.,Reference Boichard, Maignel and Verrier1997); (h) the Genetic Conservation Index (GCI) (Alderson, Reference Alderson1992) computed as the genetic contributions of all the identified founders. The trend of GCI over time was performed with the regression coefficient of the GCI of each animal on the year of birth (1980–2015) using the lm function in R software (R Core team of the Foundation for Statistical Computing, Vienna, Austria, http://www.R-project.org/).
Population structure
The structure of the population was studied by calculating: (a) F-statistics (Wright, Reference Wright1978) from genealogical information following Caballero and Toro (Reference Caballero and Toro2000; 2002); (b) the effective population size (N e) computed in three ways: via individual increase in inbreeding (Gutiérrez, et al., Reference Gutiérrez, Cervantes, Molina, Valera and Goyache2008), via regression, and via Log regression on equivalent generations; (c) the ratio N e/2 that provides information on the occurrence of bottlenecks in the population (in a population where genetic drift has stabilized f e should be close to N e/2) (Caballero and Toro, Reference Caballero and Toro2000); (d) the generation intervals, defined as the average age of parents at the birth of their reproducing progeny, as well as the average age of parents at the birth of their progeny used whether for reproduction or not (James, Reference James1977). Both parameters are computed for the four pathways (father–son, father–daughter, mother–son and mother–daughter); (e) the genetic importance of the geographic area computed according to Gutiérrez and Goyache (Reference Gutiérrez and Goyache2005), in which regions or provinces were considered instead of herds.
Reference populations
For an efficient pedigree analysis, several ‘reference population’ have to be defined which are constituted by the animals potentially contributing to the next generation (Siderites et al., 2013). For this purpose, in this study the following four reference populations (REF) were considered:
(1) REF1 defined by the pedigree file provided by ANAM historical archives that included 15875 horses from 1920’s to 31 December 2015.
(2) REF2 represented by 14 271 Maremmano horses after the exclusion of animals having a Thoroughbred parent.
(3) REF3 included 12 368 animals officially registered in the ANAM Studbook.
(4) REF4 included 5705 living horses (1532 living parents).
The REF1 is very important to reconstruct the pedigree and breed’s history, and REF2 is considered the population of the ‘typical Maremmano horses,’ while REF3 and 4 are relevant for the genetic selection of the actual breed.
A similar approach in horse (several populations) was considered by other authors (Pjontek et al., Reference Pjontek, Kadlečík, Kasarda and Horný2012; Siderits et al., Reference Siderits, Baumung and Fuerst-Waltl2013; Vostrá-Vydrová et al., Reference Vostrá-Vydrová, Vostrý, Hofmanová, Krupa and Zavadilová2016).
The demographic and genetic parameters were calculated using ‘Endog v 4.8’ software (Gutiérrez and Goyache, Reference Gutiérrez and Goyache2005), the percentage of Thoroughbred blood in each horse of the population was carried out using an in-house Fortran software and graphed using Microsoft Excel.
Results
Data
In the 1st year of its official activity, the ANAM Studbook registered 203 foals (REF3), and the number did not change in the following 2 years. Then, the number increased to 498 in 1991, reaching its maximum in 1997 (504 foals). Subsequently, the number of foals decreased to 311 in 2000 and remained stable until 2008, when it decreased to 214 by 2015 because of the economic crisis. The number registered in 2015 was almost the same as the number registered when the Studbook first started.
In the first 3 years of the Studbook, more than a half of the foals were used as parents; in the years after that, the number of foals increased, however, the number of stallions and mares selected each year remained unchanged until the introduction of performance testing. This selection method caused a reduction in the number of parents, therefore, a more stable selection intensity; in addition, the number of foals decreased as indicated by the similar trends (Supplementary Figure S1).
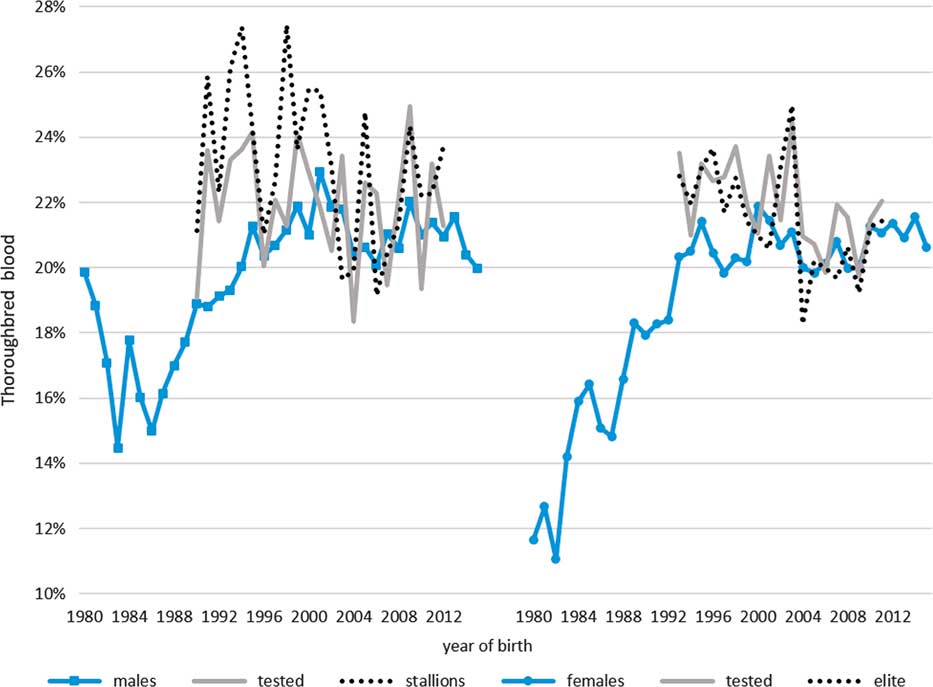
The percentage of Thoroughbred blood (Figure 1) strongly influenced the choice of candidates at the performance test; in fact, in the newly born colts, this value was 20.75±1.05, whereas in the 421 tested males, this value was 21.96±1.81. This percentage further increased to 23.20±2.43 in the 152 approved stallions. The values of the approved horses were greater than those of the candidates in 17 out of 23 performance tests. The Thoroughbred blood percentage was lower in the female; in fact, the value of newly born fillies was 20.59±0.62, whereas in the 785 tested mares it increased to 21.97±1.31. However, only in 5 out of 19 years did the elite mares have a Thoroughbred blood percentage higher than the tested mares so that the 360 elite mares showed a lower value of 21.46±1.67. As a result of the selection system, approved stallions had a higher value than the newly born animals in 19 out of 23 years, and elite mares in 12 out of 19. Moreover, it should be pointed out that the percentage of Thoroughbred blood in this population has increased 0.21%/year since 1980; however, the increase doubled to 0.51% in 1993 and remained stable in the following years.
Percentage of the Thoroughbred blood of the Reference population 3 (12 368 Maremmano horses officially registered in the National Studbook) per year of birth and sex (all males, males tested in the performance test, and approved stallions; all females, females tested in performance test and elite mares).

Pedigree completeness
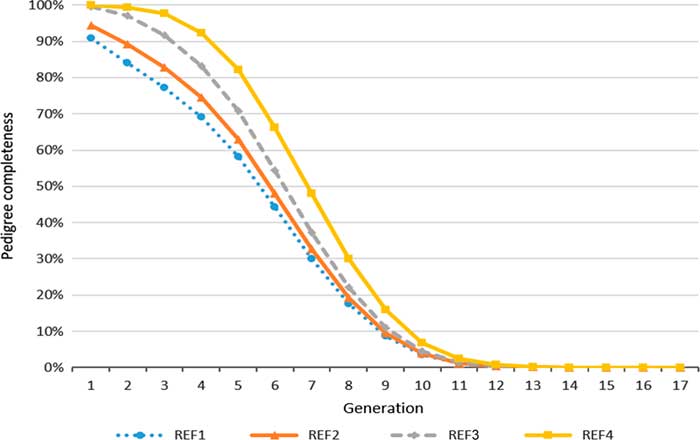
The completeness of the pedigree information (number of fully traced generations) is shown in Figure 2. The REF4 had very good values of completeness: 99.90%, 99.40%, 97.70%, 92.30%, and 82.20% from the first to the fifth parental generation. On the other hand, REF3 had obviously lower percentages of pedigree completeness (99.50%, 97.20%, 91.60%, 83.20% and 70.90%, respectively), and REF2 and REF1 had further decreased values. All populations showed a similar pattern of completeness by generation, and both these values and the values of the oldest records can be considered satisfactory.
Pedigree completeness per generation of REF1 (Reference population of 15 875 horses in the complete pedigree), REF2 (Reference population of 14 271 Maremmano horses after the exclusion of animals having a Thoroughbred parent), REF3 (Reference population 12 368 Maremmano horses officially registered in the National Studbook), REF4 (Reference population of 5705 living horses).

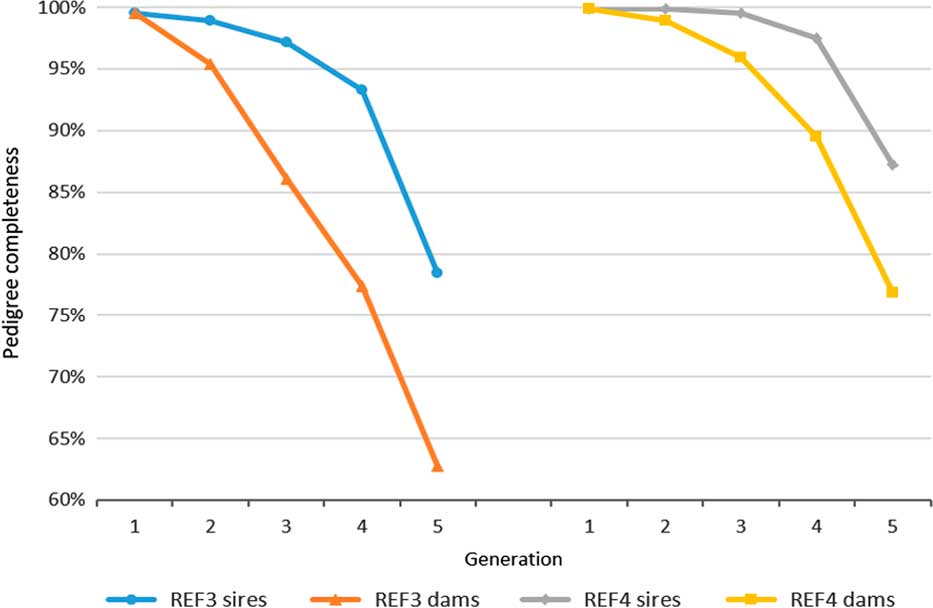
As shown in Figure 3, the paternal pathways seem to be more complete than the maternal pathways, and this difference has been decreasing in time. In fact, the difference in completeness between parents was below 1% in both REF3 and REF4; in the grandparent's generation, the difference increased to 3.50% in the Studbook (REF3), whereas it was still below 1% in living Maremmano horses (REF4). In the grand-grandparents, the difference was 3.60% in the living animal population (REF4), although it was more than 11% of the Studbook population (REF3).
Pedigree completeness per generation of the paternal and maternal pathways in the REF3 (Reference population 12 368 Maremmano horses officially registered in the National Studbook) and REF4 (Reference population of 5705 living horses).

In the REF2 population, the mean of the maximum number of generations traced was 9.4; the mean of the complete generations was 3.0, and the mean of equivalent complete generations 5.2. In the REF3 population, these values increased to 10.5, 3.3 and 5.7, whereas in REF4 they were 11.6, 3.8 and 6.4, respectively.
Genetic variability
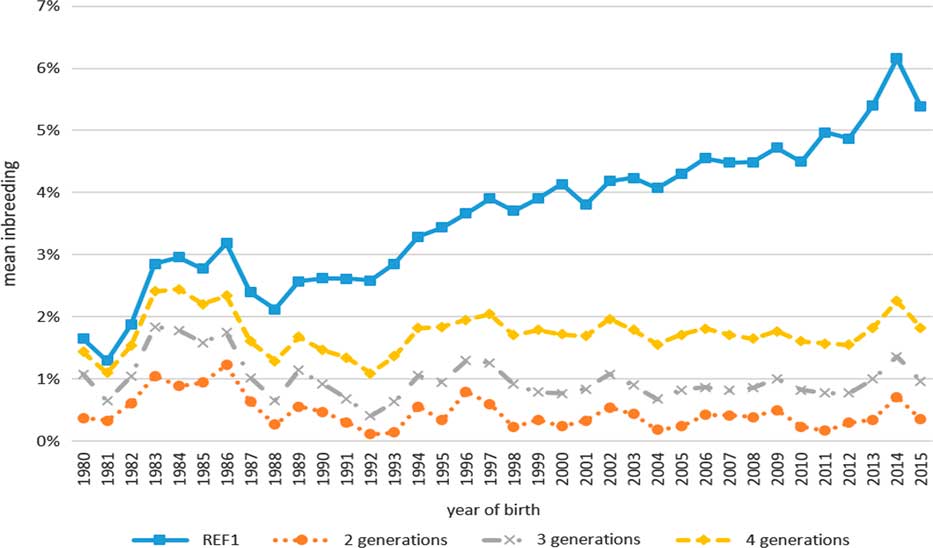
The average inbreeding (F) in the whole population (REF1) was 2.90% and ranged from a minimum of 1.29% (1981) to a maximum of 6.16% (2014) as shown in Figure 4; this value increases on average 0.10%/year although it decreased to 5.38% in 2015. The average inbreeding computed with 2, 3 and 4 generations was 0.46%, 0.99% and 1.73%, respectively. The values of the average inbreeding in the three other reference populations were as follows: 2.63% in REF2, 2.94% in REF3 and 3.55% in the REF4.
Mean inbreeding in REF1 (Reference population of 15 875 horses in the complete pedigree) Maremmano horses per year of birth.

The mean of the AR in the REF1 population was 5.16 % and ranged from a minimum of 0.01% to a maximum of 14.61%. In the three other populations, this value was 2.01% in REF2, 5.52% in REF3, and 6.13% of the living animals (REF4).
The effective number of founders (f e) in the four studied populations was 84 (REF1), 87 (REF2), 74 (REF3) and 64 (REF4); however, only 13 individuals can explain 50% of the genetic variability of the breed in REF1, 11% in REF2 and REF3 and 8% in REF4.
The effective number of ancestors (f a) was 35 in REF1, 36 in REF2, 30 in REF3 and 25 in REF4.
The ratio f e/f a was 2.40 in REF1, 2.42 in REF2, 2.47 in REF3 and 2.56 in REF4. The founder genome equivalents (f g) were 19.37, 16.79, 13.72 and 11.06 in REF1, 2, 3 and 4 populations, respectively.
The ratio f g/f e was 0.23 in REF1, 0.19 in REF2, 0.18 in REF3 and 0.17 in REF4.
The GCI index was calculated from the genetic contributions of all the identified founders of the population, and it is assumed that every horse that has a more balanced quantity of genes from a large number of founders has a higher GCI value (McManus et al., Reference McManus, Santos, Lima Dallago, Rezende Paiva, Saraiva Martins, Braccini Neto, Rocha Marques and Pinto de Abreu2013).
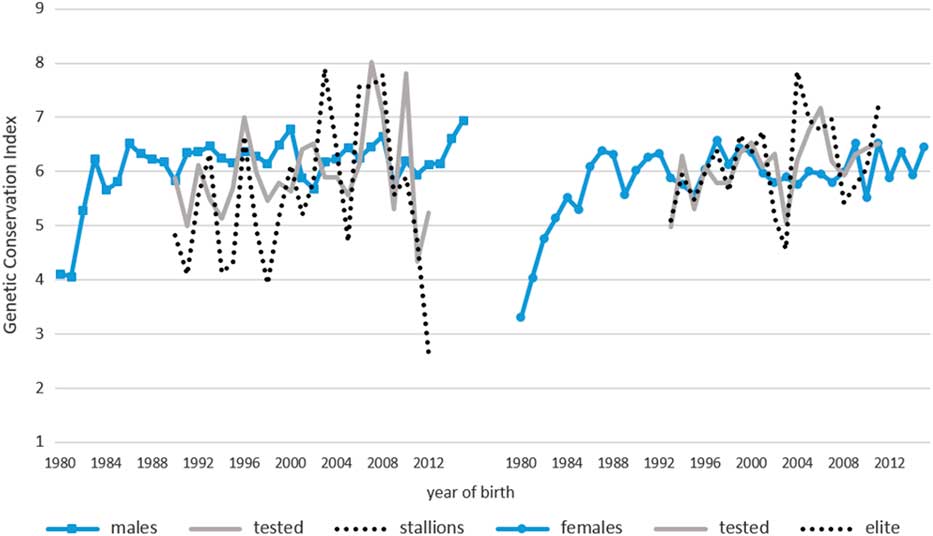
In the REF3 population, the mean of GCI was 5.55±3.37 and ranged from a minimum of 0.81 to a maximum of 21.32; the regression coefficient estimated on the animals born from 1980 to 2015 was equal to 0.034±0.009 (P<0.001). This index computed by sex was equal to 6.03±3.31 in the males and 5.22±3.37 in the females. In the official Maremmano Studbook population (REF3), an increase of GCI was noted along the observed period both in males and females; in fact, the values of the regression coefficients on the year of birth are 0.028±0.008 (P<0.01) and 0.034±0.009 (P<0.001), respectively.
In order to ascertain if GCI was effectively influenced by the selection system, this parameter was calculated in the tested parents and their progeny (Figure 5). The ‘new colts’ (foals born after the beginning of stallion performance test) had a GCI value of 6.23±0.28, and this value decreased to 5.98±0.87 in tested males. It must be observed that the GCI value further decreased to 5.56±1.36 in the approved males: in fact, the group of approved males had a lower GCI than the candidates in 15 out of 23 performance tests. The GCI reduction was not present in the females path; in fact, the newly born fillies and the tested mares had very similar values (6.03±0.32 and 6.11±0.55, respectively). The elite group had a further increase of the GCI value to 6.16±0.83, whereas the elite mares had lower GCI than the tested mares only in 10 out of 19 performance tests.
Genetic Conservation Index of the Reference population 3 (12 368 Maremmano horses officially registered in the National Studbook) per year of birth and sex (all males, males tested in the performance test and approved stallions; all females, females tested in performance test and elite mares).

Table 1 shows the percentage of the seven founders represented in REF3, REF4, living parents (1 532 horses), tested males and females, as well as stallions and elite mares. In the REF3 and the living parents, Ajace presented the highest gene percentage (18.1% and 18.6% respectively). However, the most prevalent founder in REF4 (16.8%), tested males (27.0%), mares (19.6%), stallions (25.85%) and elite mares (20.9%) was Otello followed by Ajace, Ussero, and Ingres. Le Brun, Ognon and Noris were scarcely represented. According to the number of descendants, the breeders call the first four stallions ‘the major lines’ and the last three ones ‘the minor lines.’ Because there is no living stallion connected through the paternal bloodline to Le Brun, Noris or Ognon, these minor lines can be considered extinct. In fact, when the Studbook was officially founded, the blood contribution in each of the three main lines was near 2.5% (Supplementary Figure S2), and it increased to 4% in the following years. Ajace has been in the third place since 1994, and Ingres has been in the first place since 2003. Ussero was the lowest contributor amongst the main lines: in fact, his blood percentage ranged between 1% and 2%. The blood percentage in each of the three minor lines (Le Brun, Noris and Ognon) was always below 1%.
Percentage of founders represented in horses of different subsets according to their paternal line

REF3=Reference population (12 368 animals officially registered in the Associazione Nazionale Allevatori Cavallo di Razza Maremmana Studbook); REF4=Reference population 4 (5705 living horses).
Population structure
The effective population size (N e) computed by an individual increase in inbreeding was 68.1±13.0 in REF3 population and 71.2±12.5 in the REF4. The effective population size on equivalent generations was 42.0 in the REF3 and 36.6 in REF4; however, these values slightly changed to 42.2 and 36.9, respectively, when computed by Log regression on equivalent generations. The ratio N e/2 (where N e is computed by individual increase in inbreeding) was equal to 34 in REF3 and 36 in REF4.
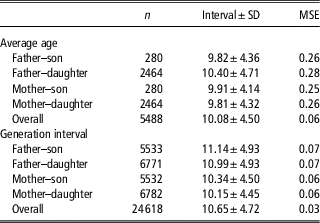
The average age (Table 2) was 10.08±4.50 years, ranging from 9.81±4.32 (mother–daughter) to 10.40±4.71 (father–daughter), and the average age in sires was longer than in dams because stallions are used for longer periods than mares. The generation interval showed rather higher values than the average age expected.
Average age and generation interval and (years) of parents at the birth of their offspring for the REF3 Maremmano horses

REF3=reference population (12 368 animals officially registered in the Associazione Nazionale Allevatori Cavallo di Razza Maremmana Studbook).
As for the geographical area (Table 3), Tuscany seems to be the most important because 48.7% of the foals (6 953) were born in this region, and 74.3% of their fathers were born in the same area. Only 2 378 foals (16.7%) were born out of the origin area although 85.7% of their fathers still came from Tuscany or Latium. Discussing this in more detail and taking into account only the most significant origin provinces, it can be observed that the stallions from Grosseto and Viterbo respectively produced 39.0% and 25.0% of all Maremmano foals. The F-statistics were calculated to evaluate the within-population genetic differences between Latium, Tuscany and other regions, and the values were as follows: F ST= 0.001568, F IT=−0.000208 and F IS=−0.001778. If the provinces of Viterbo and Grosseto were considered instead of Latium and Tuscany, the values were as follows: F ST= 0.002789, F IT=−0.000208 and F IS=−0.003006. The increase of the F ST was expected because the two provinces are more separated than the two regions, whereas the decrease of FIS indicates that the breeders are more aware of the inbreeding problems in these limited areas.
Distribution of REF2 Maremmano foals and use of stallions by geographic area

REF2=reference population 2 (14 271 Maremmano horses after the exclusion of animals having an Thoroughbred parent).
Discussion
Pedigree completeness
Some authors have studied horse breeds with similar consistency as Maremmano. In the Spanish Arab horse the completeness of the pedigree was higher than 90% until the sixth generation (Cervantes et al., Reference Cervantes, Molina, Goyache, Gutierrez and Valera2008). In the Austrian draft horse (Noriker), 90% of ancestors were known up to the 9th generation (Druml et al., Reference Druml, Baumung and Sölkner2009). In the German Paint Horse, the completeness in the second generation was respectively 99.9%, 99.9% and 99.6% for the RP 1 (reference population 1 registered animals born in Germany between the years 2000 and 2009), RP 2 (reference population 1 with a manually improved pedigree) and RP 3 (third reference population including 679 horses based on animals born in Germany between 1990 and 1999) (Siderits et al., Reference Siderits, Baumung and Fuerst-Waltl2013). In the Pantaneiro, the number of pedigrees known over the generations increased mainly between the 4th and 5th generation (96%) (McManus et al., Reference McManus, Santos, Lima Dallago, Rezende Paiva, Saraiva Martins, Braccini Neto, Rocha Marques and Pinto de Abreu2013). In Turkish Arab horse, the pedigree completeness was 100% in both first and second generations although it decreased markedly after the seventh generation (Duru, Reference Duru2017).
In larger horse populations, the estimated completeness was slightly different. In the Andalusian horse, this parameter was higher than 90% considering the first five generations of ancestors (Valera et al., Reference Valera, Molina, Gutiérrez, Gómez and Goyache2005), whereas in the Brazilian Sport horse (Medeiros et al., Reference Medeiros, Bertoli, Garbade and McManus2014), the completeness for all animals born until 1996 was equal to 99.80, 78.60, 28.10 and 6.70% from first to fourth parental generation, respectively. In the same breed and the same generations, the completeness was equal to 99.99, 98.30, 69.90 and 37.8 in more recent pedigrees (1997–2012).
Finally, Zechner et al. (Reference Zechner, Sölkner, Bodo, Druml, Baumung, Achmann, Marti, Habe and Brem2002) reported that in Lipizzano (3867 animals) at the first five generations, the pedigrees were virtually complete, and even in the 10th generation 90% of the ancestors were known. Pjontek et al. (Reference Pjontek, Kadlečík, Kasarda and Horný2012) studied some endangered horse populations bred in Slovakia and found that the first four generations of pedigrees were virtually complete in Lipizzan (162 horses) and Shagya Arabian (171 horses), whereas the proportion of the known ancestors dropped to <50% after 11 generations in the Lipizzan, 10 generations in the Shagya Arabian, and seven generations in the Hucul (158 horses). In the Old Klauber horse (7971 horses), 100% of the complete pedigree was known until the sixth generation (Vostrá-Vydrová et al., Reference Vostrá-Vydrová, Vostrý, Hofmanová, Krupa and Zavadilová2016).
Genetic variability
As already mentioned, in the Maremmano the value of average inbreeding in the REF1 population was 2.90% and increased to 3.55% in REF4. It is well known that this value is very influential in pedigree completeness and quality because there is a positive correlation between these two parameters (Valera et al., Reference Valera, Molina, Gutiérrez, Gómez and Goyache2005; Druml et al., Reference Druml, Baumung and Sölkner2009). In pedigrees with similar size, the average inbreeding reached 7.0% in Spanish Arab Horse (Cervantes et al., Reference Cervantes, Molina, Goyache, Gutierrez and Valera2008), 5.1% in Austrian Noriker (Druml et al., Reference Druml, Baumung and Sölkner2009), 4.6% in Turkish Arab (Duru, Reference Duru2017) and 4% in Pantaneiro (McManus et al., Reference McManus, Santos, Lima Dallago, Rezende Paiva, Saraiva Martins, Braccini Neto, Rocha Marques and Pinto de Abreu2013), whereas it was still 0.15% in Brazilian Sport Horse (Medeiros et al., Reference Medeiros, Bertoli, Garbade and McManus2014). Therefore, in the four studied Maremmano REF populations, the average inbreeding coefficients seem to be generally lower than in other horse populations. As previously discussed in deeper pedigrees, this value was more stable and ranged between 8% and 9% (Valera et al., Reference Valera, Molina, Gutiérrez, Gómez and Goyache2005; Vicente et al., Reference Vicente, Carolino and Gama2012), whereas in small populations, it ranged from a minimum of 0.35% (Siderits et al., Reference Siderits, Baumung and Fuerst-Waltl2013) to a maximum of 13.1% (Vostrá-Vydrová et al., Reference Vostrá-Vydrová, Vostrý, Hofmanová, Krupa and Zavadilová2016).
In animal breeding, AR can be used to preserve the genetic pool; as a matter of fact, the use for reproduction of animals with the lowest AR can minimize the inbreeding because they are expected to balance the contribution of the founders in the population.
In Maremmano, the AR values were much lower than the values reported for the Andalusian horse (12.20%) (Valera et al., Reference Valera, Molina, Gutiérrez, Gómez and Goyache2005) and the Turkish Arab (9.50%) (Duru, Reference Duru2017). These results are related to the inbreeding coefficients mentioned above; in fact, 93.40% of the animals registered in Andalusian Studbook and 94.20% of those registered in Turkish Arab Horse Herdbook had an inbreeding coefficient >0, whereas in the whole Maremmano pedigree this percentage dropped to 69.90%.
The pedigree analysis of Maremmano showed the presence of 440 founder mares, and 14 of them were born before World War II. This situation had already been observed in a previous mitochondrial analysis (Lancioni et al., Reference Lancioni, Capomaccio, Felicetti, Cappelli, Silvestrelli, Verini Supplizi and Achilli2011) whose results were in agreement with the Studbook data.
The bottleneck (ratio f e/f a) in Maremmano (2.40 to 2.50) was higher than that observed in Spanish Arab (0.98), Turkish Arab (1.81), Pantaneiro (all=1.05; recent=1.10) and Lusitano (2.34) reference populations (Cervantes et al., Reference Cervantes, Molina, Goyache, Gutierrez and Valera2008; Vicente et al., Reference Vicente, Carolino and Gama2012; McManus et al., Reference McManus, Santos, Lima Dallago, Rezende Paiva, Saraiva Martins, Braccini Neto, Rocha Marques and Pinto de Abreu2013; Duru, Reference Duru2017). The progressive reduction in genetic variability was confirmed by genetic drift (f g/f e ratio). Because of this situation, the selection plans should also consider the maintaining of genetic variability; however, a higher bottleneck was estimated in Austrian Noriker (4.00) and in the population of Paint German horse (RP1: 2.69, RP2: 5.17, RP3: 4.26) (Druml et al., Reference Druml, Baumung and Sölkner2009; Siderits et al., Reference Siderits, Baumung and Fuerst-Waltl2013).
The GCI is useful to estimate the effective number of founders in a pedigree, so animals with a high value of GCI are crucial for the breed conservation; in fact, the ideal individual would receive an equal contribution from all the founder ancestors. Due to lack of pedigree information in Maremmano, this index (5.55) is lower than the index in Lusitano (53 411 horses) where it reaches 9.5±2.73 (Vicente et al., Reference Vicente, Carolino and Gama2012). On the other hand, the Maremmano GCI is >1.33 value that was observed in Pantaneiro horse (10 441 animals) (McManus et al., Reference McManus, Santos, Lima Dallago, Rezende Paiva, Saraiva Martins, Braccini Neto, Rocha Marques and Pinto de Abreu2013).
The trend of GCI in our population has increased over time in both males and females. However, in recent years, this index has rapidly decreased in stallions, whereas it has increased in the elite females. This situation is certainly due to the use of Thoroughbred blood in males to obtain remarkable sporting aptitude rapidly; whereas, in the elite female, the increase of GCI values is due to their selection plan that strongly preserves the founder’s genes. This fact is also confirmed by the variability in maternal genetic contributions (Achilli et al., Reference Achilli, Olivieri, Soares, Lancioni, Kashani, Perego, Nergadze, Carossa, Santagostino, Capomaccio, Felicetti, Al-Achkar, Penedo, Verini-Supplizi, Houshmand, Woodward, Semino, Silvestrelli, Giulotto, Pereira, Bandelt and Torroni2012; Cardinali et al., Reference Cardinali, Lancioni, Giontella, Capodiferro, Capomaccio, Buttazzoni, Biggio, Cherchi, Albertini, Olivieri, Cappelli, Achilli and Silvestrelli2016), which was higher when the Maremmano horse breed was officially founded (1980) and was maintained over the years, balancing the decrease that was observed in the ‘stallions’ GCI. In this way, it is possible to maintain two different horse lines in the breed: ‘sports’ and ‘traditional.’
These trends were shown by the positive value of the regression coefficient of GCI on the year of birth computed in the Maremmano REF2 which revealed an increase over the time. In Lusitano (Vicente et al., Reference Vicente, Carolino and Gama2012), an opposite trend (−0.009747±0.00150) was observed; in this breed, the founders representation was, in fact, progressively lost.
The good results in Maremmano selection and conservation are probably due to both the completeness of pedigree data and the suitable breeding program that takes into account the founders genes.
As previously reported, there were four ‘major’ and three ‘minor’ founders lines in Maremmano; although the breeders focus their choice on these male lines, it should be noted that there is a different percentage of founders in each of these lines. Besides being the less represented in the population, the three minor line founders also have lower percentages than the overall founders. The blood percentage of Ingres in the population is fourfold the percentage of Ussero. When a breeder selects a sire from the Ussero line, there is only 1% of its genes, whereas in a sire from the Ingres line there is 4% of genes from Ingres; if breeders select an elite mare from the Ussero line, she preserves 7.2% of the Maremmano founders’ genes, and this percentage is just a little higher (9.2%) in a mare from the Ingres line. In a stallion from the Otello line, which is probably the most famous and wanted the line, there is still 25% of Maremmano founders’ genes.
The geographical genetics analysis by the Wright’s F shows that Viterbo and especially Grosseto are actually the ‘centers’ of the breed although the value of F ST indicates that there is no difference between the two subpopulations. Furthermore, the negative values of F IT and F IS pointed out that probably the breeders choose mating systems that contain the inbreeding.
Population structure
The values of N e computed via individual increase in inbreeding in the REF3 and REF4 Maremmano populations (68.10 to 71.20) were close to the values estimated in Turkish Arab (74.40) (Duru, Reference Duru2017) and were higher than the values reported by Vicente et al. (Reference Vicente, Carolino and Gama2012) in Lusitano (41.24); however, they were lower than the values of the Brazilian Sport horse (205.78) (McManus et al., Reference McManus, Santos, Lima Dallago, Rezende Paiva, Saraiva Martins, Braccini Neto, Rocha Marques and Pinto de Abreu2013). In addition, the N e calculated on equivalent generations (42.00 to 36.60) and on Log regression (42.20 to 36.90) were also higher than those estimated in Brazilian Sport Horse (25.06 to 22.77) (Medeiros et al., Reference Medeiros, Bertoli, Garbade and McManus2014). The values of N e/2 in the REF3 and REF4 Maremmano populations (34–36) together with the effective number of founders (87 to 64) and the ratio f e/f a (2.42, 2.56) confirmed, as already reported that a bottleneck in this breed is occurring.
The average generation intervals estimated on the four parent-offspring pathways were close to those of Andalusian horse (10.11), Lusitano (10.28) and American Quarter Horse (10.5). (Valera et al., Reference Valera, Molina, Gutiérrez, Gómez and Goyache2005; Vicente et al., Reference Vicente, Carolino and Gama2012 Petersen et al., Reference Petersen, Mickelson, Cothran, Andersson, Axelsson, Bailey, Bannasch, Binns, Borges, Brama, da Câmara Machado, Distl, Felicetti, Fox-Clipsham, Graves, Guérin, Haase, Hasegawa, Hemmann, Hill, Leeb, Lindgren, Lohi, Lopes, McGivney, Mikko, Orr, Penedo, Piercy, Raekallio, Rieder, Røed, Silvestrelli, Swinburne, Tozaki, Vaudin, Wade and McCue2014). Lower generation intervals were observed in Pantaneiro horse (8.20 years) and Slovak Sport Pony (9.96) (Pjontek et al., Reference Pjontek, Kadlečík, Kasarda and Horný2012; McManus et al., Reference McManus, Santos, Lima Dallago, Rezende Paiva, Saraiva Martins, Braccini Neto, Rocha Marques and Pinto de Abreu2013). Higher values of generation intervals were observed in the Hucul horse (11.14), Carthusians (11.50), Lipizzaner (11.61), Shagya Arabian horse (12.27) and Turkish Arab (12.40) (Pjontek et al., Reference Pjontek, Kadlečík, Kasarda and Horný2012; Valera et al., Reference Valera, Molina, Gutiérrez, Gómez and Goyache2005; Duru, Reference Duru2017).
Conclusions
This study confirms the completeness of genealogical information and the traditional importance that breeders gave to the male lines; these two factors had a key role in helping the Maremmano horse to preserve much of its genetic diversity. In the first decade of ANAM activity, the goal of the association was the conservation of the breed, and it seems to have been achieved. In the following years the goal changed, and a more intensive selection took place by means of performance testing. The genetic diversity of Maremmano was not endangered by intensive selection although there have been some effects on the population structure. In our opinion, the traditional methods of preserving genetic diversity are no longer sufficient, and a more scientific approach should be incorporated in the selection plans.
Acknowledgments
The authors would like to express their special appreciation and thanks to ANAM – Maremmano Horse Breeders Association for providing pedigree data and to two anonymous referees for providing constructive input.
Declaration of interest
The authors have no conflict of interest to declare.
Ethics statement
The approval of the work by an ethics committee was not required by Italian legislation.
Software and data repository resources
The Maremmano horse pedigree dataset is the property of Associazione Nazionale Allevatori Cavallo di Razza Maremmana, via Canova 13/a – 58100 Grosseto (Italy) www.anamcavallomaremmano.com
Supplementary material
To view supplementary material for this article, please visit https://doi.org/10.1017/S1751731118001180