Introduction
Parasites, which comprise an exceptionally diverse group of organisms, are ubiquitous in the environment (Price, Reference Price1980; Windsor, Reference Windsor1998). Moreover, parasites by definition damage host fitness (Scott and Dobson, Reference Scott and Dobson1989; Ewald, Reference Ewald1995; Windsor, Reference Windsor1998; Fitze et al., Reference Fitze, Tschirren and Richner2004), and hence, parasites represent a pervasive and causal force in the evolution of resistance. The potential for parasites to drive the evolution of resistance traits is further underscored by the existence of genetic variation in resistance and tolerance in nearly every host population of animal and plant surveyed so far (Wakelin, Reference Wakelin1978; Fritz and Simms, Reference Fritz and Simms1992; Henter and Via, Reference Henter and Via1995; Sorci et al., Reference Sorci, Møller and Boulinier1997; Combes, Reference Combes2001; Rausher, Reference Rausher2001; Luong and Polak, Reference Luong and Polak2007; Brown and Tellier, Reference Brown and Tellier2011; Mazé-Guilmo et al., Reference Mazé-Guilmo, Loot, Páez, Lefèvre and Blanchet2014; Marino, Reference Marino2016; Buzatto et al., Reference Buzatto, Kotiaho, Assis and Simmons2019). Drosophila represents an excellent system to examine host–parasite interactions, from the perspective of the host–parasite interface, resistance and of potential costs associated with the proximate and evolutionary responses to parasitism.
One emerging system that offers the opportunity for in-depth study of host–parasite interactions involves Drosophila and their ectoparasitic mites (Polak and Markow, Reference Polak and Markow1995; Polak, Reference Polak1996, Reference Polak1998, Reference Polak2003; Perez-Leanos et al., Reference Perez-Leanos, Loustalot-Laclette, Nazario-Yepiz and Markow2017; Durkin and Luong, Reference Durkin and Luong2019). Fly–mite interactions are naturally occurring, and mites are associated with a variety of Drosophila species (Polak and Markow, Reference Polak and Markow1995; Halliday et al., Reference Halliday, Walter and Polak2005). It has been established that a species of mite, Macrocheles subbadius Berlese, which was once presumed to be phoretic, extracts haemolymph from the flies and causes significant cuticular damage during feeding and subsequent scar formation by the host (Polak, Reference Polak1996; Luong and Polak, Reference Luong and Polak2007; Perez-Leanos et al., Reference Perez-Leanos, Loustalot-Laclette, Nazario-Yepiz and Markow2017). This nutrient extraction and mite-derived damage negatively affects male and female reproductive tissues (Polak, Reference Polak1996, Reference Polak1998). Mites are significant agents of both natural and sexual selection (Polak and Markow, Reference Polak and Markow1995; Polak, Reference Polak1996; Polak and Starmer, Reference Polak and Starmer1998), and hence are expected to be drivers of the evolution of host adaptation. Of interest, host behavioural and physiological traits, such as up-regulation of reproductive effort (Polak and Starmer, Reference Polak and Starmer1998), anti-mite defensive behaviours (Polak, Reference Polak2003), choice of oviposition sites (Mierzejewski et al., Reference Mierzejewski, Horn and Luong2019) and rates of respiration (Luong et al., Reference Luong, Horn and Brophy2017), are influenced by the presence of mites, highlighting the multiple components of fly biology influenced by the activity of mites. Mites associated with drosophilids in general likely benefit from attacking flies by increasing their own reproductive output through increased nutrient intake and through gaining the ability to disperse to a new habitat when their fly host moves to a new locality (Walter and Proctor, Reference Walter and Proctor2013). The molecular mechanisms underlying host responses to ectoparasitic mites are unknown, yet are critical to identifying putative genetic targets of mite-mediated selection.
Drosophila melanogaster Meigen is a cosmopolitan species within the melanogaster species group that exploits a variety of fermenting fruits (Keller, Reference Keller2007) and is a widely used model species in genetics research. Flies are naturally parasitized by mites within the genus Gamasodes (Acari: Parasitidae), with high mite infestation rates noted in the field (M. Polak, pers. obs.). Gamasodes mites impose dose-dependent negative effects on host fitness traits, including longevity and fecundity (Greene, Reference Greene2010; Cortright, Reference Cortright2012); similar damaging effects on host fitness have been demonstrated for other ectoparasitic mites (Polak, Reference Polak1996, Reference Polak1998; Perez-Leanos et al., Reference Perez-Leanos, Loustalot-Laclette, Nazario-Yepiz and Markow2017; Durkin and Luong, Reference Durkin and Luong2019). Gamasodes mites associated with drosophilid flies have been noted in Taipei City, Taiwan (Mao-Yuan et al., Reference Mao-Yuan, Yi, Guo, Polak and Jin2020), and at different locations in Thailand (M. Polak, pers. obs.), and have been found attacking D. bipectinata, D. melanogaster and other fruit fly species over multiple years at Cape Tribulation, northeastern Queensland, Australia (Halliday et al., Reference Halliday, Walter and Polak2005). Thus, Gamasodes is likely to be a selective force co-occurring with flies over a wide geographic range. The Drosophila–Gamasodes association represents an excellent system to examine the molecular mechanisms underlying fly–mite interactions since previously developed transgenic tools can be used to link specific host genes to mite resistance, and to the expression of potential trade-offs between resistance and other host fitness-related traits.
In the current study, we characterized responses of D. melanogaster to the mite, Gamasodes queenslandicus. As noted above, attachment by G. queenslandicus can damage the expression of major host life-history traits, and is a significant agent of selection in natural fly populations. The aim of the current study, therefore, was to gain a deeper understanding of host genetic and physiological responses to interactions with mites, with the intent of identifying specific host genes and metabolic pathways that may be influenced by mite-mediated selection. During exposure to mites, a fly will deploy a variety of defensive behaviours to avoid contact and infestation by mites, such as a burst of flight, re-directing its path of locomotion, and vigorous grooming once the mite has made contact and grasped onto the fly's tarsus (Polak Reference Polak2003; Greene, Reference Greene2010). We expect that these defensive behaviours are energetically costly to the fly. During infestation, there is often scar development by the host in the form of a melanized patch at the mite-induced wound site (Greene, Reference Greene2010), indicating a marked physiological host response. Thus, we predicted expression levels of host metabolic and immune genes to be altered by both exposure to, and infestation by, mites.
Consistent with our expectation, RNA-seq analysis revealed substantially increased levels of host immune and stress response-related genes. Interestingly, expression levels of genes associated with reproduction were significantly decreased. We compared the RNA-seq results to previously published analyses of fly responses to other parasites (a nematode and parasitoid wasp), and discovered specific genes in common among these systems that may be involved in a general fly response to parasitism. We also conducted physiological assays that showed reduced host lipid and glycogen levels in both exposed and infested flies, which were consistent with patterns of gene expression through RNA-seq we documented. RNA-interference (RNAi) lines confirmed that stress-related genes and those associated with lipid metabolism alter mite burden. Overall, the results further our understanding of host physiological and molecular responses to ectoparasitism, and expand the field of host–parasite evolutionary ecology, in particular, by elucidating the potential targets of ectoparasite-mediated selection.
Materials and methods
Flies and mites
Wild-type Canton S D. melanogaster (FBsn0000274) were used and cultured according to methods described previously (Polak et al., Reference Polak, Simmons, Benoit, Ruohonen, Simpson and Solon-Biet2017). Cultures were density controlled by allowing sexually mature females to lay eggs for 24 h in culture bottles with standard cornmeal-agar food medium. Adult males were harvested from culture bottles as virgins under light CO2 anaesthesia. Males were exposed to G. queenslandicus mites in groups of 20 individuals following established methods (see below). A culture of G. queenslandicus mites was established using mites recovered from the bodies of Drosophila (including D. melanogaster) collected from the exposed flesh of jackfruit Artocarpus heterophyllus (Moraceae) at Cape Tribulation, Australia. A wheat bran-yeast medium with non-parasitic nematodes (as a food source for the mites) was used as the culture media for G. queenslandicus (Luong and Polak, Reference Luong and Polak2007). Both flies and mites were reared in the laboratory on a 12L:12D photoperiod, and a 26 °C day and 22 °C night temperature cycles within environmental chambers.
Mite infestation experiment
Mite infestation was conducted according to methods previously described (Polak, Reference Polak1996, Reference Polak2003). Exposure chambers contained medium with mites, and were constructed so that the space within chambers for fly–mite interactions resembled internal pockets of rotting cactus/fruit where mites and flies co-occur and interact in nature (Polak, Reference Polak2003). Flies were placed within the infestation chambers for ~12 h or until the flies reached ~50% infestation. In these chambers, fly–mite interactions are directly observable, and occur frequently. Flies actively avoid contact with mites, and once a mite has made contact, flies may dislodge the mite by vigorous tarsal flicking and grooming, as described in the Introduction. Following exposure to mites, flies were recovered from the chamber with an aspirator, and immediately anaesthetized with a light stream of humidified CO2. Mites from infested flies were removed with fine forceps, and uninfested (and unscarred) flies were gently touched with the forceps so that they were handled similarly to the infested flies. These subsets of flies, i.e. those that had been infested with mites (‘early infestation’ group) and those that interacted with mites and successfully evaded infestation (‘exposed’ group), were then immediately placed into Trizol (Invitrogen) and stored at −70 °C until RNA extraction. A separate group of infested flies were held in food vials with cornmeal-agar medium for 12 h prior to removing their mites as above, forming the ‘prolonged infestation’ group. ‘Control’ flies were those placed in chambers, as described above, but these chambers contained no mites; thus, these flies were never exposed to mites. Control flies were held in separate food vials for 12 h as the prolonged infestation group, and processed.
RNA extraction
Male flies (20–30 individuals to reduce individual variation) were homogenized in 1 mL of Trizol (Invitrogen) with a BeadBlaster 24 microtube homogenizer (Benchmark Scientific, Edison, NJ, USA). The flies belonged to the control, exposed and prolonged infestation groups with two for the early infestation as one failed the quality control before sequencing. Total RNA was extracted based upon manufacturer's protocol for Trizol. RNA was treated with DNase I (Thermo Fisher Scientific, Waltham, MA, USA) to eliminate DNA contamination. RNA was subsequently cleaned and concentrated with a GeneJET RNA Micro Kit (Thermo Scientific). RNA concentration and quality were determined with a Nanodrop spectrophotometer (Thermo Fisher Scientific).
Poly(A) libraries were prepared to increase enrichment for mRNA with a TruSeq RNA Library Prep Kit (Illumina, San Diego, CA, USA) and sequenced by the DNA Sequencing and Genotyping Core at the Cincinnati Children's Hospital Medical Center (CCHMC). RNA was quantified with the use of a Qubit 3.0 Fluorometer (Life Technologies, Carlsbad, CA) and integrity was determined with an Agilent Bioanalyzer (Santa Clara, CA, USA). All samples had an RNA Integrity Number (RIN) over 7. Total RNA (150–500 ng) was poly(A) selected and reverse transcribed using the TruSeq Stranded mRNA Library Preparation Kit (Illumina). Each sample was fitted with a sample-specific barcode for multiplexing. Following 15 cycles of polymerase chain reaction amplification, completed libraries were sequenced on a HiSeq 2500 sequencing system (Illumina) in Rapid Mode. Approximately 30 million high-quality reads were generated per sample. Raw RNA-seq data were uploaded to the National Center for Biotechnology Information's Sequence Read Archive: Bioproject PRJNA607084.
Expressional analyses
Illumina reads were trimmed for quality with Trimmomatic (Bolger et al., Reference Bolger, Lohse and Usadel2014) to eliminate those with a Phred score below 36 (quality score for the sequencing, maximum of 40) and those with ambiguities. Sequences were trimmed by five nucleotides on the 5′ and 3′ ends. After trimming, any sequences shorter than 40 nucleotides in length were removed and the quality of the resulting sequences was analysed with the FastQC package for quality verification (Wingett and Andrews, Reference Wingett and Andrews2018).
RNA-seq analyses were conducted based on methods developed previously (Hagan et al., Reference Hagan, Didion, Rosselot, Holmes, Siler, Rosendale, Hendershot, Elliot, Jennings, Nine, Perez, Rizlallah, Watanabe, Romick-Rosendale, Xiao, Rasgon and Benoit2018; Rosendale et al., Reference Rosendale, Dunlevy, McCue and Benoit2019). RNA-seq reads were mapped to the D. melanogaster genome (version 6.10) using CLC Genomics Workbench (QIAGEN). Each read was mapped that had at least 50% of the read matching at 90% to annotated genes. Each read was allowed to map to no more than 10 places in the reference genome. Expression values were measured as total counts, which were normalized by the total number of mapped reads and expressed as reads per 1 million. EdgeR was utilized to determine statistical significance of differential expression following a false detection rate of 0.05 (Robinson et al., Reference Robinson, McCarthy and Smyth2010). Specific enriched gene ontology (GO) categories were determined through the use of g:Profiler (Raudvere et al., Reference Raudvere, Kolberg, Kuzmin, Arak, Adler, Peterson and Vilo2019) or with the use of a Fisher's exact test for individual GO categories of interest. To determine potential overlapping factors associated with parasite resistance across different systems, we compared our RNA-seq results to those where fly larvae were infested with a parasitoid wasp (Salazar-Jaramillo et al., Reference Salazar-Jaramillo, Jalvingh, de Haan, Kraaijeveld, Buermans and Wertheim2017) and nematode (Castillo et al., Reference Castillo, Creasy, Kumari, Shetty, Shokal, Tallon and Eleftherianos2015).
As a complementary approach for comparing transcript levels among these host–parasite systems, weighted correlation network analysis, WGCNA (Zhang and Horvath, Reference Zhang and Horvath2005), was used to examine similar patterns of gene expression associated with fly–mite interactions. Transcripts with zero variance were filtered out from the RNA-seq data in preparation for WGCNA. An unsigned network was generated with a calculated soft power, tradeoff between scale-free topology and mean connectivity, of 10 and minimum module size of 20. A comparison between control (no mite exposure), exposed, early infestation and prolonged infestation as input traits was performed for module–trait relationship analysis. The modules exhibiting significant correlation were selected for further analysis to determine function and relationship to trait data. Modules associated with specific states were examined for their associations with specific GO categories as previously described.
RNA interference (RNAi) of genes mediating mite–fly interactions
To assess the role of candidate genes, we used RNAi to suppress the expression of specific genes and then measured the susceptibility of each RNAi line to mites relative to its appropriate control line (see below). Flies with dsRNA that are under upstream-activating sequence (UAS) control (Transgenic RNAi Project, TRiP; Perkins et al., Reference Perkins, Holderbaum, Tao, Hu, Sopko, McCall, Yang-Zhou, Flockhart, Binari, Shim, Miller, Housden, Foos, Randkelv, Kelley, Namgyal, Villalta, Liu, Jiang, Huan-Huan, Wang, Fujiyama, Toyoda, Ayers, Blum, Czech, Neumuller, Yan, Cavallaro, Hibbard, Hall, Cooley, Hannon, Lehmann, Parks, Mohr, Ueda, Kondo, Ni and Perrimon2015) were obtained from the Bloomington Drosophila Stock Center. Experimental lines were generated by females (UAS-dsRNA) crossed to males with the GAL4 expression under the control of the Act5C promoter. Control lines were generated by crosses of males ACT5C-Gal4 with females of the control line with only the attP sites used to generate the GAL4 lines. Ten specific genes were examined based on those identified as critical based on our RNA-seq results. F1 progeny from each line were reared as above.
To measure susceptibility, each experimental RNAi line was exposed to mites together with its control line in a common infestation chamber. The sexes were exposed separately, which were both examined to determine if target genes impact both sexes, flies were anaesthetized with a light stream of humidified CO2 and administered a very small clip (c. 2% or less of wing area) at the tip of their right or left wing (Polak, Reference Polak2003). The treatment (i.e. RNAi or control) receiving a clip was alternated between replicate chambers; there was a total of three replicate chambers per experimental line per sex (i.e. six chambers for each experimental RNAi line). Flies were allowed at least 24 h to recover from CO2 before exposure to mites in chambers. Each chamber contained 40 flies, consisting of 20 experimental and control flies. Flies were gently introduced to chambers using an aspirator, and following ~12 h of exposure or until ~50% infestation level was reached, flies were recovered from the chambers. The identity of flies (i.e. either RNAi or control) was determined by their wing clips, and counts were made of the number of uninfested and infested flies from each chamber. For each group, proportion flies uninfested by mites was calculated. These ‘resistance’ values were arsine-square root transformed prior to analysis (see below). The wing clip itself used in the above assays does not influence susceptibility, which was verified here. In this test, we exposed 40 wild-type Cantons S flies of either sex to mites in chambers as described above. In each chamber, 20 flies were winged clipped and 20 were unclipped controls (controls were treated identically other than not receiving a clip). There were six chambers per sex. Flies were allowed to interact with mites, recovered from chambers as above, and scored for mites. The proportion of flies infested for each group was calculated, and arsine-square root transformed. Analysis of variance (ANOVA) tested for the effects of wing clip and sex on proportion values. The effect of wing clip (F 1,20 = 0.0025, P = 0.960), sex (F 1,20 = 0.496, P = 0.489), and their interaction (F 1,20 = 0.010, P = 0.921), were not significant.
In a first step in the analysis of the RNAi lines, ANOVA on resistance was conducted in which experimental line (1 through 10), treatment (RNAi vs control), sex, and relevant interaction terms were evaluated. Effects of sex (P = 0.973) and the sex × treatment interaction (P = 0.77) were not significant, so these were dropped from the model. By pairing experimental and control lines within chambers, the experiment was specifically designed to test for effects of the suppression of chosen genes on rate of parasitism. Thus, of specific interest in this analysis was the treatment and the treatment × line interaction effects. Since lines were assayed in different chambers, any significant line effect would, in addition to real differences among lines, reflect variation in rate of parasitism owing to differences among chambers in mite density, or other subtle environmental factors that differ among chambers, and is not of interest here.
Because the line × treatment interaction term in the above ANOVA was statistically significant (see the ‘Results’ section), we conducted follow-up analyses to test for differences between RNAi and control flies for each line separately, to ascertain the nature of this interaction. We conducted binary logistic regression for each line, testing for effects of treatment (RNAi vs control) and sex, where infested flies were coded as 0, and uninfested flies as 1. For each term in the models, we report the unstandardized beta weight (B), which represents the logit function of the regression coefficient, a Wald χ 2 statistic and associated P value. An odds ratio for each term with associated 95% confidence interval is also provided.
Nutrient reserve assays
Male flies exposed, but not infested, or following prolonged mite infestation were collected as described above. Five samples of three flies were used for each group. For both groups, protein, glycogen and triglyceride content of flies were measured according to the established methods (Polak et al., Reference Polak, Simmons, Benoit, Ruohonen, Simpson and Solon-Biet2017; Rosendale et al., Reference Rosendale, Dunlevy, McCue and Benoit2019). All mites were removed from infested flies prior to assays. Flies were desiccated by placing flies in a drying oven for 10 days at 60 °C (mass remained constant after 5 days indicating all water was lost) and stored at −20 °C. Three flies per replicate were weighed to the nearest μg, homogenized in 125 μL TET buffer [10 mm Tris (pH 8), 1 mm EDTA, 0.1% Triton X-100] with 1.4-mm ceramic beads (MP Biomedicals) in a Bead Blast 24 (Benchmark Scientific) for five periods of 30 s (no distinct appendages were visibly intact). These homogenized samples were used for protein, triglyceride and glycogen assays. Each sample was vortexed and the sample with split into two aliquots that were frozen at −70 °C until use. One aliquot was used in a Bradford assay (Thermo Scientific) according to the manufacturer's recommended methods. The remaining sample was heat treated (72 °C for 15 min) and frozen at −70 °C for lipid and glycogen analyses. The heated samples were combined with 460 μL of chloroform–methanol (1:2) and centrifuged for 4 min at 5000 rpm (2000 × g) to generate the glycogen precipitate. The glycogen precipitate was air dried and stored at −20 °C. The supernatant was transferred into a glass test tube and utilized for lipid analyses.
For the lipid assay, the supernatant was boiled at 90 °C until a minimal amount of liquid remained. Next, 40 μL of 98% sulphuric acid was added and heated at 90 °C for 2 min. Once cooled, 960 μL of vanillin reagent (600 mg vanillin in 500 mL 85% phosphoric acid) was added, mixed by a pipette, and held at room temperature for 25 min. Absorbance was read at 525 nm on a spectrophotometer, and lipid content was estimated based on lipid standards treated with vanillin reagent (0, 1, 5, 10, 35, 50, 100 and 200 μg of canola oil to establish a standard curve). For the glycogen assay, 975 μL of anthrone reagent (Sigma-Aldrich, St. Louis, MO) was added to the precipitate, vortexed and heated at 90 °C for 20 min. Once cooled, absorbance was read at 625 nm and compared to glucose standards (0, 1, 5, 10, 35, 50, 100, 200 and 400 μg glucose standards). All nutritional indices were normalized to dry weight and displayed in relation to nutritional reserve levels of control flies (no exposure to mites). A t-test was used to compare differences in nutrient levels of exposed and infested to control flies.
Results
Analysis of fly gene expression during mite infestation
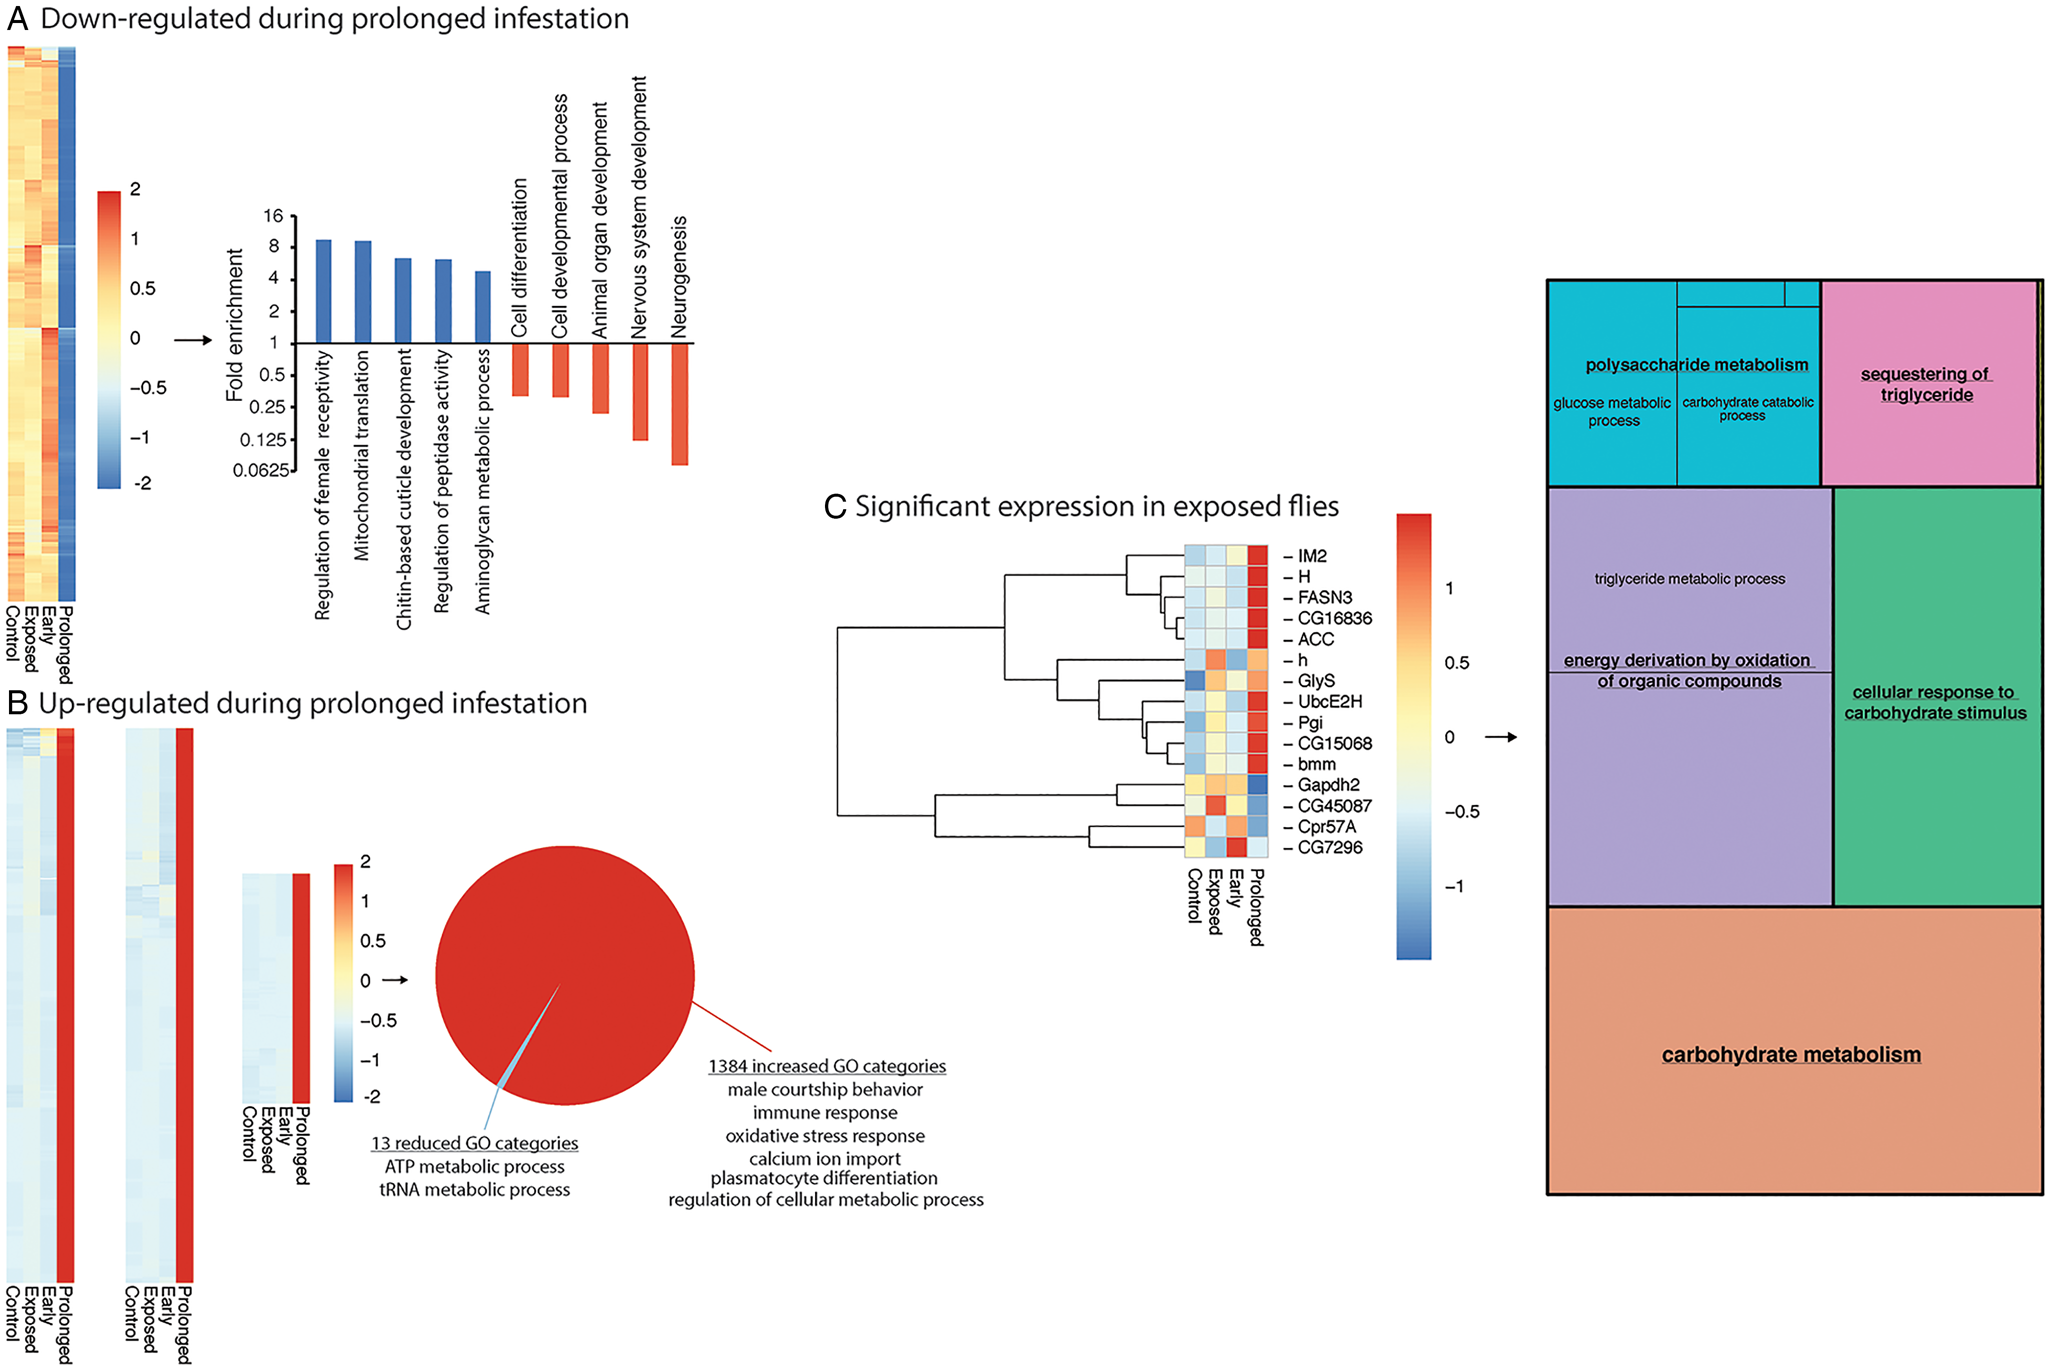
Relative to controls, prolonged infestation triggered the differential expression of over 1300 host genes (Fig. 1A and B; Table S1). For the 396 genes that were suppressed during prolonged infestation, these were associated with female receptivity, cuticle development and aminoglycan metabolism gene ontologies (Fig. 1A). Increased transcript levels during prolonged infestation were associated with immune and stress responses and cellular metabolism (Fig. 1B). Of note, there was increased expression of genes associated with male courtship (Fig. 1B), which interestingly could underlie the increased mating effort previously observed in response to mite infestation demonstrated in another Drosophila species, D. nigrospiracula (Polak and Starmer, Reference Polak and Starmer1998). For the flies exposed but not infested, there were many fewer differentially expressed genes (15 total) compared to control flies, but nevertheless indicating enrichment for factors associated with metabolism, such as carbohydrate metabolism and triglyceride homoeostasis (Fig. 1C, Table S2).
RNA-seq analyses of genes with significant differences in relation to control flies. (A) Heatmap of genes downregulated during prolonged infestation (left) and Gene ontology (GO) categories enriched and under-represented. (B) Heatmap of genes upregulated during prolonged infestation (left) and GO categories enriched and under-represented (categories of specific interest are listed). (C) Heatmap of genes associated with exposure to mites (left), and GO categories that were enriched. Analyses conducted with g:Profiler (Raudvere et al., Reference Raudvere, Kolberg, Kuzmin, Arak, Adler, Peterson and Vilo2019) and Revigo (Supek et al., Reference Supek, Bošnjak, Škunca and Šmuc2011). Sizes of boxes represent relative abundance of each GO category with colours assigned at random. Boxes within the same colour are unlabelled lower level GO terms. Specific details of differentially expressed genes are given in Tables S1 and S2. Gene identifications are based on those available from FlyBase (Thurmond et al., Reference Thurmond, Goodman, Strelets, Attrill, Gramates, Marygold, Matthews, Millburn, Antonazzo, Trovisco and Kaufman2019).

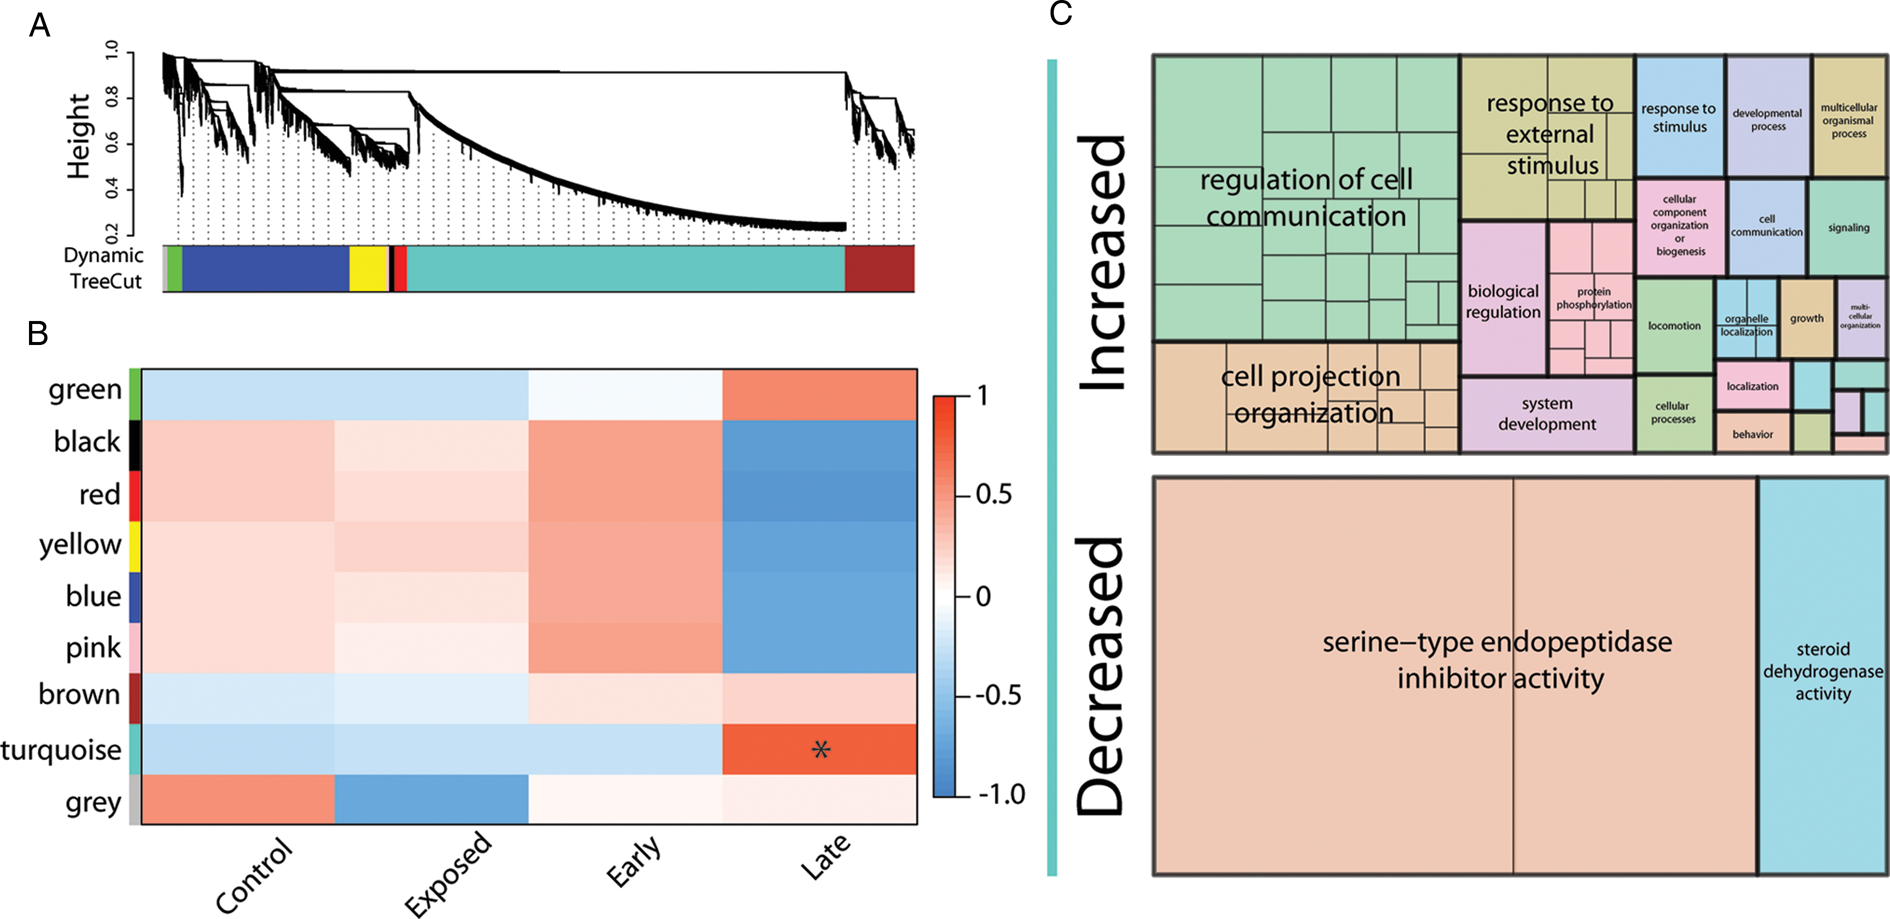
WGCNA to examine correlated expression of genes related to infestation or behavioural resistance. (A) Hierarchical cluster dendrogram of control, early infestation, prolonged infestation and exposed flies to identify specific modules with correlated expression. The lower bar graph represents the specific colours assigned for each module by the Dynamic tree cut methods (‘Grey’ module represents unassigned genes). (B) Specific modules associated with each treatment. * indicates a statistically significant level of correlation between the specific samples and module. (C) GO analysis of genes with increased and decreased expression in the turquoise module associated with prolonged infestation. Analyses were conducted with g:Profiler (Raudvere et al., Reference Raudvere, Kolberg, Kuzmin, Arak, Adler, Peterson and Vilo2019) and Revigo (Supek et al., Reference Supek, Bošnjak, Škunca and Šmuc2011). Sizes of boxes represent relative abundance of each GO category with colours assigned at random. Boxes within the same colour are subsets of the higher level GO term.

Based on the WGCNA results, gene expression was partitioned into eight specific modules (Fig. 2A). There was only a single module that showed a significant relationship to a treatment, which was prolonged infestation (Fig. 2B). Within this module, genes with increased expression were associated with GO categories for the regulation of cell communication, response to external stimulus and cell projection organization, which are hallmarks of the immune and stress response (Fig. 2C). For those genes with decreased expression, there was an association with serine-type endopeptidase inhibitor activity, which is likely associated with mechanisms underlying male fertility (LaFlamme and Wolfner, Reference LaFlamme and Wolfner2013), and steroid dehydrogenase activity that could be linked to a multitude of biological functions ranging from immunity to reproduction and pheromone synthesis (Fig. 2C; Niwa and Niwa, Reference Niwa and Niwa2014; Chiang et al., Reference Chiang, Tan, Chung, Lavrynenko, Shevchenko and Yew2016).
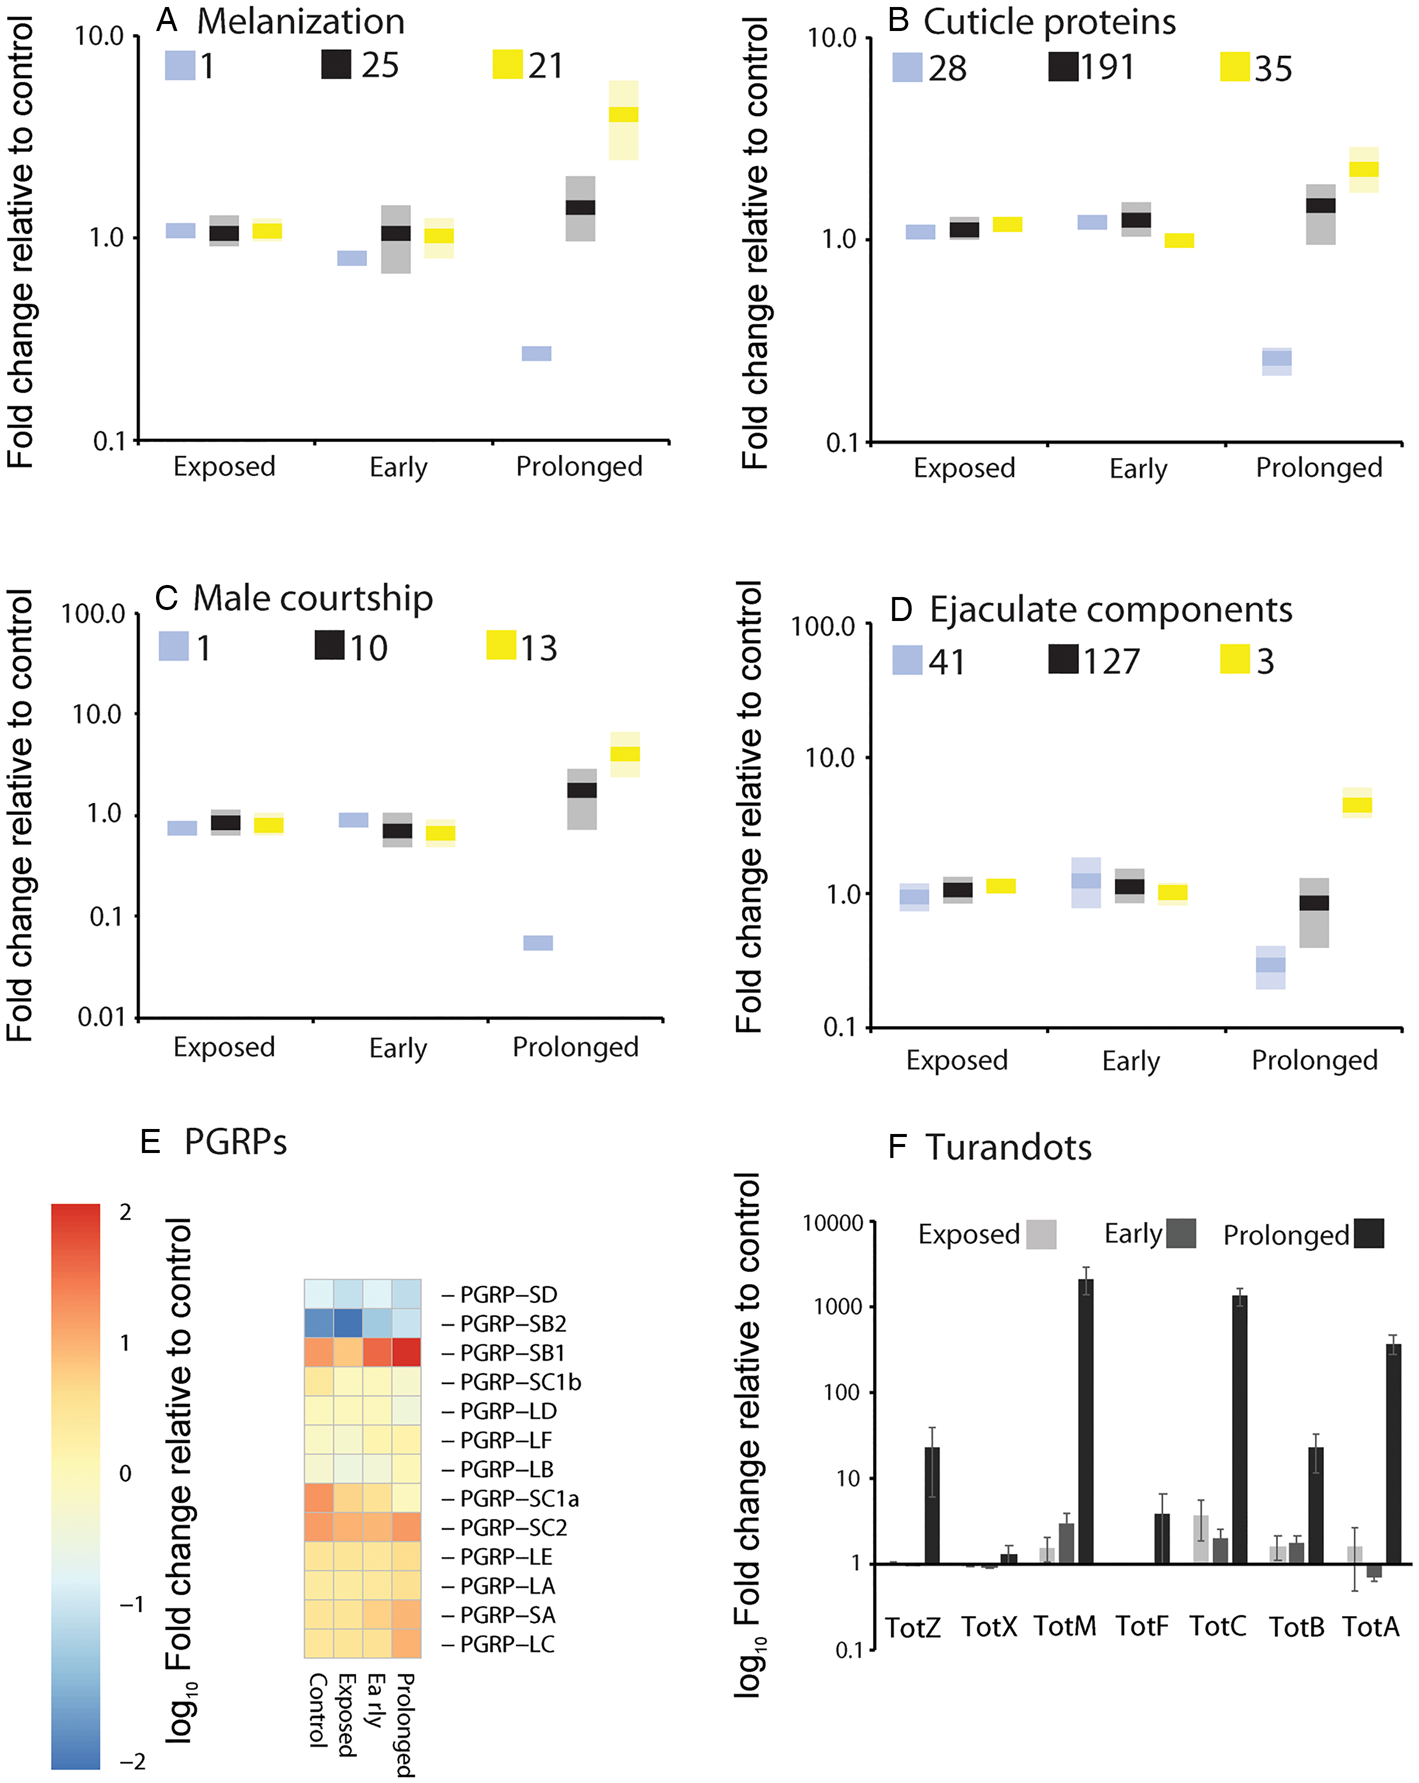
For a more directed approach, we examined specific GO categories related to the cuticle and male courtship and mating (Fig. 3). There was a significant enrichment for genes associated with melanization, but not with other components of the cuticle in the prolonged infestation group (Fig. 3A and B). In relation to reproduction, there was increased enrichment for genes associated with male courtship (Fig. 3C), and, interestingly, a substantial reduction of ejaculate components (Fig. 3D) in the prolonged infestation group. Of the 41 genes associated with ejaculatory components (Fig. 3D), 36 (88%) have noted expression in male accessory glands (Thurmond et al., Reference Thurmond, Goodman, Strelets, Attrill, Gramates, Marygold, Matthews, Millburn, Antonazzo, Trovisco and Kaufman2019). Three peptidoglycan recognition proteins, which are associated with immune function, were significantly increased and one was decreased (Fig. 3E). Lastly, multiple turandots had increased expression levels associated with prolonged mite infestation, where six of the seven were significantly elevated (Fig. 3F).
Specific gene ontogeny categories of interest with altered expression in relation to prolonged mite infestation: (A) melanization, (B) cuticle proteins, (C) male courtship, (D) ejaculate components, (E) peptidoglycan recognition proteins (PGRPs) and (F) turandots. Categories were assigned through Flybase (Thurmond et al., Reference Thurmond, Goodman, Strelets, Attrill, Gramates, Marygold, Matthews, Millburn, Antonazzo, Trovisco and Kaufman2019). All categories show enrichment or reduction compared to expected results for all genes based on a Fisher's exact test. Yellow, statistically significant increase in expression in the prolonged group. Blue, statistically significant decrease in expression in the prolonged group. Black, no difference in expression in the prolonged group. Light shading represents standard error for the mean of genes within each group. Numbersby boxes at top of each plotrepresent the total number of genes increased, decreased or with no difference in expression during prolonged infestation. Groups with less than three genes are displayed individually. Gene identifications are based on those available from FlyBase (Thurmond et al., Reference Thurmond, Goodman, Strelets, Attrill, Gramates, Marygold, Matthews, Millburn, Antonazzo, Trovisco and Kaufman2019).

Comparative gene expression changes during parasite infestation
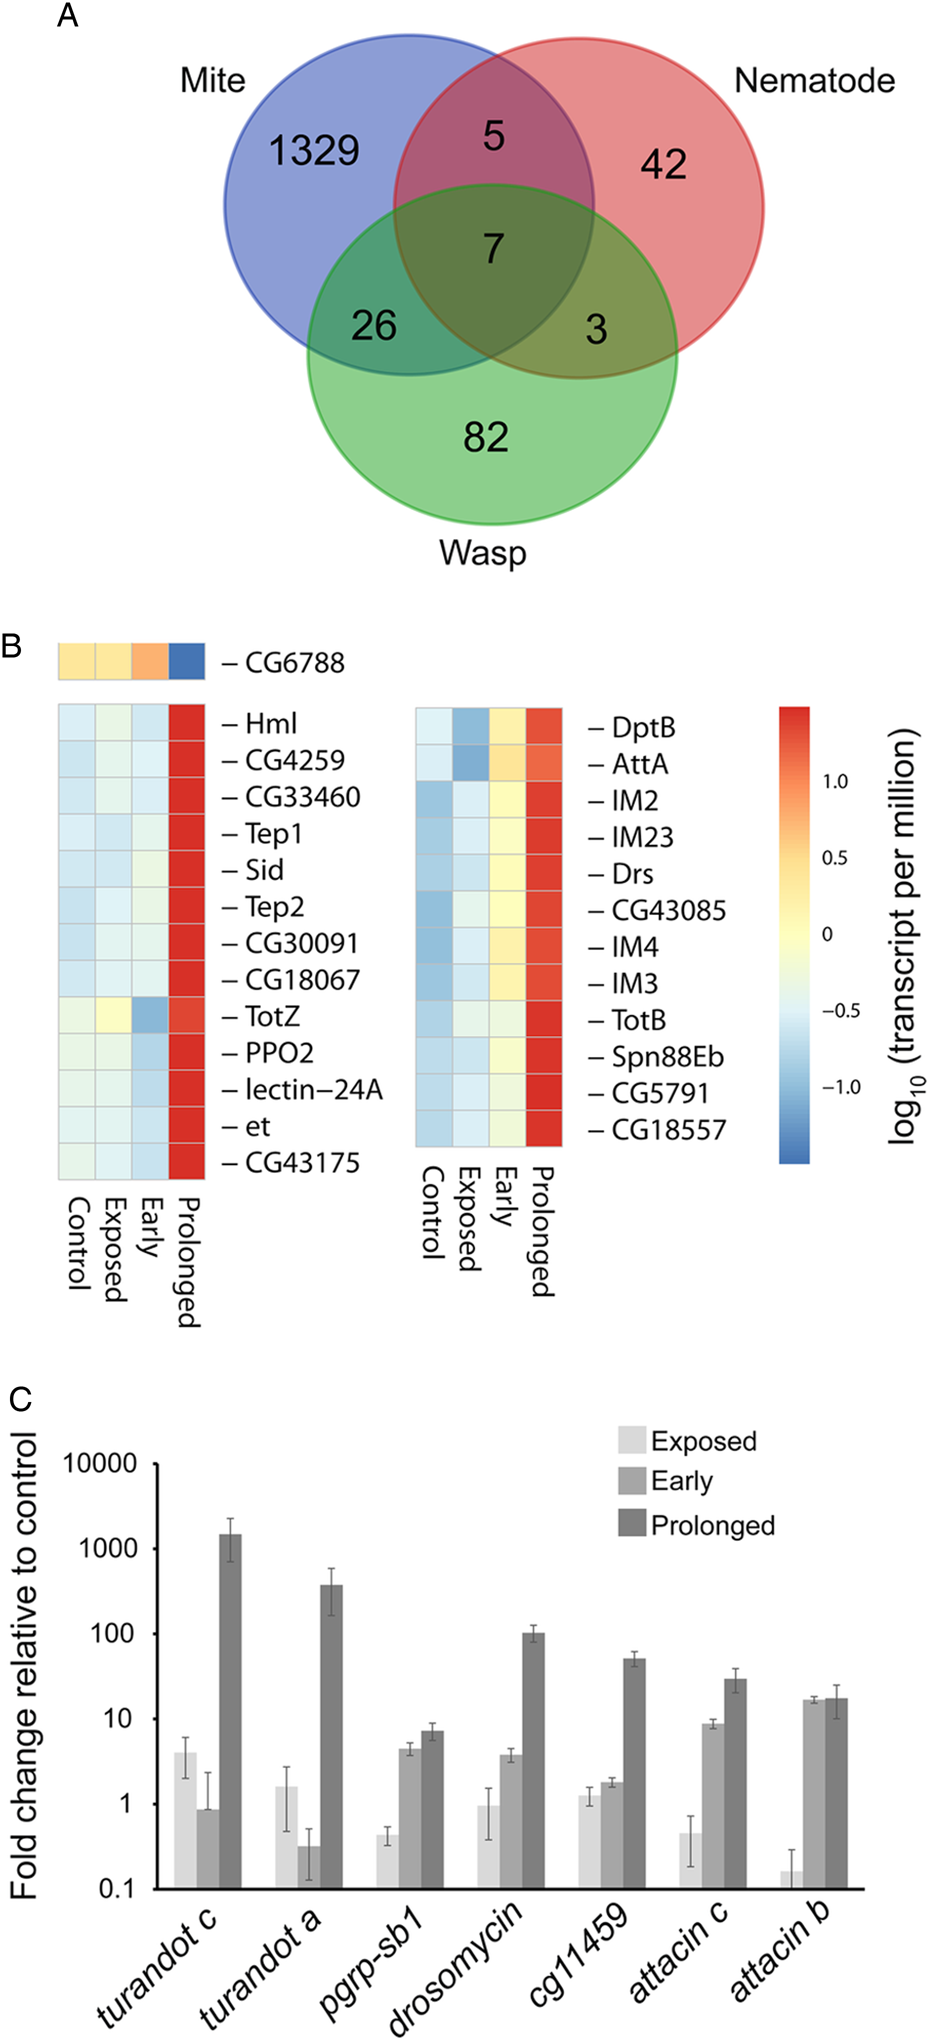
We compared our RNA-seq results to those that previously examined parasitism by a parasitoid wasp, Asobara tabida (Salazar-Jaramillo et al., Reference Salazar-Jaramillo, Jalvingh, de Haan, Kraaijeveld, Buermans and Wertheim2017), and a nematode, Heterorhabditis bacteriophora (Castillo et al., Reference Castillo, Creasy, Kumari, Shetty, Shokal, Tallon and Eleftherianos2015) (Fig. 4). The number of differentially expressed genes during mite infestation was much higher compared to the other two species, which likely reflects parasitism of adults (mites) rather than the larvae (nematode and wasp) (Fig. 4A). There were 26 genes that overlapped during mite and wasp parasitism, which are predominantly associated with immune response and stress tolerance (Fig. 4B). This is supported by enrichment for multiple immune and stress response GO categories, and KEGG pathway analysis showed an enrichment for Toll and Imd signalling pathways. Only a single gene had reduced expression during wasp and mite parasitism, CG6788, which has been characterized as a fibrinogen-like protein. When nematode, mite and wasp parasitism were compared, seven genes were enriched under all three treatments (Fig. 4C). This consisted of two turandots, four immune-associated genes (peptidoglycan recognition proteins-sb1, attacins a and b and drosomycin), and one uncharacterized gene (CG11459). These comparative results indicate that there are likely transcriptional shifts that are generally associated with a response to parasitic attack in D. melanogaster, but substantial variation occurs in the total number and types of differentially expressed genes.
Overlapping expression profiles between D. melanogaster infested with mites, parasitoid wasps and nematodes. (A) Venn diagram for genes with statistically different expression profiles. Seven genes were overlapping between all three treatments. (B, C) Expression profiles of genes that overlap during parasitism by mites, wasps and nematodes in relation to mite, exposure or infestation. RNA-seq results for parasitoid wasps are from Salazar-Jaramillo et al. (Reference Salazar-Jaramillo, Jalvingh, de Haan, Kraaijeveld, Buermans and Wertheim2017) and nematodes from Castillo et al. (Reference Castillo, Creasy, Kumari, Shetty, Shokal, Tallon and Eleftherianos2015). Gene identifications are based on those available from FlyBase (Thurmond et al., Reference Thurmond, Goodman, Strelets, Attrill, Gramates, Marygold, Matthews, Millburn, Antonazzo, Trovisco and Kaufman2019).

Shifted nutritional reserve levels during fly–mite interactions
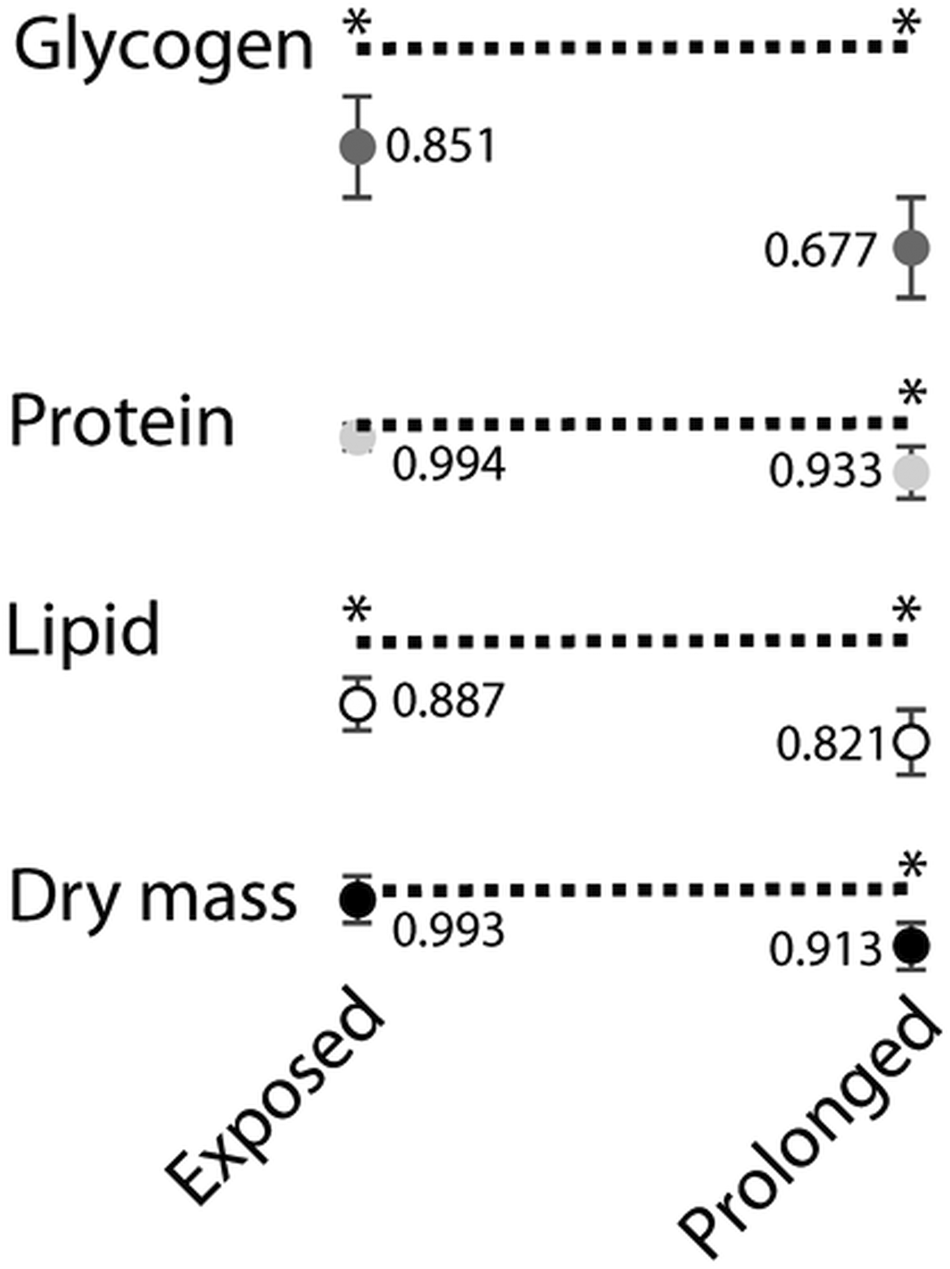
The result that genes associated with nutrient metabolism were altered in flies exposed to mites and infested, suggests that fly–mite interactions are likely to alter nutrient reserve levels. Indeed, flies that were infested for a prolonged duration of time (prolonged infestation treatment) had reduced glycogen (mean ± s.e.μg mg−1 dry mass: 35.9 ± 1.5 control vs 24.3 ± 0.9 prolonged infestation), lipid (73.9 ± 2.8 control vs 60.6 ± 2.7 prolonged infestation) and protein levels (179.2 control ± 3.6 vs 167.3 ± 2.5 prolonged infestation, Fig. 5). This reduction in all nutrient reserves was significant enough to reduce the overall dry mass of the flies in the prolonged infestation group, highlighting the substantial cost associated with mite attachment. Those flies that were exposed and interacted with mites, but that did not become infested, had significant reductions in glycogen (35.9 ± 1.5 control vs 30.6 ± 0.8 exposed) and lipid (73.9 ± 2.8 control vs 65.5 ± 1.9 exposed) levels compared to control flies not exposed to mites (Fig. 5). These results highlight the negative impact that interactions with mites have on the flies, owing at least in part to the expression of behavioural defensive traits, albeit at a much lower level compared to when flies were actually infested.
Nutrient reserve levels for flies infested or exposed (but uninfested) to mites. Each number represents the level of a given nutrient expressed as a proportion of the level in control flies which is denoted by the dashed line. * indicates statistical significance in comparison to control. Each point represents the mean ± s.e. of three groups (five flies per group).

Suppression of specific genes alters fly–mite interactions
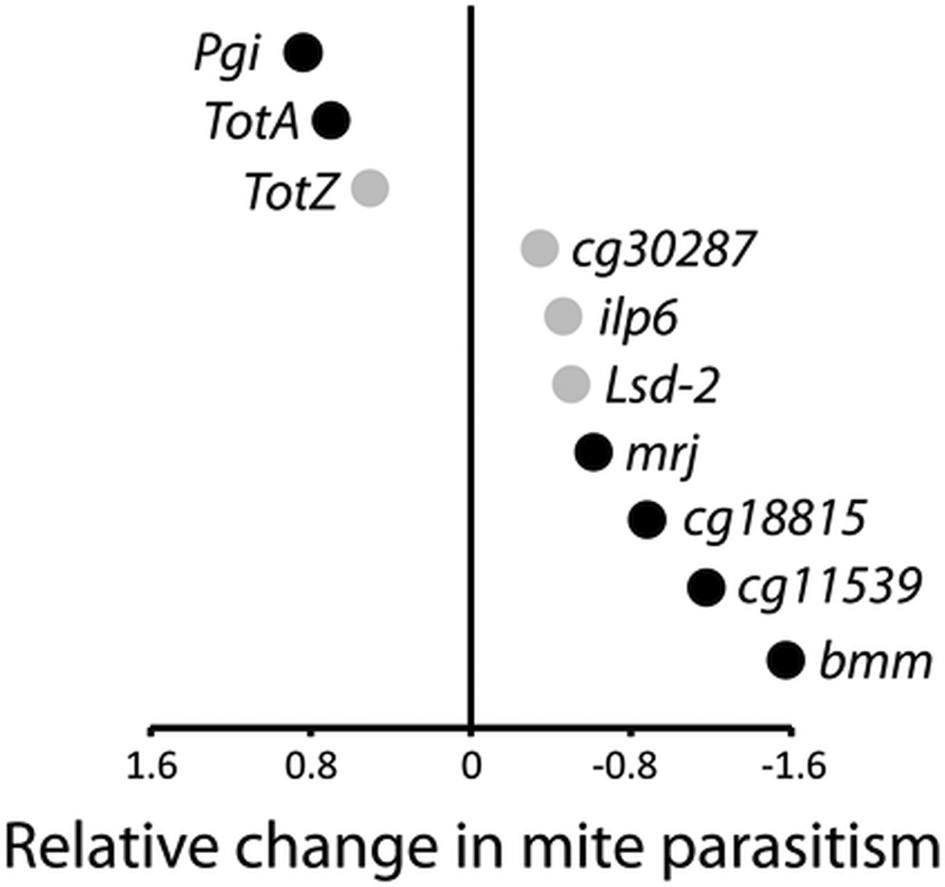
ANOVA on the proportion uninfested flies revealed both a significant RNAi treatment effect (F 1,100 = 6.301, P = 0.014) and RNAi treatment × line interaction (F 9,100 = 3.184, P = 0.002). Flies from the gene suppressed (RNAi) treatment group were overall more uninfested than control flies (Fig. S1A). The significant treatment × line interaction, in turn, indicates that the effect of treatment differed across the lines (Fig. S1B). Therefore, we tested for the treatment effect for each line separately to discover the nature of this interaction. In most cases (seven lines), the RNAi (gene suppressed) treatment produced flies that, when recovered from chambers, were more likely to be uninfested, in other words, to be less likely to acquire mites (Table S3). For example, suppression of bummer lipase (bmm), a gene involved in lipid metabolism, increased the likelihood of evading parasitism (Fig. 6). The suppression of two genes associated with lipid metabolism, lipid storage droplet 2 (lsd2) and insulin-like peptide 6 (ilp6), while not significant, also showed a trend towards increased mite resistance. In contrast, the suppression of three genes resulted in reduced resistance, including two turandots (TotA and TotZ), only one of which had a statistically significant effect, and phosphoglucose isomerase (Pgi) (Fig. 6).
Effects of RNAi of specific genes on parasitism by mites. Values on the x-axis are logistic regression coefficients (see Table S3); negative values indicate that the RNAi line had a lower likelihood of becoming infested than its respective control. Black dots indicate statistically significant contrasts.

Discussion
A main finding of our study is that about 8% of all protein coding genes in the D. melanogaster genome showed significant differential expression during mite attachment. Gene expression changes in relation to infestation were progressive, where prolonged mite attachment increased the total number of differentially expressed genes and the transcript levels of the individual genes relative to exposed and early infested flies. Interestingly, the genes whose expression was reduced during prolonged mite infestation were predominantly associated with male post-copulatory reproduction traits.. This was especially apparent when we examined expression of male accessory gland proteins, where we noted a significant reduction in transcript levels for multiple genes. Pathogen challenge has been previously shown to reduce male fertility, where exposure of male D. melanogaster to either a pathogen or a pathogen mimic (e.g. lipopolysaccharide) reduces sperm viability (Champion de Crespigny and Wedell, Reference Champion de Crespigny and Wedell2006; Radhakrishnan and Fedorka, Reference Radhakrishnan and Fedorka2012). In addition to their effects on sperm use patterns, accessory gland proteins are nown to exert a diversity of biological effects in females (Wolfner, Reference Wolfner2002). Thus, the effects of ectoparasitism on levels of host reproduction-associated traits in both sexes, mediated by accessory gland factors, are likely to be greater in scope than previously recognized.
Interestingly, even though there was this notable reduction in seminal fluid proteins, mite parasitism has been documented in D. nigrospiracula to increase male courtship and mating speed (Polak and Starmer, Reference Polak and Starmer1998). This shift in response to parasitism towards elevated reproductive effort in the form of elevated pre-copulatory courtship is likely to be an adaptation, supported by our observation of increased expression of genes that have independently been shown to be associated with male courtship (Yamamoto and Koganezawa, Reference Yamamoto and Koganezawa2013). This increased courtship could be a form of terminal investment in reproduction (Duffield et al., Reference Duffield, Bowers, Sakaluk and Sadd2017), as mite parasitism is traumatic and life threatening, and could trigger terminal investment even if parasitism can sometimes be overcome.
The immune response during mite infestation was substantial, with many immune factors having hundreds- to a thousand-fold increases during prolonged infestation. This response was much greater, both in number of genes and expression levels, in comparison to RNA-seq studies on parasitoid wasps and nematodes (Castillo et al., Reference Castillo, Creasy, Kumari, Shetty, Shokal, Tallon and Eleftherianos2015; Salazar-Jaramillo et al., Reference Salazar-Jaramillo, Jalvingh, de Haan, Kraaijeveld, Buermans and Wertheim2017). This increased response is likely due to life stage differences of the host since the mites infest adults which have much more diverse expression, including factors associated with reproduction (Brown et al., Reference Brown, Boley, Eisman, May, Stoiber, Duff, Booth, Wen, Park, Suzuki, Wan, Yu, Zhang, Carlson, Cherbas, Eads, Miller, Mockaitis, Roberts, Davis, Frise, Hammonds, Olson, Shenker, Sturgill, Samsonova, Weiszmann, Robinson, Hernandez, Andrews, Bickel, Carninci, Cherbas, Gingeras, Hoskins, Kaufman, Lai, Oliver, Perrimon, Graveley and Celniker2014; Leader et al., Reference Leader, Krause, Pandit, Davies and Dow2018). The genes that we found to be increased are mainly associated with immune challenge and the stress response, which includes the expression of many antimicrobial peptides and turandots. Turandots are stress-induced humoral factors that are increased in many responses that range across nearly all abiotic and biotic stresses (Ekengren and Hultmark, Reference Ekengren and Hultmark2001; Ekengren et al., Reference Ekengren, Tryselius, Dushay, Liu, Steiner and Hultmark2001; Zhong et al., Reference Zhong, McClure, Evans, Mlynski, Immonen, Ritchie and Priest2013). During mite infestation, all the turandot genes were increased in expression from 30- to 2500-fold. This is not surprising as mite attachment is likely to cause significant mechanical damage to host integument (Halliday et al., Reference Halliday, Walter and Polak2005), and potentially the entry of factors salivated by the mites or of micro-organisms (Jaenike et al., Reference Jaenike, Polak, Fiskin, Helou and Minhas2007).
By comparing responses to challenge from wasps, nematodes and mites, we identified specific genes that respond to all three parasite/parasitoid pressures. These genes may be strongly pleiotropic and their evolution influenced by selection imposed by very different parasites. When only the wasp and mite were compared, there were increased transcript levels for multiple immune induced molecules (IM2, IM3, IM4 and IM24) and other immune and stress factors. Factors associated with haematopoiesis, melanization and encapsulation (haemolectin, prophenoloxidase and eye transformer) are in common between wasp and mite response, which is not surprising since in both cases the fly host responds with rapid encapsulation and melanization to prevent continual damage from the wasp or mite.
When the wasp and mite were compared to nematode infection, there were only seven genes that were significantly enriched in common, namely turandot A and C, attacins c and b and drosomycin, highlighting the likely importance of these factors in response to biotic stress caused by parasitic organisms (Castillo et al., Reference Castillo, Creasy, Kumari, Shetty, Shokal, Tallon and Eleftherianos2015; Salazar-Jaramillo et al., Reference Salazar-Jaramillo, Jalvingh, de Haan, Kraaijeveld, Buermans and Wertheim2017). A single recognition protein, pgrp-sb, was increased in response to invasion by all three parasites, suggesting that this protein is likely critical for Drosophila to respond to parasite challenge. Lastly, a single uncharacterized gene (CG11459) was increased during exposure to the parasites. This gene codes for a cysteine cathepsin, which likely acts as a lysosomal peptidase during the immune response (Brix et al., Reference Brix, Dunkhorst, Mayer and Jordans2008), but the specific role of this protein is unknown in relation to parasite invasion. These comparative RNA-seq results identify key general mechanisms that may underlie the Drosophila response to natural enemies.
We also found an increase in expression of metabolic genes in response to exposure and attachment, with some overlap with those noted when larval stages are parasitized by wasps (Schlenke et al., Reference Schlenke, Morales, Govind and Clark2007; Lynch et al., Reference Lynch, Schlenke and de Roode2016). We noted both increases and decreases in multiple genes associated with metabolism, which prompted our nutrient reserve assays. Mite infestation resulted in a substantial reduction in glycogen, protein and lipid reserve levels. These reductions in nutrient reserves likely contribute to observed reductions in male mating success, egg number, testes condition and dry body mass (Polak and Markow, Reference Polak and Markow1995; Polak, Reference Polak1996, Reference Polak1998). The combined effects of host response and mite feeding are likely the major physiological costs to the fly that underlie observed nutrient reserve deficits.
Along with the host response due to infestation per se, we also examined transcriptional changes underlying flies exposed to mite that failed to be infested (i.e. that expressed behavioural resistance, which is a known heritable trait, see Polak, Reference Polak2003; Luong and Polak, Reference Luong and Polak2007). For these flies, there were increased expression levels for genes associated with carbohydrate and lipid metabolism, which likely underlie the observed reductions of glycogen and lipid levels in exposed compared to control flies. Even though lipid and glycogen levels were reduced in exposed flies, only a slight reduction, albeit not significant, in dry mass was also noted. Flies deploy a suite of defensive behaviours against mites, in the form of reflex motions, vigorous grooming and bursts of flight (Polak, Reference Polak2003; Greene, Reference Greene2010), which are energetically expensive (e.g. Harrison and Roberts, Reference Harrison and Roberts2000). Moreover, a previous study that examined respiration rates during mite exposure indicated that respiration was increased (Luong et al., Reference Luong, Horn and Brophy2017), which also requires energy utilization. These different host responses to mites together likely contribute to the decline in lipid, glycogen and protein reserves noted in our study. These multiple lines of evidence confirm that the behavioural and physiological responses of flies to ectoparasitic mites are energetically costly, depleting a significant portion of nutrient reserve levels. Such costs of resistance are evolutionary relevant, as they are expected to counter the evolution of resistance traits when parasites are absent, and serve to maintain genetic polymorphisms at resistance loci within populations (Mitchell-Olds and Bradley, Reference Mitchell-Olds and Bradley1996).
Our RNA interference studies revealed that individual suppression of different genes influenced rates of mite infestation, although not always as predicted. Importantly, since mite infestation is dictated by both the preference of the mite for the fly and the ability of the fly to counter mite parasitism by behavioural resistance, suppression of specific genes by RNAi could impact both the flies ability to resist mites and the mites' preference for the host (Polak, Reference Polak1998; Luong and Polak, Reference Luong and Polak2007; Perez-Leanos et al., Reference Perez-Leanos, Loustalot-Laclette, Nazario-Yepiz and Markow2017). Suppression of two genes significantly decreased resistance to mites (Pgi and TotA), which is partially consistent with our finding that expression of Pgi was elevated in flies exposed to, but not infested by, mites. PGI activity is a key factor in metabolic rates for Drosophila (Montooth et al., Reference Montooth, Marden and Clark2003), and has been associated with aspects related to organismal fitness and performance in other insects (Wheat and Hill, Reference Wheat and Hill2014). Our results suggest that PGI is likely a critical factor underlying fly–mite dynamics. The specific mechanism could be related to specific host defensive behaviours, such as increased micro-bursts of flight or general movement (Wheat and Hill, Reference Wheat and Hill2014), but additional studies will be necessary to confirm the role of this gene in mediating the fly–mite behavioural interface.
In sum, this study characterizes the underlying molecular mechanisms associated with fly–mite interactions, identifying previously unknown potential targets of ectoparasite-mediated selection. The results contribute to filling an important gap in our understanding of the molecular mechanisms underpinning biotic interactions and those that can be associated with ecologically relevant trade-offs (Roff, Reference Roff, Flatt and Heyland2011). The substantial response of flies to mite parasitism highlights that parasitism is costly, which does indeed result in a substantial loss of nutrient reserves. These costs generate selection favouring improved behavioural resistance, but flies that successfully evade infestation show increased transcript levels of genes associated with carbohydrate and lipid metabolism. This upregulation yields a reduction in specific nutrient reserves, albeit not to the same level as attachment per se, highlighting that infestation is much more energetically costly than behavioural avoidance. The responses by the host both pre- and post-infestation we have documented identify factors that could underlie the evolution of ectoparasite resistance and trade-offs in this model organism.
Supplementary material
The supplementary material for this article can be found at https://doi.org/10.1017/S0031182020000918.
Author contributions
JBB and MP designed research, performed research, analysed data and obtained funding for this project. Differential RNA expression analyses were performed by STB and JBB. JB performed the mite infestation studies and subsequent analysis of results. JBB, JB, STB and MP wrote and organized the manuscript. All authors read and approved the final manuscript.
Financial support
This work was supported by the University of Cincinnati Faculty Development Research Grant to JBB. Funding was also provided to MP and JBB by the National Science Foundation DEB-1654417.
Conflict of interest
None.
Ethical standards
Not applicable.