A brief overview
An earlier generation of fish ecologists focused on physical–biological interactions and their relationship to the abundance and distribution of Antarctic fish. Prominent studies advanced a diverse array of innovative hypotheses. These included the various roles of fronts, for instance in structuring feeding and forming biological barriers (e.g. Loeb et al.
Reference Loeb, Kellermann, Koubbi, North and White1993), currents as transport pathways facilitating immigration and emigration (e.g. Kellermann Reference Kellermann1986), the wind field in structuring life history habitat over the continental shelf (e.g. Hubold Reference Hubold1984) and retention systems in mitigating advection mortality (e.g. White Reference White1998). Nevertheless, the hypotheses were difficult to test with the empirical and analytic tools available at the time. With the advent of commercially valuable fisheries, research focus shifted to supporting the conservation and management of targeted species, in particular identifying population structure and parameterizing stock assessment models.
It is important to note that the shift was not the result of a systematic attempt to test and disprove the earlier hypotheses. Evidence has continued to accumulate for other species, most notably in the transport and life history habitat of krill (e.g. Hofmann et al. Reference Hofmann, Klinck, Locarnini, Fach and Murphy1998, Fach & Klinck Reference Fach and Klinck2006, Piñones et al.
Reference Piñones, Hofmann, Dinniman and Klinck2011). Methodology has advanced as well; the increasingly sophisticated toolbox that Antarctic scientists can call on today includes predictive models and vessels capable of sampling in heavy ice conditions. Moreover, theoretical advances in our understanding of the physical system around the Southern Ocean (e.g. GLOBEC, ANSLOPE, RAISED) have coincided with the development of simulation techniques that can predict the transport of particles over a range of spatial and temporal scales (e.g. Fach & Klinck Reference Fach and Klinck2006, Piñones et al.
Reference Piñones, Hofmann, Dinniman and Klinck2011, Renner et al.
Reference Renner, Thorpe, Heywood, Murphy, Watkins and Meredith2012). Separately, increased commercial fishing has led to growing research activity in support of the Commission for the Conservation of Marine Living Resources (CCAMLR) and interest in spatial and ecosystem perspectives for managing exploited marine populations.
These developments have not been overlooked by Antarctic fish population scientists. In Pleuragrammatinae, the neutrally buoyant clade of notothenioids, empirical studies suggested an important role for the Antarctic Circumpolar Current in structuring populations of Patagonian toothfish Dissostichus eleginoides Smitt (e.g. Shaw et al.
Reference Shaw, Arkhipkin and Al-Khairulla2004, Ashford et al.
Reference Ashford, Arkhipkin and Jones2006, Reference Ashford, Jones, Hofmann, Everson, Moreno, Duhamel and Williams2008). Hanchet et al. (Reference Hanchet, Rickard, Fenaughty, Dunn and Williams2008) used particle simulations and evidence from conventional fisheries techniques to propose a life history hypothesis for Antarctic toothfish (Dissostichus mawsoni Norman) in the Ross Sea, in which advection during early life was linked to the Ross Gyre. Their hypothesis successfully withstood testing using age distributions validated by lead–radium dating (Brooks et al.
Reference Brooks, Andrews, Ashford, Ramanna, Jones, Lundstrom and Cailliet2011), environmental exposures inferred from otolith chemistry and a shelf circulation model (Ashford et al.
Reference Ashford, Dinniman, Brooks, Andrews, Hofmann, Cailliet, Jones and Ramanna2012). Near et al. (Reference Near, Russo, Jones and DeVries2003) demonstrated an ontogenetic shift to neutral buoyancy at maturity and Ashford et al. (Reference Ashford, Dinniman, Brooks, Andrews, Hofmann, Cailliet, Jones and Ramanna2012) suggested that this facilitated life history movement of D. mawsoni along deep transport pathways. Principally, recently mature fish move from juvenile feeding grounds on the shelf via trough outflows into the South-east Pacific Basin, and adults move subsequently along the Ross Gyre between spawning areas on the Pacific–Antarctic Ridge and feeding grounds on the continental slope. In Antarctic silverfish (Pleuragramma antarctica Boulenger), another species in the Pleuragrammatinae on which D. mawsoni feeds, La Mesa et al. (Reference La Mesa, Catalano, Russo, Greco, Vacchi and Azzali2010) found that environmental conditions influenced the distribution and abundance of larval stages in the Ross Sea. A series of multi-disciplinary studies indicated substantial genetic flow around the Antarctic continent (Zane et al.
Reference Zane, Marcato, Bargelloni, Bortolotto, Papetti, Simonato, Varotto and Patarnello2006, Agostini et al.
Reference Agostini, Patarnello, Ashford, Torres, Zane and Papetti2015) and population structuring linked to currents along the coast and continental slope of the Antarctic Peninsula (Ferguson Reference Ferguson2012, La Mesa et al.
Reference La Mesa, Riginella, Mazzoldi and Ashford2014, Reference La Mesa, Piñones, Catalano and Ashford2015, Parker et al.
Reference Parker, Fraser, Ashford, Patarnello, Zane and Torres2015). In a population review, Ashford et al. (Reference Ashford, Zane, Torres, La Mesa and Simms2017) outlined how physical–biological interactions between glacial trough systems, circulation and life history processes could structure the extensive distributions of P. antarctica observed along and across the continental shelf (e.g. La Mesa & Eastman Reference La Mesa and Eastman2012).
It is in this context that we respond to recent debate over the life history and ecology of D. mawsoni. We commend engagement beyond management working groups at CCAMLR and into the wider, peer-reviewed literature as a productive and welcome development. One strand of the wider discussion has focused on a decline observed in large, neutrally buoyant toothfish documented in McMurdo Sound (Fig. 1) after 2000 and attributed to commercial activity in the Ross Sea from 1997 onwards (Ainley et al.
Reference Ainley, Nur, Eastman, Ballard, Parkinson, Evans and DeVries2013, Reference Ainley, Ballard, Eastman, Evans, Nur and Parkinson2017, Parker et al.
Reference Parker, Mormede, DeVries, Hanchet and Eisert2016). Another has centred around a recent comprehensive review of Antarctic toothfish biology (Hanchet et al.
Reference Hanchet, Dunn, Parker, Horn, Stevens and Mormede2015, Reference Hanchet, Dunn, Parker, Horn, Stevens and Mormede2016 Ainley et al.
Reference Ainley, Eastman and Brooks2016) that also referred to the decline in McMurdo Sound. We note that in both cases, the discussion reflected very different perspectives, between scientists working on fishery-related issues in the Ross Sea and others out of McMurdo Sound representing broader concerns, notably with predator–prey relationships. We also recognize the wealth of cross-disciplinary expertise brought to bear and the considerable advances achieved, as well as developing points of convergence. However, physical and spatial structuring is a critical component of the system, and further attention to these aspects may help resolve some of the issues raised. In this article, therefore, we consider the debate concerning abundance and distribution of large D. mawsoni near McMurdo Sound in light of their life history and the shelf circulation. We build on insights about vertical distributions afforded by neutral buoyancy that were highlighted in the earlier discussion, suggest circulatory mechanisms that may be involved and propose improvements in the monitoring programme that can help test between the competing hypotheses.
Fig. 1a
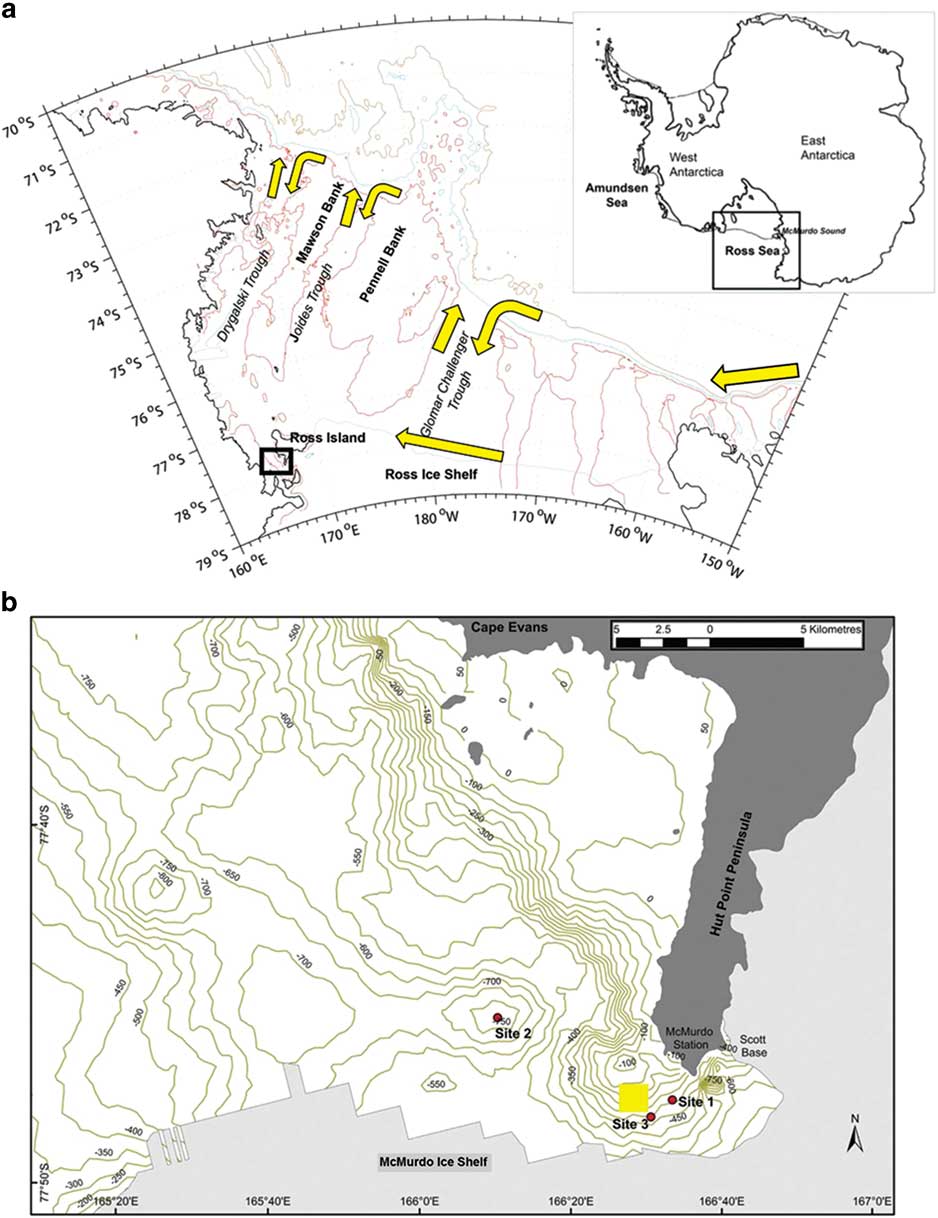
Map of the Ross Sea adapted from Ashford et al. (Reference Ashford, Dinniman, Brooks, Andrews, Hofmann, Cailliet, Jones and Ramanna2012), with a schematic of the circulation (yellow arrows) showing main flows along the continental slope and Ross Ice Shelf and along troughs located north–south across the shelf. b. Detailed map of McMurdo Sound modified from Parker et al. (Reference Parker, Mormede, DeVries, Hanchet and Eisert2016, fig. 2), showing their sampling sites (red circles) compared to the main area sampled in the time series (yellow square) taken from Ainley et al. (Reference Ainley, Ballard, Eastman, Evans, Nur and Parkinson2017, fig. 1).
Review of evidence: physical structuring and sampling
Summary of prior discussion
The decline in large, neutrally buoyant toothfish observed in McMurdo Sound after 2000 (Ainley et al.
Reference Ainley, Nur, Eastman, Ballard, Parkinson, Evans and DeVries2013) was based on a 40 year time series that sampled through a hole cut in sea ice using baited hooks on a longline. As part of a monitoring programme to address the issues raised by Ainley et al. (Reference Ainley, Nur, Eastman, Ballard, Parkinson, Evans and DeVries2013), a similar configuration was used by Parker et al. (Reference Parker, Mormede, DeVries, Hanchet and Eisert2016) during 2014 at three sampling sites in the same vicinity (Fig. 1). No fish were caught at a single site (site 1 in Fig. 1) that was shallower than used during the time series. At the other two sites, deeper than used during the time series, the catch-rate was similar to before the decline. Rather than commercial activity, Parker et al. (Reference Parker, Mormede, DeVries, Hanchet and Eisert2016) suggested the observations by Ainley et al. (Reference Ainley, Nur, Eastman, Ballard, Parkinson, Evans and DeVries2013) were the result of detection issues related to depth or temporary absence influenced by the grounding of two large icebergs off Ross Island.
In response, Ainley et al. (Reference Ainley, Ballard, Eastman, Evans, Nur and Parkinson2017) emphasized the importance of neutral buoyancy and interactions with diving predators and P. antarctica in structuring the vertical distribution of large D. mawsoni in the water column. They suggested this resulted in a ‘cloud’ that extended up from the bottom and, even over depths of >500 m, reached near the surface at times. However, the cloud no longer extends above depths of 500 m in McMurdo Sound, and selective removal of large fish by the fishery would explain reduced numbers of neutrally buoyant individuals capable of moving throughout the water column. Rather than mega-icebergs, the authors hypothesized that predator effects, including fishing, have depressed the cloud below the diving range of many species and contributed to spatial mismatches with vertical distributions of P. antarctica.
As a result, the discussion highlighted the importance of variation in spatial distributions over time and the relationship to depth. There was also agreement over continued monitoring using a spatially stratified, standardized approach. While the exchange raised a number of useful points, we note that the hypotheses suggested to explain the decline observed by Ainley et al. (Reference Ainley, Nur, Eastman, Ballard, Parkinson, Evans and DeVries2013) included very little consideration of major circulation features over the shelf. We agree that fishery removals, fishing and predator avoidance by movement to depth and the unusual presence of mega-icebergs are potential explanations worth testing in future monitoring. However, transport pathways may also contribute to the variation observed.
Physical structuring
Large toothfish are typically caught by benthic longline between 1000–1600 m along the continental slope of the Ross Sea (Hanchet et al.
Reference Hanchet, Dunn, Parker, Horn, Stevens and Mormede2016), where the Antarctic Slope Current and Front system (ASF) flows westward (Fig. 1) carrying warm Circumpolar Deep Water (CDW) in its intermediate depths (e.g. Dinniman et al.
Reference Dinniman, Klinck and Smith2003, Orsi & Wiederwohl Reference Orsi and Wiederwohl2009). Variable but persistent intrusions of warm CDW are initially driven from the slope onto the Ross Sea shelf by momentum advection resulting from changes in the curvature of the shelf break (Dinniman et al.
Reference Dinniman, Klinck and Smith2003), by eddies along the ASF (Stewart & Thompson Reference Stewart and Thompson2015) and by tides (Wang et al.
Reference Wang, Danilov, Hellmer, Sidorenko, Schröter and Jung2013). The shelf is characterized by trough systems that are oriented north–south and connect the shelf break to the inner shelf. The cross-shelf circulation is generally bathymetrically controlled and the CDW, mixing with adjacent waters to form modified CDW (MCDW), is carried along the eastern side of the troughs (Dinniman et al.
Reference Dinniman, Klinck and Smith2003, Orsi &Wiederwohl Reference Orsi and Wiederwohl2009, Kohut et al.
Reference Kohut, Hunter and Huber2013). The intrusions are generally fast-flowing, with velocities of 0.3 m s-1 found along the western side of the Mawson and Pennell banks (Kohut et al.
Reference Kohut, Hunter and Huber2013). However, their core is shallow relative to the depths at which most large fish are taken commercially. Deeper shelf water forms outflows that sink down the slope in gravity currents that make counter-current swimming ineffective in the benthic layer (Ashford et al.
Reference Ashford, Dinniman, Brooks, Andrews, Hofmann, Cailliet, Jones and Ramanna2012).
The vertical cloud suggested by Ainley et al. (Reference Ainley, Ballard, Eastman, Evans, Nur and Parkinson2017) helps resolve this paradox. Simulation techniques can predict the transport of particles, based on circulation models like the high-resolution version of the Regional Ocean Modelling System used by Ashford et al. (Reference Ashford, Dinniman, Brooks, Andrews, Hofmann, Cailliet, Jones and Ramanna2012). If large fish move high in the water column, particles released from shallower depths can provide insight into the change in transport pathways they would encounter. Simulations of particles released across the slope indicated that a proportion consistently reached the inner shelf of the south-western Ross Sea and Glomar Challenger Basin: 8–12% released from depths of 300 m and 9–19% from 100 m (Ashford et al.
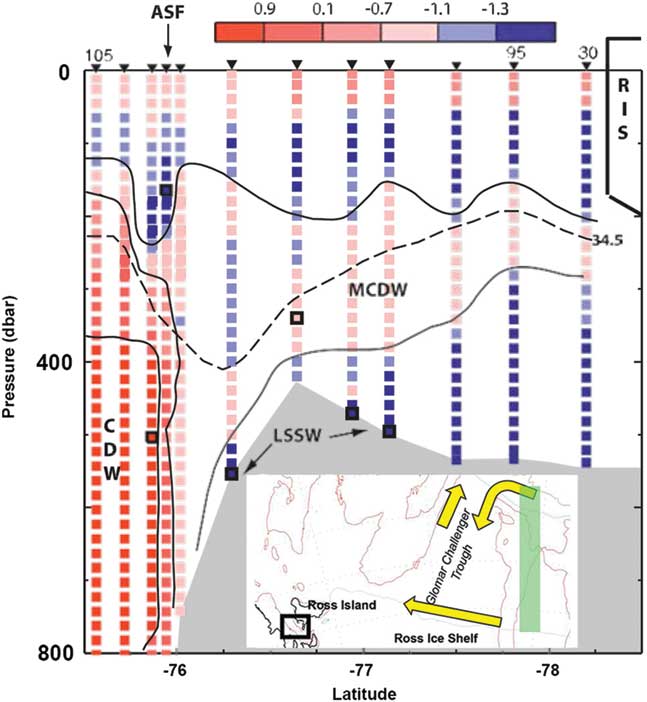
Reference Ashford, Dinniman, Brooks, Andrews, Hofmann, Cailliet, Jones and Ramanna2012, table 5). Thus, the extent and frequency of the intrusions containing MCDW that penetrate into the Glomar Challenger trough may contribute to a mechanistic explanation for the historic abundance and distribution of larger toothfish near McMurdo Sound. Poleward inflow forms a tongue of MCDW that occupies the intermediate layer along the eastern side of the trough (Fig. 2). In front of the Ross Ice Shelf (RIS) at 173°W, it forms a layer 150 m thick below a depth of 200 m (Orsi & Wiederwohl Reference Orsi and Wiederwohl2009). Flow along the ice shelf is generally westward (e.g. Jacobs et al.
Reference Jacobs, Amos and Bruchhausen1970). Along its western half, Antarctic Surface Water (AASW) is found to a depth of 225 m (Orsi & Wiederwohl Reference Orsi and Wiederwohl2009). Below this, a layer of MCDW occurs to Ross Island, thinning considerably to a thickness of c. 50–75 m (Orsi & Wiederwohl Reference Orsi and Wiederwohl2009). Nutrient transport in CDW in the intrusions is probably important for biological production (McGillicuddy et al.
Reference McGillicuddy, Sedwick, Dinniman, Arrigo, Bibby, Greenan, Hofmann, Klinck, Smith, Mack, Marsay, Sohst and van Dijken2015), particularly where it mixes with iron-rich sources from suspension and meltwater. If transport and production are correlated, active feeding is likely to reinforce movement of toothfish entrained in the intrusions across the shelf.
Fig. 2
North–south temperature section from the continental slope to Ross Ice Shelf (RIS; study area shown in inset as green rectangle), modified from Jacobs & Giulivi (Reference Jacobs and Giulivi2010, fig. 10; used with permission from the American Meteorological Society), showing intruding modified Circumpolar Deep Water (MCDW) in relation to depth. ASF=Antarctic Slope Current and Front system, LSSW=Low Salinity Shelf Water.
By corollary, depression of the cloud can help explain the decline observed by Ainley et al. (Reference Ainley, Nur, Eastman, Ballard, Parkinson, Evans and DeVries2013), as fish along the slope become less exposed to water upwelling on to the shelf. The proportion of simulated particles reaching shelf areas dropped considerably with increasing depth of release over the slope (Ashford et al.
Reference Ashford, Dinniman, Brooks, Andrews, Hofmann, Cailliet, Jones and Ramanna2012). The percentage reaching the Glomar Challenger trough halved to 9–10% between a release depth of 100 m in the surface layer and those at 500 m and 1000 m. The reduction was even more marked, from 9% to 3%, for particles reaching further west into the basin north of Ross Island. Increasing depth of the cloud may also facilitate off-shelf movement through greater exposure to outflowing shelf water. Thus, 48% of simulated particles released in the benthic layer near Ross Island reached the northern Ross Sea continental slope and the western boundary of the model domain, compared to 36% released at 100 m.
Moreover, physical structuring can help explain the association with iceberg activity noted by Parker et al. (Reference Parker, Mormede, DeVries, Hanchet and Eisert2016). Six massive tabular icebergs calved off the RIS between 2000 and 2002. A portion of B-15 (B-15a) and B-16 drifted north of Ross Island in 2001, where they remained until 2005 and 2006 oriented north–south from the edge of the RIS (MacAyeal et al.
Reference MacAyeal, Okal, Thom, Brunt, Kim and Bliss2008, fig. 1). Tabular icebergs calving off the RIS generally have a thickness of 250 m (MacAyeal et al.
Reference MacAyeal, Okal, Thom, Brunt, Kim and Bliss2008), and observations (Robinson & Williams Reference Robinson and Williams2012) and simulations (Dinniman et al.
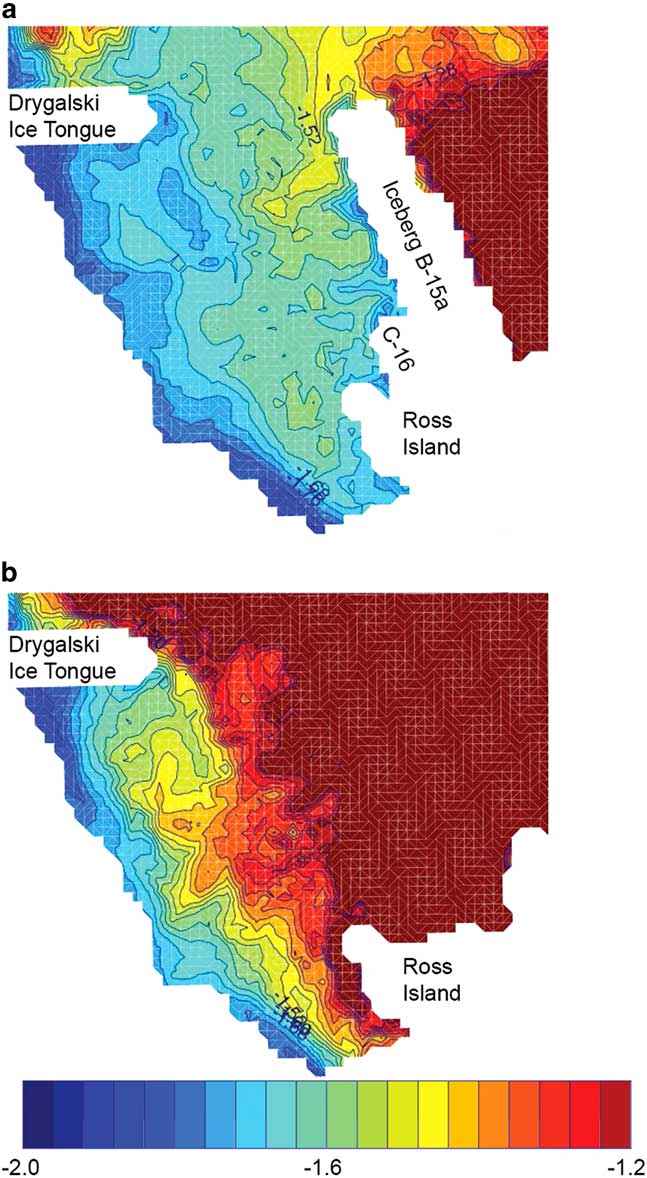
Reference Dinniman, Klinck and Smith2007) indicated that the presence of B-15a and B-16 would mitigate flow of relatively warm surface water into McMurdo Sound (Fig. 3). Ainley et al. (Reference Ainley, Ballard, Eastman, Evans, Nur and Parkinson2017) cautioned whether the icebergs would act as a barrier to toothfish moving at depth over the shelf near Ross Island. However, stratification is weak and the tabular icebergs significantly reduced the height of the water column, which may have diverted westward flow equatorwards throughout the water column as a result of potential vorticity constraints (Dinniman et al.
Reference Dinniman, Klinck and Smith2007). Moreover, iceberg activity led to temporary freshening of the water column and changes in the formation of High Salinity Shelf Water that contributes to outflows off the shelf (Dinniman et al.
Reference Dinniman, Klinck and Smith2007, Robinson & Williams Reference Robinson and Williams2012). Changes in vertical density may reinforce movement to depth, depressing the cloud, altering distributions relative to sampling by Ainley et al. (Reference Ainley, Nur, Eastman, Ballard, Parkinson, Evans and DeVries2013) as well as exposure to shelf outflows.
Fig. 3
Modelled temperature (°C) distributions around Ross Island at 30 m depth in January 2003, modified from Dinniman et al. (Reference Dinniman, Klinck and Smith2007, fig. 14), comparing a. iceberg and b. baseline scenarios.
Sampling
How much the decline observed by Ainley et al. (Reference Ainley, Nur, Eastman, Ballard, Parkinson, Evans and DeVries2013) reflects fishery removals, fishing and predator avoidance by movement to depth or iceberg activity can be addressed in future sampling around McMurdo Sound. However, while we strongly support a monitoring programme that is independent of the fisheries, we note that the sampling designs used by Ainley et al. (Reference Ainley, Nur, Eastman, Ballard, Parkinson, Evans and DeVries2013) and Parker et al. (Reference Parker, Mormede, DeVries, Hanchet and Eisert2016) were essentially opportunistic. Opportunity or convenience sampling is when samples are taken from a part of the population that is easy to access. The disadvantages are a lack of representativeness and the risk of serious biases. In this case, understandably limited by the logistical constraints of sampling through sea ice, the programme was originally established to obtain specimens for laboratory experiments and remained spatially restricted and logistically driven even after resumption by Parker et al. (Reference Parker, Mormede, DeVries, Hanchet and Eisert2016). Activity was limited mostly to one site that sometimes changed between years. The spatial limits of inference were consequently unclear and the representativeness of the samples open to question. Sampling error and bias, as well as changes in spatial and temporal availability of toothfish, may have influenced estimates. However, opportunistic sampling designs generally do not allow these effects to be examined or quantified, and limited numbers of sampling sites constrain the ability to tease apart changes in abundance from shifts in distribution.
These issues contribute to uncertainty in the conclusions drawn. While useful for detecting local temporal trends in catch-rate, the design was unable to separate potential confounding between a decline in abundance and movement to depth. Catch rates are notoriously susceptible to distribution effects. For example, given that the catch rate estimated by Parker et al. (Reference Parker, Mormede, DeVries, Hanchet and Eisert2016) at the two deeper sites was similar to those found prior to the decline, it remained unclear whether a contraction in the depths, and therefore area, occupied by larger toothfish could be indicative of an overall reduction in abundance. Discrepancies in measures of toothfish condition highlighted by Ainley et al. (Reference Ainley, Ballard, Eastman, Evans, Nur and Parkinson2017) may have been an artefact of sample size: differences in the means of body condition index K were small, while differences in the range may simply have reflected the low numbers of fish captured by Parker et al. (Reference Parker, Mormede, DeVries, Hanchet and Eisert2016), that were inadequate to stabilize the tails of the distribution. There may have been confounding between depth and spatial features that are not necessarily related. For instance, most fish caught in the study by Parker et al. (Reference Parker, Mormede, DeVries, Hanchet and Eisert2016) were caught in a bathymetric depression. Were higher catch rates really due to depth, or constraints of topography? The areas of contention between Ainley et al. (Reference Ainley, Ballard, Eastman, Evans, Nur and Parkinson2017) and Parker et al. (Reference Parker, Mormede, DeVries, Hanchet and Eisert2016) reflect such confounding effects and it is difficult to resolve these satisfactorily using a limited number of sampling sites that are chosen opportunistically.
In response, while we fully understand that the logistics of sampling on fast ice can be challenging, a well-conceived probability-based survey would nevertheless help resolve the issues over depth, providing a clearly defined spatial frame and sampling units, samples drawn according to a depth-stratified randomized sampling design and an optimum sample size. A properly randomized design would also help test between the various competing hypotheses concerning toothfish distribution. The design does not need to be complicated. CCAMLR surveys usually stratify by three depth strata and multiple sites randomly chosen within each stratum would simply demand opening a hole in the sea ice for each sampling event. The frame can be drawn up based on the logistical limits of day travel around McMurdo Sound, allowing the spatial limits of inference to be defined clearly. Even three sites randomly chosen each year within each stratum would add a great deal of statistical rigor at the logistical cost of cutting holes for nine sampling sites (compared to the three cut by Parker et al.
Reference Parker, Mormede, DeVries, Hanchet and Eisert2016). However, repeated sampling at each site would be correlated over time and independent sampling events would be better. Drawing from sampling theory and experience elsewhere, estimates will be most precise when a population is partitioned so that sampling units are as similar as possible (e.g. Thompson Reference Thompson1992). Measuring the important sources of variation would facilitate more efficient designs and allocation of sampling effort. The precision and accuracy of estimates could then be improved, while reducing the cost of sampling (e.g. Ashford et al.
Reference Ashford, Jones and Fegley2013).
Discussion
In this paper, we suggest physical–biological interactions between life history and circulation that may influence large D. mawsoni over the inner shelf of the Ross Sea. Specifically, we suggest that large neutrally buoyant toothfish found in McMurdo Sound may have moved from the slope using transport pathways that are well-established in the literature. Particle simulations strongly suggest that depression of the cloud, as well as reduced numbers of large fish over the slope, would lead to fewer reaching areas near Ross Island. Abundance of these toothfish may be partly a function of this movement along shelf inflows and export along shelf outflows, as well as local recruitment from resident juveniles as they grow and experience buoyancy changes associated with maturity. While we agree with our colleagues that fishery removals, fishing and predator avoidance by movement to depth, and the unusual presence of mega-icebergs are all important hypotheses to test, we observe that variation in the circulation is also likely to affect numbers of large toothfish over the inner shelf and the properties of the cloud defined by Ainley et al. (Reference Ainley, Ballard, Eastman, Evans, Nur and Parkinson2017). As well as depression of the cloud, regional causes such as the relative curvature of the shelf, the strength and depth of upwelling onto the shelf and along troughs, the extent and distribution of CDW and shelf water, and effects on flow by topography or icebergs may all influence distribution of large D. mawsoni around McMurdo Sound.
These physical–biological interactions raise questions over variation on longer time scales. Multi-decadal freshening of shelf water in the south-western Ross Sea is consistent with increased melting of continental ice in the Amundsen Sea and transport westward in the ASF and along the coast (Jacobs et al.
Reference Jacobs, Giulivi and Mele2002, Jacobs & Giulivi Reference Jacobs and Giulivi2010). Intrusions reaching the RIS have freshened and cooled as well (Jacobs & Giulivi Reference Jacobs and Giulivi2010). The trend may result in reduced production of AABW (Swift & Orsi Reference Swift and Orsi2012, Purkey & Johnson Reference Purkey and Johnson2013) and less CDW coming onto the Ross Sea shelf (Stewart & Thompson Reference Stewart and Thompson2015). Although unlikely to cause decline on the rapid timescale observed by Ainley et al. (Reference Ainley, Nur, Eastman, Ballard, Parkinson, Evans and DeVries2013), long-term changes in shelf inflows and export along shelf outflows may nevertheless have implications for toothfish movement, and hence abundance and distribution over the inner shelf. Moreover, the freshening has resulted in lower density throughout the water column in the south-western Ross Sea and more vertical stratification (Jacobs et al.
Reference Jacobs, Giulivi and Mele2002, Jacobs & Giulivi Reference Jacobs and Giulivi2010). Like those potentially associated with recent iceberg activity, such changes in the vertical density structure on decadal time scales may depress the toothfish cloud over the long term, altering exposure to shelf inflows and outflows and contributing to spatial mismatches with P. antartica (Ainley et al.
Reference Ainley, Ballard, Eastman, Evans, Nur and Parkinson2017).
Testing between the competing hypotheses is vital and we use this opportunity to explicitly call for a monitoring programme that is probability-based, with a fixed spatial frame and sampling units, and samples drawn according to a depth-stratified randomized sampling design. We welcome recent sampling of seven more sites in a study currently being prepared for publication (Steven J. Parker, personal communication 2017). We note that a probability-based sampling design is necessary, but not in itself sufficient to measure properties of the cloud. Its height in the water column and important variables such as condition, length, age and sex of fish are all likely to vary over time, depth and space. Testing will demand vertical sampling that has not so far been undertaken using longlines. With ice-strengthened vessels, approaches that are independent of fisheries may be effective for pelagic sampling, but problems due to gear effects and the size and density of the fish targeted would need to be addressed. Predator cameras also present an opportunity but careful attention is needed to avoid biases exerted by selective foraging. Finally, we predict strong physical–biological relationships, so measurement of physical variables at the local and regional scale would be a valuable corollary. The measurements can be used to quantify associations with biological variables over the inner shelf and assess their contribution to the variation observed. A more rigorous probability-based approach combining biological monitoring with measures of physical processes would be a valuable step forward in resolving the important questions raised by Parker et al. (Reference Parker, Mormede, DeVries, Hanchet and Eisert2016) and Ainley et al. (Reference Ainley, Ballard, Eastman, Evans, Nur and Parkinson2017) concerning the abundance and distribution of large toothfish in McMurdo Sound.






 You have
Access
A brief overview
An earlier generation of fish ecologists focused on physical–biological interactions and their relationship to the abundance and distribution of Antarctic fish. Prominent studies advanced a diverse array of innovative hypotheses. These included the various roles of fronts, for instance in structuring feeding and forming biological barriers (e.g. Loeb et al. Reference Loeb, Kellermann, Koubbi, North and White1993), currents as transport pathways facilitating immigration and emigration (e.g. Kellermann Reference Kellermann1986), the wind field in structuring life history habitat over the continental shelf (e.g. Hubold Reference Hubold1984) and retention systems in mitigating advection mortality (e.g. White Reference White1998). Nevertheless, the hypotheses were difficult to test with the empirical and analytic tools available at the time. With the advent of commercially valuable fisheries, research focus shifted to supporting the conservation and management of targeted species, in particular identifying population structure and parameterizing stock assessment models.
It is important to note that the shift was not the result of a systematic attempt to test and disprove the earlier hypotheses. Evidence has continued to accumulate for other species, most notably in the transport and life history habitat of krill (e.g. Hofmann et al. Reference Hofmann, Klinck, Locarnini, Fach and Murphy1998, Fach & Klinck Reference Fach and Klinck2006, Piñones et al. Reference Piñones, Hofmann, Dinniman and Klinck2011). Methodology has advanced as well; the increasingly sophisticated toolbox that Antarctic scientists can call on today includes predictive models and vessels capable of sampling in heavy ice conditions. Moreover, theoretical advances in our understanding of the physical system around the Southern Ocean (e.g. GLOBEC, ANSLOPE, RAISED) have coincided with the development of simulation techniques that can predict the transport of particles over a range of spatial and temporal scales (e.g. Fach & Klinck Reference Fach and Klinck2006, Piñones et al. Reference Piñones, Hofmann, Dinniman and Klinck2011, Renner et al. Reference Renner, Thorpe, Heywood, Murphy, Watkins and Meredith2012). Separately, increased commercial fishing has led to growing research activity in support of the Commission for the Conservation of Marine Living Resources (CCAMLR) and interest in spatial and ecosystem perspectives for managing exploited marine populations.
These developments have not been overlooked by Antarctic fish population scientists. In Pleuragrammatinae, the neutrally buoyant clade of notothenioids, empirical studies suggested an important role for the Antarctic Circumpolar Current in structuring populations of Patagonian toothfish Dissostichus eleginoides Smitt (e.g. Shaw et al. Reference Shaw, Arkhipkin and Al-Khairulla2004, Ashford et al. Reference Ashford, Arkhipkin and Jones2006, Reference Ashford, Jones, Hofmann, Everson, Moreno, Duhamel and Williams2008). Hanchet et al. (Reference Hanchet, Rickard, Fenaughty, Dunn and Williams2008) used particle simulations and evidence from conventional fisheries techniques to propose a life history hypothesis for Antarctic toothfish (Dissostichus mawsoni Norman) in the Ross Sea, in which advection during early life was linked to the Ross Gyre. Their hypothesis successfully withstood testing using age distributions validated by lead–radium dating (Brooks et al. Reference Brooks, Andrews, Ashford, Ramanna, Jones, Lundstrom and Cailliet2011), environmental exposures inferred from otolith chemistry and a shelf circulation model (Ashford et al. Reference Ashford, Dinniman, Brooks, Andrews, Hofmann, Cailliet, Jones and Ramanna2012). Near et al. (Reference Near, Russo, Jones and DeVries2003) demonstrated an ontogenetic shift to neutral buoyancy at maturity and Ashford et al. (Reference Ashford, Dinniman, Brooks, Andrews, Hofmann, Cailliet, Jones and Ramanna2012) suggested that this facilitated life history movement of D. mawsoni along deep transport pathways. Principally, recently mature fish move from juvenile feeding grounds on the shelf via trough outflows into the South-east Pacific Basin, and adults move subsequently along the Ross Gyre between spawning areas on the Pacific–Antarctic Ridge and feeding grounds on the continental slope. In Antarctic silverfish (Pleuragramma antarctica Boulenger), another species in the Pleuragrammatinae on which D. mawsoni feeds, La Mesa et al. (Reference La Mesa, Catalano, Russo, Greco, Vacchi and Azzali2010) found that environmental conditions influenced the distribution and abundance of larval stages in the Ross Sea. A series of multi-disciplinary studies indicated substantial genetic flow around the Antarctic continent (Zane et al. Reference Zane, Marcato, Bargelloni, Bortolotto, Papetti, Simonato, Varotto and Patarnello2006, Agostini et al. Reference Agostini, Patarnello, Ashford, Torres, Zane and Papetti2015) and population structuring linked to currents along the coast and continental slope of the Antarctic Peninsula (Ferguson Reference Ferguson2012, La Mesa et al. Reference La Mesa, Riginella, Mazzoldi and Ashford2014, Reference La Mesa, Piñones, Catalano and Ashford2015, Parker et al. Reference Parker, Fraser, Ashford, Patarnello, Zane and Torres2015). In a population review, Ashford et al. (Reference Ashford, Zane, Torres, La Mesa and Simms2017) outlined how physical–biological interactions between glacial trough systems, circulation and life history processes could structure the extensive distributions of P. antarctica observed along and across the continental shelf (e.g. La Mesa & Eastman Reference La Mesa and Eastman2012).
It is in this context that we respond to recent debate over the life history and ecology of D. mawsoni. We commend engagement beyond management working groups at CCAMLR and into the wider, peer-reviewed literature as a productive and welcome development. One strand of the wider discussion has focused on a decline observed in large, neutrally buoyant toothfish documented in McMurdo Sound (Fig. 1) after 2000 and attributed to commercial activity in the Ross Sea from 1997 onwards (Ainley et al. Reference Ainley, Nur, Eastman, Ballard, Parkinson, Evans and DeVries2013, Reference Ainley, Ballard, Eastman, Evans, Nur and Parkinson2017, Parker et al. Reference Parker, Mormede, DeVries, Hanchet and Eisert2016). Another has centred around a recent comprehensive review of Antarctic toothfish biology (Hanchet et al. Reference Hanchet, Dunn, Parker, Horn, Stevens and Mormede2015, Reference Hanchet, Dunn, Parker, Horn, Stevens and Mormede2016 Ainley et al. Reference Ainley, Eastman and Brooks2016) that also referred to the decline in McMurdo Sound. We note that in both cases, the discussion reflected very different perspectives, between scientists working on fishery-related issues in the Ross Sea and others out of McMurdo Sound representing broader concerns, notably with predator–prey relationships. We also recognize the wealth of cross-disciplinary expertise brought to bear and the considerable advances achieved, as well as developing points of convergence. However, physical and spatial structuring is a critical component of the system, and further attention to these aspects may help resolve some of the issues raised. In this article, therefore, we consider the debate concerning abundance and distribution of large D. mawsoni near McMurdo Sound in light of their life history and the shelf circulation. We build on insights about vertical distributions afforded by neutral buoyancy that were highlighted in the earlier discussion, suggest circulatory mechanisms that may be involved and propose improvements in the monitoring programme that can help test between the competing hypotheses.
Map of the Ross Sea adapted from Ashford et al. (Reference Ashford, Dinniman, Brooks, Andrews, Hofmann, Cailliet, Jones and Ramanna2012), with a schematic of the circulation (yellow arrows) showing main flows along the continental slope and Ross Ice Shelf and along troughs located north–south across the shelf. b. Detailed map of McMurdo Sound modified from Parker et al. (Reference Parker, Mormede, DeVries, Hanchet and Eisert2016, fig. 2), showing their sampling sites (red circles) compared to the main area sampled in the time series (yellow square) taken from Ainley et al. (Reference Ainley, Ballard, Eastman, Evans, Nur and Parkinson2017, fig. 1).
Review of evidence: physical structuring and sampling
Summary of prior discussion
The decline in large, neutrally buoyant toothfish observed in McMurdo Sound after 2000 (Ainley et al. Reference Ainley, Nur, Eastman, Ballard, Parkinson, Evans and DeVries2013) was based on a 40 year time series that sampled through a hole cut in sea ice using baited hooks on a longline. As part of a monitoring programme to address the issues raised by Ainley et al. (Reference Ainley, Nur, Eastman, Ballard, Parkinson, Evans and DeVries2013), a similar configuration was used by Parker et al. (Reference Parker, Mormede, DeVries, Hanchet and Eisert2016) during 2014 at three sampling sites in the same vicinity (Fig. 1). No fish were caught at a single site (site 1 in Fig. 1) that was shallower than used during the time series. At the other two sites, deeper than used during the time series, the catch-rate was similar to before the decline. Rather than commercial activity, Parker et al. (Reference Parker, Mormede, DeVries, Hanchet and Eisert2016) suggested the observations by Ainley et al. (Reference Ainley, Nur, Eastman, Ballard, Parkinson, Evans and DeVries2013) were the result of detection issues related to depth or temporary absence influenced by the grounding of two large icebergs off Ross Island.
In response, Ainley et al. (Reference Ainley, Ballard, Eastman, Evans, Nur and Parkinson2017) emphasized the importance of neutral buoyancy and interactions with diving predators and P. antarctica in structuring the vertical distribution of large D. mawsoni in the water column. They suggested this resulted in a ‘cloud’ that extended up from the bottom and, even over depths of >500 m, reached near the surface at times. However, the cloud no longer extends above depths of 500 m in McMurdo Sound, and selective removal of large fish by the fishery would explain reduced numbers of neutrally buoyant individuals capable of moving throughout the water column. Rather than mega-icebergs, the authors hypothesized that predator effects, including fishing, have depressed the cloud below the diving range of many species and contributed to spatial mismatches with vertical distributions of P. antarctica.
As a result, the discussion highlighted the importance of variation in spatial distributions over time and the relationship to depth. There was also agreement over continued monitoring using a spatially stratified, standardized approach. While the exchange raised a number of useful points, we note that the hypotheses suggested to explain the decline observed by Ainley et al. (Reference Ainley, Nur, Eastman, Ballard, Parkinson, Evans and DeVries2013) included very little consideration of major circulation features over the shelf. We agree that fishery removals, fishing and predator avoidance by movement to depth and the unusual presence of mega-icebergs are potential explanations worth testing in future monitoring. However, transport pathways may also contribute to the variation observed.
Physical structuring
Large toothfish are typically caught by benthic longline between 1000–1600 m along the continental slope of the Ross Sea (Hanchet et al. Reference Hanchet, Dunn, Parker, Horn, Stevens and Mormede2016), where the Antarctic Slope Current and Front system (ASF) flows westward (Fig. 1) carrying warm Circumpolar Deep Water (CDW) in its intermediate depths (e.g. Dinniman et al. Reference Dinniman, Klinck and Smith2003, Orsi & Wiederwohl Reference Orsi and Wiederwohl2009). Variable but persistent intrusions of warm CDW are initially driven from the slope onto the Ross Sea shelf by momentum advection resulting from changes in the curvature of the shelf break (Dinniman et al. Reference Dinniman, Klinck and Smith2003), by eddies along the ASF (Stewart & Thompson Reference Stewart and Thompson2015) and by tides (Wang et al. Reference Wang, Danilov, Hellmer, Sidorenko, Schröter and Jung2013). The shelf is characterized by trough systems that are oriented north–south and connect the shelf break to the inner shelf. The cross-shelf circulation is generally bathymetrically controlled and the CDW, mixing with adjacent waters to form modified CDW (MCDW), is carried along the eastern side of the troughs (Dinniman et al. Reference Dinniman, Klinck and Smith2003, Orsi &Wiederwohl Reference Orsi and Wiederwohl2009, Kohut et al. Reference Kohut, Hunter and Huber2013). The intrusions are generally fast-flowing, with velocities of 0.3 m s-1 found along the western side of the Mawson and Pennell banks (Kohut et al. Reference Kohut, Hunter and Huber2013). However, their core is shallow relative to the depths at which most large fish are taken commercially. Deeper shelf water forms outflows that sink down the slope in gravity currents that make counter-current swimming ineffective in the benthic layer (Ashford et al. Reference Ashford, Dinniman, Brooks, Andrews, Hofmann, Cailliet, Jones and Ramanna2012).
The vertical cloud suggested by Ainley et al. (Reference Ainley, Ballard, Eastman, Evans, Nur and Parkinson2017) helps resolve this paradox. Simulation techniques can predict the transport of particles, based on circulation models like the high-resolution version of the Regional Ocean Modelling System used by Ashford et al. (Reference Ashford, Dinniman, Brooks, Andrews, Hofmann, Cailliet, Jones and Ramanna2012). If large fish move high in the water column, particles released from shallower depths can provide insight into the change in transport pathways they would encounter. Simulations of particles released across the slope indicated that a proportion consistently reached the inner shelf of the south-western Ross Sea and Glomar Challenger Basin: 8–12% released from depths of 300 m and 9–19% from 100 m (Ashford et al. Reference Ashford, Dinniman, Brooks, Andrews, Hofmann, Cailliet, Jones and Ramanna2012, table 5). Thus, the extent and frequency of the intrusions containing MCDW that penetrate into the Glomar Challenger trough may contribute to a mechanistic explanation for the historic abundance and distribution of larger toothfish near McMurdo Sound. Poleward inflow forms a tongue of MCDW that occupies the intermediate layer along the eastern side of the trough (Fig. 2). In front of the Ross Ice Shelf (RIS) at 173°W, it forms a layer 150 m thick below a depth of 200 m (Orsi & Wiederwohl Reference Orsi and Wiederwohl2009). Flow along the ice shelf is generally westward (e.g. Jacobs et al. Reference Jacobs, Amos and Bruchhausen1970). Along its western half, Antarctic Surface Water (AASW) is found to a depth of 225 m (Orsi & Wiederwohl Reference Orsi and Wiederwohl2009). Below this, a layer of MCDW occurs to Ross Island, thinning considerably to a thickness of c. 50–75 m (Orsi & Wiederwohl Reference Orsi and Wiederwohl2009). Nutrient transport in CDW in the intrusions is probably important for biological production (McGillicuddy et al. Reference McGillicuddy, Sedwick, Dinniman, Arrigo, Bibby, Greenan, Hofmann, Klinck, Smith, Mack, Marsay, Sohst and van Dijken2015), particularly where it mixes with iron-rich sources from suspension and meltwater. If transport and production are correlated, active feeding is likely to reinforce movement of toothfish entrained in the intrusions across the shelf.
North–south temperature section from the continental slope to Ross Ice Shelf (RIS; study area shown in inset as green rectangle), modified from Jacobs & Giulivi (Reference Jacobs and Giulivi2010, fig. 10; used with permission from the American Meteorological Society), showing intruding modified Circumpolar Deep Water (MCDW) in relation to depth. ASF=Antarctic Slope Current and Front system, LSSW=Low Salinity Shelf Water.
By corollary, depression of the cloud can help explain the decline observed by Ainley et al. (Reference Ainley, Nur, Eastman, Ballard, Parkinson, Evans and DeVries2013), as fish along the slope become less exposed to water upwelling on to the shelf. The proportion of simulated particles reaching shelf areas dropped considerably with increasing depth of release over the slope (Ashford et al. Reference Ashford, Dinniman, Brooks, Andrews, Hofmann, Cailliet, Jones and Ramanna2012). The percentage reaching the Glomar Challenger trough halved to 9–10% between a release depth of 100 m in the surface layer and those at 500 m and 1000 m. The reduction was even more marked, from 9% to 3%, for particles reaching further west into the basin north of Ross Island. Increasing depth of the cloud may also facilitate off-shelf movement through greater exposure to outflowing shelf water. Thus, 48% of simulated particles released in the benthic layer near Ross Island reached the northern Ross Sea continental slope and the western boundary of the model domain, compared to 36% released at 100 m.
Moreover, physical structuring can help explain the association with iceberg activity noted by Parker et al. (Reference Parker, Mormede, DeVries, Hanchet and Eisert2016). Six massive tabular icebergs calved off the RIS between 2000 and 2002. A portion of B-15 (B-15a) and B-16 drifted north of Ross Island in 2001, where they remained until 2005 and 2006 oriented north–south from the edge of the RIS (MacAyeal et al. Reference MacAyeal, Okal, Thom, Brunt, Kim and Bliss2008, fig. 1). Tabular icebergs calving off the RIS generally have a thickness of 250 m (MacAyeal et al. Reference MacAyeal, Okal, Thom, Brunt, Kim and Bliss2008), and observations (Robinson & Williams Reference Robinson and Williams2012) and simulations (Dinniman et al. Reference Dinniman, Klinck and Smith2007) indicated that the presence of B-15a and B-16 would mitigate flow of relatively warm surface water into McMurdo Sound (Fig. 3). Ainley et al. (Reference Ainley, Ballard, Eastman, Evans, Nur and Parkinson2017) cautioned whether the icebergs would act as a barrier to toothfish moving at depth over the shelf near Ross Island. However, stratification is weak and the tabular icebergs significantly reduced the height of the water column, which may have diverted westward flow equatorwards throughout the water column as a result of potential vorticity constraints (Dinniman et al. Reference Dinniman, Klinck and Smith2007). Moreover, iceberg activity led to temporary freshening of the water column and changes in the formation of High Salinity Shelf Water that contributes to outflows off the shelf (Dinniman et al. Reference Dinniman, Klinck and Smith2007, Robinson & Williams Reference Robinson and Williams2012). Changes in vertical density may reinforce movement to depth, depressing the cloud, altering distributions relative to sampling by Ainley et al. (Reference Ainley, Nur, Eastman, Ballard, Parkinson, Evans and DeVries2013) as well as exposure to shelf outflows.
Modelled temperature (°C) distributions around Ross Island at 30 m depth in January 2003, modified from Dinniman et al. (Reference Dinniman, Klinck and Smith2007, fig. 14), comparing a. iceberg and b. baseline scenarios.
Sampling
How much the decline observed by Ainley et al. (Reference Ainley, Nur, Eastman, Ballard, Parkinson, Evans and DeVries2013) reflects fishery removals, fishing and predator avoidance by movement to depth or iceberg activity can be addressed in future sampling around McMurdo Sound. However, while we strongly support a monitoring programme that is independent of the fisheries, we note that the sampling designs used by Ainley et al. (Reference Ainley, Nur, Eastman, Ballard, Parkinson, Evans and DeVries2013) and Parker et al. (Reference Parker, Mormede, DeVries, Hanchet and Eisert2016) were essentially opportunistic. Opportunity or convenience sampling is when samples are taken from a part of the population that is easy to access. The disadvantages are a lack of representativeness and the risk of serious biases. In this case, understandably limited by the logistical constraints of sampling through sea ice, the programme was originally established to obtain specimens for laboratory experiments and remained spatially restricted and logistically driven even after resumption by Parker et al. (Reference Parker, Mormede, DeVries, Hanchet and Eisert2016). Activity was limited mostly to one site that sometimes changed between years. The spatial limits of inference were consequently unclear and the representativeness of the samples open to question. Sampling error and bias, as well as changes in spatial and temporal availability of toothfish, may have influenced estimates. However, opportunistic sampling designs generally do not allow these effects to be examined or quantified, and limited numbers of sampling sites constrain the ability to tease apart changes in abundance from shifts in distribution.
These issues contribute to uncertainty in the conclusions drawn. While useful for detecting local temporal trends in catch-rate, the design was unable to separate potential confounding between a decline in abundance and movement to depth. Catch rates are notoriously susceptible to distribution effects. For example, given that the catch rate estimated by Parker et al. (Reference Parker, Mormede, DeVries, Hanchet and Eisert2016) at the two deeper sites was similar to those found prior to the decline, it remained unclear whether a contraction in the depths, and therefore area, occupied by larger toothfish could be indicative of an overall reduction in abundance. Discrepancies in measures of toothfish condition highlighted by Ainley et al. (Reference Ainley, Ballard, Eastman, Evans, Nur and Parkinson2017) may have been an artefact of sample size: differences in the means of body condition index K were small, while differences in the range may simply have reflected the low numbers of fish captured by Parker et al. (Reference Parker, Mormede, DeVries, Hanchet and Eisert2016), that were inadequate to stabilize the tails of the distribution. There may have been confounding between depth and spatial features that are not necessarily related. For instance, most fish caught in the study by Parker et al. (Reference Parker, Mormede, DeVries, Hanchet and Eisert2016) were caught in a bathymetric depression. Were higher catch rates really due to depth, or constraints of topography? The areas of contention between Ainley et al. (Reference Ainley, Ballard, Eastman, Evans, Nur and Parkinson2017) and Parker et al. (Reference Parker, Mormede, DeVries, Hanchet and Eisert2016) reflect such confounding effects and it is difficult to resolve these satisfactorily using a limited number of sampling sites that are chosen opportunistically.
In response, while we fully understand that the logistics of sampling on fast ice can be challenging, a well-conceived probability-based survey would nevertheless help resolve the issues over depth, providing a clearly defined spatial frame and sampling units, samples drawn according to a depth-stratified randomized sampling design and an optimum sample size. A properly randomized design would also help test between the various competing hypotheses concerning toothfish distribution. The design does not need to be complicated. CCAMLR surveys usually stratify by three depth strata and multiple sites randomly chosen within each stratum would simply demand opening a hole in the sea ice for each sampling event. The frame can be drawn up based on the logistical limits of day travel around McMurdo Sound, allowing the spatial limits of inference to be defined clearly. Even three sites randomly chosen each year within each stratum would add a great deal of statistical rigor at the logistical cost of cutting holes for nine sampling sites (compared to the three cut by Parker et al. Reference Parker, Mormede, DeVries, Hanchet and Eisert2016). However, repeated sampling at each site would be correlated over time and independent sampling events would be better. Drawing from sampling theory and experience elsewhere, estimates will be most precise when a population is partitioned so that sampling units are as similar as possible (e.g. Thompson Reference Thompson1992). Measuring the important sources of variation would facilitate more efficient designs and allocation of sampling effort. The precision and accuracy of estimates could then be improved, while reducing the cost of sampling (e.g. Ashford et al. Reference Ashford, Jones and Fegley2013).
Discussion
In this paper, we suggest physical–biological interactions between life history and circulation that may influence large D. mawsoni over the inner shelf of the Ross Sea. Specifically, we suggest that large neutrally buoyant toothfish found in McMurdo Sound may have moved from the slope using transport pathways that are well-established in the literature. Particle simulations strongly suggest that depression of the cloud, as well as reduced numbers of large fish over the slope, would lead to fewer reaching areas near Ross Island. Abundance of these toothfish may be partly a function of this movement along shelf inflows and export along shelf outflows, as well as local recruitment from resident juveniles as they grow and experience buoyancy changes associated with maturity. While we agree with our colleagues that fishery removals, fishing and predator avoidance by movement to depth, and the unusual presence of mega-icebergs are all important hypotheses to test, we observe that variation in the circulation is also likely to affect numbers of large toothfish over the inner shelf and the properties of the cloud defined by Ainley et al. (Reference Ainley, Ballard, Eastman, Evans, Nur and Parkinson2017). As well as depression of the cloud, regional causes such as the relative curvature of the shelf, the strength and depth of upwelling onto the shelf and along troughs, the extent and distribution of CDW and shelf water, and effects on flow by topography or icebergs may all influence distribution of large D. mawsoni around McMurdo Sound.
These physical–biological interactions raise questions over variation on longer time scales. Multi-decadal freshening of shelf water in the south-western Ross Sea is consistent with increased melting of continental ice in the Amundsen Sea and transport westward in the ASF and along the coast (Jacobs et al. Reference Jacobs, Giulivi and Mele2002, Jacobs & Giulivi Reference Jacobs and Giulivi2010). Intrusions reaching the RIS have freshened and cooled as well (Jacobs & Giulivi Reference Jacobs and Giulivi2010). The trend may result in reduced production of AABW (Swift & Orsi Reference Swift and Orsi2012, Purkey & Johnson Reference Purkey and Johnson2013) and less CDW coming onto the Ross Sea shelf (Stewart & Thompson Reference Stewart and Thompson2015). Although unlikely to cause decline on the rapid timescale observed by Ainley et al. (Reference Ainley, Nur, Eastman, Ballard, Parkinson, Evans and DeVries2013), long-term changes in shelf inflows and export along shelf outflows may nevertheless have implications for toothfish movement, and hence abundance and distribution over the inner shelf. Moreover, the freshening has resulted in lower density throughout the water column in the south-western Ross Sea and more vertical stratification (Jacobs et al. Reference Jacobs, Giulivi and Mele2002, Jacobs & Giulivi Reference Jacobs and Giulivi2010). Like those potentially associated with recent iceberg activity, such changes in the vertical density structure on decadal time scales may depress the toothfish cloud over the long term, altering exposure to shelf inflows and outflows and contributing to spatial mismatches with P. antartica (Ainley et al. Reference Ainley, Ballard, Eastman, Evans, Nur and Parkinson2017).
Testing between the competing hypotheses is vital and we use this opportunity to explicitly call for a monitoring programme that is probability-based, with a fixed spatial frame and sampling units, and samples drawn according to a depth-stratified randomized sampling design. We welcome recent sampling of seven more sites in a study currently being prepared for publication (Steven J. Parker, personal communication 2017). We note that a probability-based sampling design is necessary, but not in itself sufficient to measure properties of the cloud. Its height in the water column and important variables such as condition, length, age and sex of fish are all likely to vary over time, depth and space. Testing will demand vertical sampling that has not so far been undertaken using longlines. With ice-strengthened vessels, approaches that are independent of fisheries may be effective for pelagic sampling, but problems due to gear effects and the size and density of the fish targeted would need to be addressed. Predator cameras also present an opportunity but careful attention is needed to avoid biases exerted by selective foraging. Finally, we predict strong physical–biological relationships, so measurement of physical variables at the local and regional scale would be a valuable corollary. The measurements can be used to quantify associations with biological variables over the inner shelf and assess their contribution to the variation observed. A more rigorous probability-based approach combining biological monitoring with measures of physical processes would be a valuable step forward in resolving the important questions raised by Parker et al. (Reference Parker, Mormede, DeVries, Hanchet and Eisert2016) and Ainley et al. (Reference Ainley, Ballard, Eastman, Evans, Nur and Parkinson2017) concerning the abundance and distribution of large toothfish in McMurdo Sound.
Acknowledgements
We wish to acknowledge two anonymous reviewers for comments that substantially improved the manuscript. We thank Steven J. Parker for permission to reproduce the map of McMurdo Sound in Fig. 1 and generous communication of unpublished material on recent sampling.
Author contribution
JA wrote the initial draft of the manuscript. All authors contributed text revisions and editing, and approved the final version. MD and CB were co-authors on the original publication by Ashford et al. (Reference Ashford, Dinniman, Brooks, Andrews, Hofmann, Cailliet, Jones and Ramanna2012), funded by the US National Science Foundation. MD undertook the particle simulations on which this manuscript draws and CB undertook the age analyses, including their validation, that underpin application to connectivity over the life history. Additional intellectual contributions by MD in this paper include disruption of transport due to iceberg activity and freshening of the water column. CB made important contributions in the presentation of the arguments and their articulation in relation to the debate at CCAMLR.