Introduction
In primate retina, at least 17 types of ganglion cell have been described (Kolb et al., Reference Kolb, Linberg and Fisher1992; Dacey et al., Reference Dacey, Peterson, Robinson and Gamlin2003; Szmajda et al., Reference Szmajda, Grünert and Martin2008). The large majority of the ganglion cells is made up by midget and parasol cells, which are characterized by distinct morphological and physiological properties (reviewed in Dacey, Reference Dacey1999; Lee et al., Reference Lee, Martin and Grünert2010). Midget cells show sustained (“tonic”) responses to maintained contrast and are involved with high visual acuity and the red–green axis of color vision; parasol cells show transient (“phasic”) responses to maintained contrast and are involved with motion detection and object detection at low contrast.
Midget and parasol ganglion cells have been found in all primate retinas studied so far including Old World primates, such as human (Rodieck et al., 1985; Dacey & Petersen, 1992; Kolb et al., Reference Kolb, Linberg and Fisher1992; Dacey, 1993) and macaque (Leventhal et al., 1981; Perry et al., 1984; Watanabe & Rodieck, 1989), and New World primates (reviewed by Silveira et al., 2004), including marmoset (Ghosh et al., Reference Ghosh, Goodchild, Sefton and Martin1996), Cebus monkey (Yamada et al., Reference Yamada, Silveira, Gomes and Lee1996b), and owl monkey (Yamada et al., 2001). The two cell types can be easily distinguished by their dendritic field size and dendritic stratification in the inner plexiform layer.
Midget cells have small dendritic trees, which stratify in the OFF or in the ON sublamina of the inner plexiform layer, where they receive input from OFF and ON midget bipolar cells, respectively (Kolb & DeKorver, Reference Kolb and DeKorver1991; Calkins et al., Reference Calkins and Sterling1994; Dacey & Lee, Reference Dacey and Lee1994; Jusuf et al., Reference Jusuf, Martin and Grünert2006). Parasol cells have larger dendritic trees and stratify close to the middle of the inner plexiform layer. OFF and ON parasol cells receive excitatory input from distinct types of diffuse bipolar cells (Boycott & Wässle, Reference Boycott and Wässle1991). Midget and parasol cells also receive inhibitory synapses from amacrine cells (Kolb & DeKorver, Reference Kolb and DeKorver1991; Calkins et al., Reference Calkins and Sterling1994; Calkins & Sterling, Reference Calkins and Sterling1996, Reference Calkins, Schein, Tsukamoto and Sterling2007; Jacoby et al., Reference Jacoby, Stafford, Kouyama and Marshak1996; Marshak et al., Reference Marshak, Yamada, Bordt and Perryman2002; Bordt et al., Reference Bordt, Hoshi, Yamada, Perryman-Stout and Marshak2006) but little is known about the specific cell types providing this input (Lebedev & Marshak, Reference Lebedev and Marshak2007).
Although the precise roles of most amacrine cell populations are not known, in general, their inhibitory action should counteract bipolar excitation and thus make ganglion cell responses more transient. On this basis, one might expect a greater proportion of amacrine input to parasol cells, and a generalized increase in amacrine input to all cells in peripheral retina, where responses are more transient than in central retina (Solomon et al., Reference Solomon, Martin, White, Rüttiger and Lee2002). Consistently, an electron microscopic (EM) study of the synapses in the inner plexiform layer of macaque and human retinas found that the overall percentage of bipolar synapses decreases in the periphery (Koontz & Hendrickson, Reference Koontz and Hendrickson1987).
EM studies of foveal midget ganglion cells in human (Kolb & DeKorver, Reference Kolb and DeKorver1991) and macaque (Calkins et al., Reference Calkins and Sterling1994) retinas revealed that about half of their input derives from amacrine cells. Whether the same pattern holds true for midget cells outside of the fovea has not been systematically analyzed. Kolb and Marshak (Reference Kolb and Marshak2003) reported for one ON midget ganglion cell in far peripheral (48 degrees) retina of monkey that bipolar synapses were “extremely rare.”
For parasol cells, an EM analysis of a single foveal cell found that less than half of its input derived from amacrine cells (Calkins & Sterling, Reference Calkins, Schein, Tsukamoto and Sterling2007), whereas a partially reconstructed parasol cell in peripheral retina received the large majority of input from amacrine cells (Jacoby et al., Reference Jacoby, Stafford, Kouyama and Marshak1996; Bordt et al., Reference Bordt, Hoshi, Yamada, Perryman-Stout and Marshak2006). Our recent light microscopic studies found that the density of bipolar input to midget and parasol cells in marmoset retina did not change systematically between eccentricities of 2 and 4 mm (16 and 31 degrees) (Eriköz et al., Reference Eriköz, Jusuf, Percival and Grünert2008). The aim of the present study was to determine the density of amacrine and bipolar inputs to midget and parasol ganglion cells across the retina.
Materials and methods
Animals
Five retinas from four (one male and three female) adult marmosets (Callithrix jacchus) were used. The marmosets ranged in weight from 356 to 460 g and in age from 5 to 9 years. They were obtained from the Australian National Health and Medical Research Council combined breeding facility. Additional data were obtained from reanalysis of nine intracellularly injected retinal ganglion cells from three female marmosets from two of our previous studies (Lin et al., Reference Lin, Martin, Solomon and Grünert2000, Reference Lin, Martin and Grünert2002) and details are given there. All procedures were carried out according to the provisions of the Australian National Health and Medical Research Council code of practice for the care and use of animals and were approved by the University of Melbourne institutional ethics committee.
Tracer injections and photofilling
Dye injections and photofilling of ganglion cells were carried out using a modification of the method developed by Dacey et al. (Reference Dacey, Peterson, Robinson and Gamlin2003) as previously described (Szmajda et al., Reference Szmajda, Grünert and Martin2005; Eriköz et al., Reference Eriköz, Jusuf, Percival and Grünert2008; Percival et al., Reference Percival, Jusuf, Martin and Grünert2009). Briefly, animals were anaesthetized with isofluorane (Forthane, Abbott, Australasia, Sydney, Australia; 1–2%), intramuscular ketamine (30 mg/kg), and xylazine hydrochloride (Rompun; Bayer Animal Health Australia, Pymble, Australia; 2–4 μg/kg; n = 1 animal), or with isofluorane, xylazine hydrochloride, and alfaxalone (Alfaxan; Jurox, Rutherford, Australia; n = 1 animal), or with isofluorane and alfaxalone (n = 2 animals). Anesthesia was maintained using sufentanil citrate (Sufenta-Forte; Janssen-Cilag, Beerse, Belgium; 4–8 μg/kg) in dextrose ringer solution (Baxter, Sydney, Australia).
Iontophoretic injections of 5% dextran, tetramethylrhodamine, and biotin (“microruby,” D7162; Invitrogen, Mount Waverley, Australia) in 0.9% NaCl were made into the dorsal lateral geniculate nucleus. Retrograde transport of the tracer took place over approximately 64–88 h following injections. Subsequently, animals were overdosed with sodium pentobarbitone (intravenous 80–150 mg/kg; Nembutal; Rhone Merieux Pro Vet, Pinkenba, Australia). The eyes were enucleated and the posterior eyecup immersed in carboxygenated (95% O2/5% CO2) Ames tissue culture medium (Sigma, St. Louis, MO). The retina was dissected, mounted onto Millipore filter paper (either AABG02500, 0.8 μm pore size, or SSWP02500, 3.0 μm pore size; Millipore, Bedford, MA), and put into a superfusion chamber (Warner Instruments, Hamden, CT) on a fixed stage microscope (Axioskop 2; Zeiss, Göttingen, Germany). The chamber was superfused with carboxygenated Ames medium at a rate of approximately 2 ml/min, and the chamber temperature maintained at approximately 37.5°C. Illumination of the retina with a dual-band Lucifer Yellow/Rhodamine filter (Chroma filter set 51016) resulted in photofilling of ganglion cell dendrites. After photofilling was complete, the retina was fixed in 4% paraformaldehyde in 0.1 m phosphate buffer (PB, pH 7.4) for 30 min at 4°C and rinsed in 0.1 m PB before processing for immunohistochemistry.
Antibody characterization
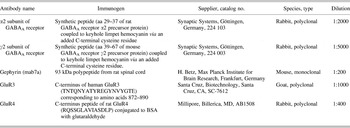
Table 1 gives a summary of the antibodies used in the present study. The antibody against the α2 subunit of the GABAA receptor has been tested in Western blots of rat brain, where it stains a strong band of about 50 kDa molecular weight (information from Synaptic Systems, Göttingen, Germany). The antibody against the γ2 subunit of the GABAA receptor has been tested in Western blots of rat brain, where it stains a strong band of about 45 kDa molecular weight (information from Synaptic Systems). The antibody against the 93 kDa protein gephyrin (mab7a) has been characterized by Western blots of rat spinal cord, where it stains a strong band of 93 kDa molecular weight (Pfeiffer et al., Reference Pfeiffer, Simler, Grenningloh and Betz1984). Antibody binding is specific to the 93 kDa polypeptide found within postsynaptic glycine receptor complexes and does not cross-react with other glycine receptor polypeptides (Schmitt et al., Reference Schmitt, Knaus, Becker and Betz1987). Gephyrin is involved in the clustering of receptor channels at the majority of inhibitory postsynaptic sites (Kneussel & Betz, Reference Kneussel and Betz2000), and it has been shown that mab7a labeling is abolished in gephyrin null mice (Fischer et al., Reference Fischer, Kneussel, Tintrup, Haverkamp, Rauen, Betz and Wässle2000). Gephyrin immunoreactivity has been localized to postsynaptic sites of amacrine and ganglion cell processes in retinas of mammals including primates (Pourcho & Owczarzak, Reference Pourcho and Owczarzak1991; Grünert & Wässle, Reference Grünert and Wässle1993).
Primary antibodies

The polyclonal goat antiserum against the glutamate receptor subunit 3 (GluR3) has been shown to be associated with synaptic labeling in mouse (Dumitrescu et al., Reference Dumitrescu, Pucci, Wong and Berson2009) and macaque (Puller & Haverkamp, Reference Puller and Haverkamp2011) retinas. Western blot analysis of macaque retina shows that the GluR3 antibody precipitates the corresponding AMPA receptor subunit (Puller & Haverkamp, Reference Puller and Haverkamp2011).
The antiserum against the glutamate receptor subunit 4 (GluR4) has been characterized by Western blots of rat brain by the manufacturer and shows a single band comigrating with GluR4 expressed in transfected cells (Chemicon, technical information). It has also been characterized by Western blots of solubilized homogenates of adult vestibular nuclear complex from rats where it recognizes a band between 105 and 108 kDa (Tse et al., Reference Tse, Lai, Lai, Liu, Yung, Shum and Chan2008). GluR4 immunoreactivity is found at postsynaptic sites in retinas of mammals, including primates (Haverkamp et al., Reference Haverkamp, Grünert and Wässle2000, Reference Haverkamp, Grünert and Wässle2001; Grünert et al., Reference Grünert, Haverkamp, Fletcher and Wässle2002).
Immunohistochemistry
The retinas were separated from the filter paper, immersed in 30% sucrose in 0.1 m PB overnight, and subsequently freeze cracked with liquid nitrogen. Retinal pieces were rinsed in 0.1 m PB for 10 min and subsequently preincubated in phosphate buffered saline (PBS, pH 7.4) containing 5% bovine serum albumin (BSA) and 0.5% Triton X-100 for 30–60 min. Retinas or retinal sections were incubated with a combination of primary antibodies for 3–7 days at 4°C (whole mounts) or at room temperature overnight (sections). Primary antibodies were diluted in PBS containing 1% BSA, 0.5% Triton X-100, and 0.05% sodium azide. Pieces were then rinsed in PBS and incubated in secondary antibodies for 1 h (sections) or overnight (whole mounts). Secondary antibodies were goat antimouse Immunoglobulin G coupled to Alexa 488 (Invitrogen) used at a dilution of 1:500 and goat antirabbit Cy5 (Jackson ImmunoResearch, Westgrove, PA) used at a dilution of 1:100. Secondary antibodies were diluted in PBS containing 1% BSA and 0.5% Triton X-100 and used in combination. The preparations were coverslipped in Mowiol (Hoechst, Sydney, Australia) containing 10% 1,4-diazabicyclo-[2.2.2]-octane (Harlow & Lane, 1988). Vertical sections were incubated in a mix of primary antibodies for about 16 h and processed as described above.
Micrographs
High-resolution micrographs were taken under oil immersion using a digital camera (Axiocam; Zeiss) mounted onto a Zeiss Axioplan 2 microscope with a 40× or 63× objective. Stacks of 14–79 digital images at 0.2, 0.275, or 0.3 μm spacing were acquired using filter sets #43 (Cy3; Zeiss), #10 (FITC; Zeiss), and #26 (Cy5; Zeiss) or the Cy5 filter set from Semrock (Semrock, Rochester, NY). Images of preparations were also taken under bright field illumination using differential interference contrast optics. The brightness and contrast of the images were adjusted in Axiovision software (Zeiss) or Adobe Photoshop. All images were deconvolved using Axiovision software.
Classification of ganglion cells
Completely filled ganglion cells as judged by bright consistent labeling at distal dendritic tips were used for the analysis. Midget and parasol ganglion cells were identified according to their morphology, dendritic field size, stratification level in the inner plexiform layer, and branch density using custom software written in MATLAB (image processing toolbox; Mathworks, Natick, MA) as described previously (Szmajda et al., Reference Szmajda, Grünert and Martin2008).
Colocalization of immunoreactive puncta
Image stacks were analyzed by a semiautomated protocol using IMARIS software (Bitplane, Zurich, Switzerland). The percentage of “colocalized” immunoreactive (IR) puncta for different synaptic markers was determined in double-labeled vertical sections using colocalization thresholds of 0.10, 0.25, 0.50, 0.75, and 1.00 μm. The term colocalization refers in this case to a specified distance between two puncta and not to a complete overlap between two puncta.
For the analysis of IR puncta associated with the dendritic tree, the dendritic surface was outlined and IR puncta were identified. IR puncta were classed as being associated with the dendritic tree if the displacement between the dendritic surface and the center of the punctum was less than or equal to 0.15 μm. Results obtained with this criterion are comparable to our previous methods using custom MATLAB software (Eriköz et al., Reference Eriköz, Jusuf, Percival and Grünert2008; Percival et al., Reference Percival, Jusuf, Martin and Grünert2009). Average synaptic densities (IR puncta/100 μm2 surface area) for each cell were calculated by integrating the dendritic surface area and number of IR puncta from all sampled dendritic regions for each cell. Pseudorandom control densities were calculated for each dendritic region by flipping the channel containing IR puncta around the vertical axis and calculating the density of the pseudoassociated IR puncta.
Statistical tests
The Wilcoxon nonparametric paired rank sum test (“Wilcoxon”) is used for statistical comparisons of paired data and the Mann–Whitney nonparametric rank sum test (“Mann–Whitney”) is used for statistical comparisons of unpaired data.
Results
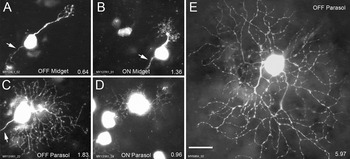
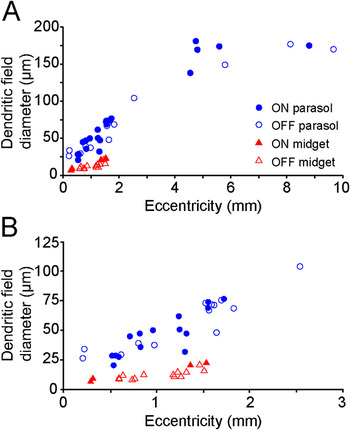
A total of 17 photofilled midget cells (13 OFF and 4 ON), 28 photofilled parasol cells (13 OFF and 15 ON), and 9 intracellularly injected parasol cells (4 OFF and 5 ON) were analyzed. Fig. 1 shows micrographs of four retrogradely labeled cells and one intracellularly injected cell. The reader should note that the quality of fills in many of the retrogradely labeled cells is not as good as in the intracellularly injected cells. This discrepancy may be explained by the limited amount of travel time (maximally 3.5 days) for the dye. Midget cells have smaller somas and dendritic trees compared to parasol cells. For both cell types, the dendritic field diameter increases with eccentricity and the dendritic field size of parasol cells exceeds that of midget cells at any given eccentricity (Fig. 2). The dendritic field diameters of the midget and parasol cells investigated here lie within the range reported in previous studies of marmoset retina (Silveira et al., Reference Silveira, Yamada, Perry and Picanço-Diniz1994; Ghosh et al., Reference Ghosh, Goodchild, Sefton and Martin1996; Yamada et al., Reference Yamada, Silveira, Gomes and Lee1996a; Szmajda et al., Reference Szmajda, Grünert and Martin2005, Reference Szmajda, Grünert and Martin2008).
Micrographs of midget and parasol cells in marmoset retina. (A–D) Retrogradely labeled and photofilled cells from central retina. (E) Intracellularly injected parasol cell from peripheral retina obtained from Lin et al. (Reference Lin, Martin, Solomon and Grünert2000). The eccentricity (in mm) is indicated in the lower right of each panel. Cell bodies of other unfilled cells are visible in panels (A–D). Collapsed images from stacks of images through the ganglion cell and inner plexiform layers are shown. The cell shown in (E) is a montage of three separate micrographs. Arrows indicate the axon. Scale bar = 20 μm (applies to A–E).

Dendritic field diameter versus retinal eccentricity for the cells used in the present study. (A) The retrogradely labeled cells are from within 2.5 mm of the fovea. The intracellularly injected parasol cells are from eccentricities greater than 4.5 mm. (B) Central cells at a magnified scale.

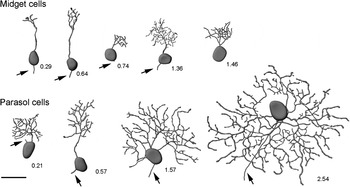
The reader should note that in the present study, all but one of the retrogradely labeled cells are located within 2 mm of the fovea. The marmoset eye is approximately half the size of the human eye, thus, in marmoset, 2 mm eccentricity corresponds to about 16 degrees of visual angle (Troilo et al., Reference Troilo, Howland and Judge1993; Wilder et al., Reference Wilder, Grünert, Lee and Martin1996). These cells and one parasol cell located at 2.54 mm eccentricity are termed “central cells.” All intracellularly injected parasol cells reanalyzed from Lin et al. (Reference Lin, Martin, Solomon and Grünert2000, Reference Lin, Martin and Grünert2002) are from eccentricities greater than 4.5 mm (corresponding to about 35 degrees of visual angle) and will be termed “far peripheral cells.” One of the far peripheral parasol cells is not included in Fig. 2 as its exact eccentricity could not be determined. Fig. 3 shows reconstructions of some of these cells. As outlined above, at any given eccentricity, parasol cells can be distinguished from midget cells by their dendritic field size.
Reconstructions of retrogradely labeled midget and parasol cells. The eccentricity (in mm) of each cell is indicated to the right of each cell. Arrows indicate axons. Scale bar = 20 μm.

Identifying synaptic input
Gephyrin has previously been shown to be present at the large majority of amacrine synapses (e.g., Sassoè-Pognetto et al., Reference Sassoè-Pognetto and Fritschy1995) and antibodies against the GluR4 subunit of the AMPA receptor are considered to be suitable markers for the majority of ribbon synapses (Jusuf et al., Reference Jusuf, Martin and Grünert2006; Hoshi et al., Reference Hoshi, Liu, Massey and Mills2009). Thus, we used antibodies against gephyrin to identify amacrine synapses and antibodies against GluR4 to identify bipolar synapses.
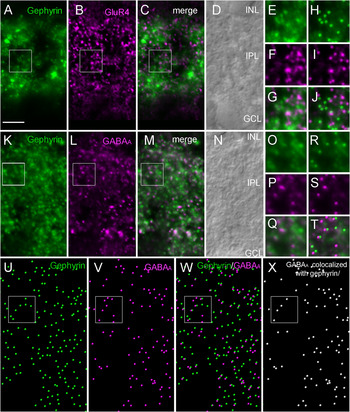
Double immunofluorescence of vertical sections was carried out to show that antibodies against gephyrin and GluR4 label distinct sets of synapses. Fig. 4A–4G shows micrographs of such a double-labeled vertical section. IR puncta for both markers are found across the entire inner plexiform layer. Fig. 4H–4J shows the same images together with the IR puncta as identified by image analysis. There is minimal overlap between GluR4 and gephyrin IR puncta. In contrast, double immunofluorescence of sections processed with antibodies against gephyrin and the α2 subunit of the GABAA receptor shows many puncta overlapping (Fig. 4K–4X).
Analysis of colocalized IR puncta in double-labeled vertical sections. (A–T) Light micrographs of vertical sections processed with antibodies against gephyrin (green) and GluR4 (magenta) (A–J) or gephyrin (green) and the α2 subunit of the GABAA receptor (magenta) (K–T) with accompanying Nomarski images to reveal retinal layers. Single images of a deconvolved stack of images are shown. Inner nuclear layer (INL), inner plexiform layer (IPL), ganglion cell layer (GCL). (E–G) Boxed area from (A–C). (H–J) Same images as in (E–G) superimposed with IR puncta as identified during image analysis. (O–Q) Boxed area from (K–M). (R–T) Same images as in (O–Q) superimposed with IR puncta as identified during image analysis. (U–W) Gephyrin (green) and GABAA receptor (magenta) IR puncta in the inner plexiform layer as identified by image analysis (same as K–M). (X) Subpopulation of GABAA IR puncta colocalized with gephyrin as identified by image analysis. Puncta are not drawn to scale. Scale bar = 5 μm (applies to A–D and K–N). Width of boxes = 5 μm.

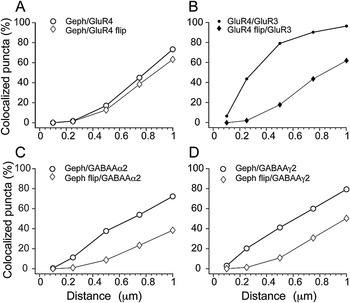
We quantified the number of gephyrin and GluR4 IR puncta in a stack of images through the inner plexiform layer taken from a 12-μm thick vertical section. In total, 3161 gephyrin IR and 3513 GluR4 IR puncta were identified. Depending on how the distance threshold (i.e., the maximum distance between two puncta) is set, the percentage of colocalized puncta changes. Only at a relatively large threshold of 1 μm is the percentage of gephyrin IR puncta colocalized with GluR4 IR puncta above 50%; a similar percentage is obtained when one image channel is flipped around the vertical axis and the puncta are superimposed pseudorandomly (Fig. 5A). This result is consistent with the idea that gephyrin and GluR4 are expressed at different synapses.
Colocalization of gephyrin IR puncta with other synaptic markers at different thresholds (i.e., maximal distance between two puncta) before and after pseudorandom superpositions (flip). (A) Colocalization of gephyrin and GluR4. (B) Colocalization of GluR3 and GluR4. (C) Colocalization of gephyrin and the α2 subunit of the GABAA receptor. (D) Colocalization of gephyrin and the γ2 subunit of the GABAA receptor.

When we analyzed a section double labeled for the two AMPA receptor subunits GluR3 and GluR4 in a similar way, we found that at a threshold of 0.5 μm, 73% of GluR3 IR puncta (1798/2463) were colocalized with GluR4 IR puncta; but a much lower percentage (less than 20%) of puncta is colocalized when one image channel is flipped around the vertical axis and the puncta are superimposed pseudorandomly (Fig. 5B). This result is consistent with the hypothesis that the two AMPA receptor subunits are expressed at the same synapse (Dumitrescu et al., Reference Dumitrescu, Pucci, Wong and Berson2009; Puller & Haverkamp, Reference Puller and Haverkamp2011).
Finally, the analysis of a section double labeled for gephyrin and either the α2 or the γ2 subunit of the GABAA receptor revealed that at a threshold of 0.5 μm, about 40% of the gephyrin puncta are colocalized with the puncta of the α2 and γ2 subunits of the GABAA receptor, respectively (Fig. 5C and 5D). This result suggests that gephyrin is present at a large proportion of GABAergic synapses.
Distribution of inhibitory inputs
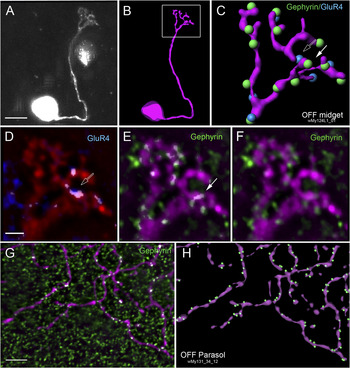
Fig. 6 shows examples of ganglion cells processed with antibodies against gephyrin and GluR4. IR puncta associated with the dendrites are found along the entire dendritic tree with the exception of the primary dendrite, which usually lacks synaptic input. The presumed input is relatively evenly distributed and does not seem to form any specific pattern. However, we did not analyze the spatial distribution of presumed input in greater detail; it is possible that the synapses on the dendritic tree are regularly spaced as has recently been shown for excitatory input to ganglion cells in rabbit retina (Koizumi et al., Reference Koizumi, Jakobs and Masland2011). Gephyrin IR puncta are located on both the inner (i.e., facing the ganglion cell layer) and outer facing sides of the dendrite.
Distribution of presumed amacrine input on the dendritic tree of ganglion cells. (A) Micrograph of a retrogradely labeled midget cell (collapsed image from a stack of images). The axon is not visible. This cell is from an eccentricity of 0.6 mm. (B) Reconstruction of the cell. (C) Reconstruction of the dendritic tree showing colocalized gephyrin and GluR4 IR puncta. (D, E) Colocalized pixels on the dendritic tree as identified by image analysis. Single images within a Z-stack are shown. Colocalized pixels appear white. Open arrow points to a GluR4 IR, closed arrow points to a gephyrin IR punctum associated with the dendrite. (F) Dendritic tree together with gephyrin IR puncta (raw data: merge images from the two channels). A single image from a stack of deconvolved images is shown. (G) Region of the dendritic tree from a labeled parasol cell together with colocalized gephyrin IR puncta as identified in the colocalization channel. Colocalized pixels appear white. A single image from a stack of images is shown. This cell is from an eccentricity of 2.54 mm. (H) Reconstruction of the same region of the dendritic tree showing gephyrin puncta that are associated with the dendrites of the cell. The surface area of the cell was determined as described in the methods. Puncta are not shown to scale. Scale bars = 10 μm in (A); 2 μm in (D) (applies to D–F); 5 μm in (G) (applies to G, H).

Fig. 6F shows a single image taken from a stack of images together with gephyrin IR puncta for a midget ganglion cell. In Fig. 6, complementary analyses of the number of IR puncta associated with the dendritic tree are shown for this cell. A threshold was set for each of the two image channels (GluR4 puncta shown in blue, gephyrin IR puncta shown in green) so that the colocalized pixels appear white (Fig. 6D and 6E). Fig. 6C shows a reconstruction of the dendritic tree; associated IR puncta were determined as described in the methods. Most of the IR puncta associated with the dendrite can be seen with both methods indicating that the two methods yield comparable results. A similar comparison is shown for a dendritic region in a parasol cell in Fig. 6G and 6H. We chose the reconstruction method for our analysis as it allowed us to determine the presumed synaptic density per dendritic surface area (see below).
Ratio of bipolar to amacrine input: central cells
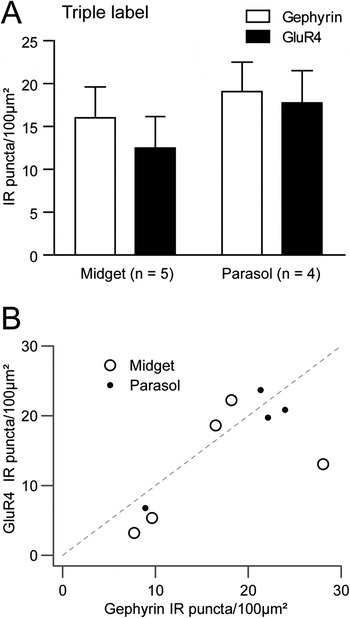
The cells from central retina derived from preparations containing retrogradely labeled cells that were processed with antibodies against gephyrin and GluR4. Gephyrin immunofluorescence was good in all preparations (e.g., Fig. 6F and 6G) but the quality of the GluR4 staining was sufficient only in a small number of cells (n = 5 midget, n = 4 parasol cells). We used these cells (e.g., Fig. 6A–6F) to compare the density of gephyrin and GluR4 IR puncta associated with the dendrites directly in the same cell. The results are shown in Fig. 7A. For the midget cells (eccentricities 0.64, 0.76, 1.26, 1.36, 1.53 mm), the average density (per 100 μm2 surface area) of IR puncta associated with the dendrites was 16.01 ± 8.06 for gephyrin and 12.49 ± 8.21 for GluR4. For the parasol cells (eccentricities 0.21, 1.30, 1.32, and 2.54 mm), the average density was 19.0 ± 6.87 IR puncta for gephyrin and 17.75 ± 7.51 IR puncta for GluR4. Thus, gephyrin puncta associated with dendrites on average made up 59% of the total number of puncta in midget and 53% in parasol cells. In summary, there was no difference in the ratio of gephyrin to GluR4 input between the cell types (P = 0.73, Mann–Whitney).
Comparison of presumed bipolar and amacrine input to midget and parasol cells in central retina from triple labeled preparations. (A) Density of GluR4 and gephyrin IR puncta per dendritic surface area for five midget and four parasol cells. The mean and standard error are shown. (B) Correlation of gephyrin and GluR4 puncta density from the same set of triple-labeled cells as in (A) (correlation coefficient: 0.73, r 2 = 0.53, P = 0.025, n = 9). Dashed line shows 1:1 ratio.

As shown in Fig. 7B, the ratio of bipolar to amacrine cell input appears mildly correlated on a cell-by-cell basis (correlation coefficient: 0.73, r 2 = 0.53, P = 0.025, n = 9). These data are consistent with the idea that expression of excitatory and inhibitory receptor populations is controlled by a common cellular mechanism (see also Soto et al., Reference Soto, Bleckert, Lewis, Kang, Kerschensteiner, Craig and Wong2011). However, further experiments with a larger sample are required to substantiate this trend.
Density of synaptic input: central cells
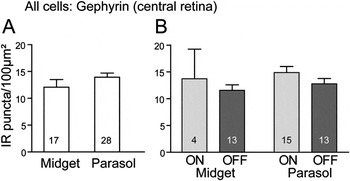
In central retina, 21 dendritic regions from a total of 17 midget cells and 106 dendritic regions from a total of 28 parasol cells were analyzed for gephyrin. The density of presumed amacrine synaptic inputs was similar (P = 0.17, Mann–Whitney) for the two cell types (Fig. 8A). Midget cells had on average 12.08 ± 5.83 gephyrin IR (per 100 μm2 dendritic surface area, mean, and standard deviation) associated with their dendrites; parasol cells had 13.92 ± 4.09. The average values for all cells analyzed are in the same range as the average values given above for a subset of cells where gephyrin and GluR4 were analyzed (Fig. 7A). The difference in the values may be explained by the relatively small sample size. The mean density of IR puncta close to the surface is reduced by 17% after flipping the image channel with the IR puncta around the vertical axis for parasol cells (P < 0.01, Wilcoxon) and by 7% for midget cells (P = 0.17, Wilcoxon).
Density of gephyrin IR puncta associated with the dendritic tree of midget and parasol cells in central retina. The mean and standard error of the mean are shown. (A) Comparison of midget and parasol cells. (B) Density data for gephyrin shown in (A) separated into ON and OFF cells. Cell numbers are indicated in each bar.

Fig. 8B shows that ON cells tend to have higher densities of gephyrin IR puncta than OFF cells (ON midget: 13.74 ± 11.06; OFF midget: 11.57 ± 3.67; ON parasol: 14.89 ± 4.39; OFF parasol: 12.79 ± 3.56), but this difference is not statistically significant (midget cells, P = 0.96; parasol cells, P = 0.17, Mann–Whitney).
Comparison of parasol cells in central and far peripheral retina
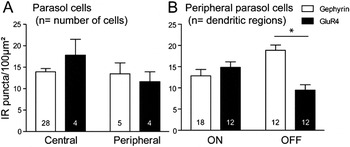
In order to compare parasol cells from central retina with parasol cells from far peripheral retina, we reanalyzed dendritic regions of five parasol cells from preparations that were processed for gephyrin (Lin et al., Reference Lin, Martin, Solomon and Grünert2000) and four parasol cells that were processed for GluR4 immunoreactivity (Lin et al., Reference Lin, Martin and Grünert2002). As shown in Fig. 9A, the average density (per 100 μm2 dendritic surface area) of gephyrin IR puncta associated with the dendrites of far peripheral parasol cells (13.46 ± 5.69) was comparable (P = 0.87, Mann–Whitney) to that of the central cells (13.92 ± 4.09). When the image channel with the puncta was flipped, there was a 12% reduction in the mean density of gephyrin IR puncta (P = 0.06, Wilcoxon). This result indicates that there are no dramatic changes in the density of gephyrin with eccentricity for parasol cells.
Density of gephyrin and GluR4 IR puncta associated with the dendritic tree of parasol cells. The mean and standard error of the mean are shown. (A) Comparison of parasol cells in central and far peripheral retina. The numbers in the bars indicate the number of cells analyzed. (B) Comparison of ON and OFF parasol cells in far peripheral retina. The OFF cells have a higher average density of gephyrin than GluR4 IR puncta (P < 0.01, Mann–Whitney test). Five ON parasol and four OFF parasol cells were analyzed; the numbers in the bars indicate the number of dendritic regions analyzed.

The average value for GluR4 on the parasol cells from far peripheral retina is 11.60 ± 4.64 IR puncta (n = 4 cells; Fig. 9A), which is lower (P = 0.20, Mann–Whitney) than the value obtained for the four parasol cells from central retina (17.75 ± 7.5 GluR4 IR puncta). When the image channel with the puncta was flipped, there was an 11% reduction of GluR4 IR puncta (P = 0.13, Wilcoxon).
The results indicate that parasol cells in far peripheral retina, on average, have about equal density of gephyrin and GluR4 IR puncta associated with their dendrites (P = 0.90, Mann–Whitney). However, as Fig. 9B shows, for ON parasol cells, the average density of gephyrin IR puncta associated with the dendrites (12.84 ± 6.42; n = 3 cells, 18 regions) was lower (P = 0.36, Mann–Whitney) than the average density of GluR4 IR puncta (14.82 ± 4.56; n = 2 cells, 12 dendritic regions). In contrast, OFF parasol cells had a higher average density (P < 0.01, Mann–Whitney) of gephyrin IR puncta (18.86 ± 4.25; n = 2 cells, 12 regions analyzed) than GluR4 IR puncta (9.47 ± 4.41; n = 2 cells, 12 dendritic regions).
Discussion
The results of the present study confirm and extend our previous studies where we investigated the presumed density of amacrine and bipolar input to parasol and midget ganglion cells in marmoset retina (Lin et al., Reference Lin, Martin, Solomon and Grünert2000, Reference Lin, Martin and Grünert2002; Macri et al., Reference Macri, Martin and Grünert2000; Jusuf et al., Reference Jusuf, Martin and Grünert2006; Eriköz et al., Reference Eriköz, Jusuf, Percival and Grünert2008). However, most of the cells analyzed here were from an eccentricity range that was not analyzed previously. The main conclusion of the present study is that, at least for parasol cells, the density of the inhibitory inputs remains stable across the retina. Furthermore, we show—by direct comparison of the presumed amacrine and bipolar input in triple-labeled preparations—that in central retina, both midget and parasol cells receive about equal input.
IR puncta on ganglion cell dendrites
We show here that in marmoset retina, a significant proportion of gephyrin IR puncta is located close to an α2 and/or a γ2 GABAA IR punctum. This finding is consistent with previous findings in the retina and other brain regions of rodents showing that gephyrin is present at the large majority of glycinergic and GABAergic amacrine synapses (Sassoè-Pognetto et al., Reference Sassoè-Pognetto and Fritschy1995; Sassoè-Pognetto & Fritschy, Reference Sassoè-Pognetto, Kirsch, Grünert, Greferath, Fritschy, Möhler, Betz and Wässle2000; Tyagarajan & Fritschy, Reference Tyagarajan and Fritschy2010).
Only electron microscopy can show whether IR puncta associated with dendrites are actually located at postsynaptic sites on the ganglion cell dendrites. However, EM can only be used to analyze low numbers or incomplete reconstructions of cells. The light microscopic analysis used in the present study assumes that IR puncta associated with the dendritic membrane represent input synapses. The density of IR puncta on dendrites was not always significantly different from the density found when one image channel was flipped. This does not mean, however, that there are no gephyrin or GluR4 IR puncta associated with these ganglion cell dendrites. As discussed previously (Jeon et al., Reference Jeon, Kong, Strettoi, Rockhill, Stasheff and Masland2002; Majumdar et al., Reference Majumdar, Heinze, Haverkamp, Ivanova and Wässle2007; Percival et al., Reference Percival, Jusuf, Martin and Grünert2009), the results from the random superposition of the flipped image are not as informative when an individual cell is labeled compared to when an entire population is labeled because the proportion of IR puncta associated with unlabeled members of the target population is unknown. Thus, in addition, we rely upon the judgment of an experienced observer and the consistency of a semiautomated method of determining IR puncta on dendrites, to give estimates of punctal density.
Inhibitory input to midget and parasol cells
The average density of the presumed amacrine input to parasol and midget cells was in the same range (12–18 gephyrin IR puncta/100 μm2) across all retinal eccentricities studied. The values for OFF parasol cells in central (13 gephyrin IR puncta/100 μm2) and far peripheral retina (18 gephyrin IR puncta/100 μm2) are lower than that found for one OFF parasol cell in macaque fovea using EM (37 amacrine synapses per 100 μm2 surface area, Calkins & Sterling, Reference Calkins, Schein, Tsukamoto and Sterling2007). This difference is most likely due to the difference in methods; as explained elsewhere (Majumdar et al., Reference Majumdar, Heinze, Haverkamp, Ivanova and Wässle2007), light microscopic estimates of synaptic density tend to underestimate colocalization because of inherent optical limitations in Z-axis (stack depth) resolution.
IR puncta for the α1 subunit of the GABAA receptor have been found to coincide with the dendrites of both midget and parasol cells (Macri et al., Reference Macri, Martin and Grünert2000) but double-labeling studies in rat retina have shown that IR puncta for the α1 subunit of the GABAA receptor are only rarely colocalized with gephyrin IR puncta (Sassoè-Pognetto et al., Reference Sassoè-Pognetto and Fritschy1995). Thus, amacrine synapses containing the α1 subunit of the GABAA receptor are probably not included in counts of gephyrin IR puncta and thus also contribute to underestimation of amacrine input.
In summary, the absolute density of the presumed amacrine input analyzed with our light microscopic methods is likely to be lower than absolute density estimated by electron microscopy. This fact does not influence our comparison of density in central versus peripheral retina, or our conclusion that density of amacrine input is constant across the retina, because these comparisons are within the same experimental conditions. Nevertheless, we cannot rule out the possibility that differences in GABAAα1 subunit expression between midget and parasol cells, or between central and peripheral cells, could influence the overall balance of excitation and inhibition.
Excitatory input to parasol cells
The average density of presumed excitatory input determined here for four parasol cells (about 12 IR puncta per 100 μm2) from far peripheral retina is roughly in the same range (7–8 IR puncta per 100 μm2) as reported previously for midperipheral parasol cells using a slightly different method (Eriköz et al., Reference Eriköz, Jusuf, Percival and Grünert2008). Thus, these combined data indicate that for parasol cells, there are no strong eccentricity-related differences in density of bipolar input. Compatible results have been obtained for central and peripheral alpha and beta cells in cat retina (Kier et al., Reference Kier, Buchsbaum and Sterling1995) and various ganglion cell types in rabbit (Jakobs et al., Reference Jakobs, Koizumi and Masland2008), guinea pig (Xu et al., Reference Xu, Vasudeva, Vardi, Sterling and Freed2008), and for small bistratified, large sparse, and broad thorny ganglion cells in marmoset retina (Percival et al., Reference Percival, Jusuf, Martin and Grünert2009, Reference Percival, Martin and Grünert2011).
The average density of GluR4 IR puncta determined for four parasol cells from central retina (about 18 IR puncta per 100 μm2) was higher than that determined for the cells from far peripheral retina (about 12 IR puncta per 100 μm2) suggesting that there might be a slight decrease in bipolar density in peripheral retina as compared to central retina, but a higher number of cells is required to establish this trend.
Our reanalysis of the far peripheral parasol cells from Lin et al. (Reference Lin, Martin, Solomon and Grünert2000, Reference Lin, Martin and Grünert2002) did not confirm the previously reported very low density of GluR4 puncta associated with these cells as compared to gephyrin puncta. In these early studies, the analysis was carried out using a microscope, equipped with a 50 W HBO mercury arc lamp(Osram, Augsburg, Germany), whereas in the later studies, we used a microscope with 100 W lamp and a higher sensitivity camera. Secondly, in these early studies, the density was calculated per unit dendritic length and not dendritic surface. Taken together, we are confident that the numbers for GluR4 presented here for the far peripheral cells are a more accurate reflection of synaptic density than those reported in Lin et al. (Reference Lin, Martin and Grünert2002).
In summary, our results are consistent with the idea that functional differences between ganglion cell types do not arise from variations in the densities of excitatory input (Jakobs et al., Reference Jakobs, Koizumi and Masland2008; Morgan et al., Reference Morgan, Schubert and Wong2008; Xu et al., Reference Xu, Vasudeva, Vardi, Sterling and Freed2008; Percival et al., Reference Percival, Jusuf, Martin and Grünert2009, Reference Percival, Martin and Grünert2011) but are determined by the type of bipolar cell providing the input (DeVries et al., Reference DeVries2006). It should however be noted that the density of the presumed bipolar input to ON parasol cells usually was higher than that to OFF parasol cells. The direction of this asymmetry is consistent with the functional asymmetry of synaptic input where ON parasol cells receive more tonic excitatory input than OFF parasol cells during constant light (Chichilnisky & Kalmar, Reference Chichilnisky and Kalmar2002; Trong & Rieke, Reference Trong and Rieke2008).
Ratio of excitatory to inhibitory input
For midget ganglion cells in central retina up to 16 degrees of visual angle, we found that the density of the presumed amacrine input is in the same range as that of the bipolar input determined previously (Jusuf et al., Reference Jusuf, Martin and Grünert2006; Eriköz et al., Reference Eriköz, Jusuf, Percival and Grünert2008). This result was confirmed by the analysis of five cells where we compared the density of gephyrin and GluR4 puncta directly. In conclusion, midget cells in central retina have comparable numbers of presumed bipolar and amacrine input. Similarly, EM studies of midget ganglion cells in human and macaque foveas show that midget cells receive about equal input from bipolar and amacrine cells (Kolb & DeKorver, Reference Kolb and DeKorver1991; Calkins et al., Reference Calkins and Sterling1994). Whether the same ratio applies for midget cells in far peripheral retina needs further investigation.
Parasol cells in central retina have comparable average densities of gephyrin and GluR4 IR puncta indicating that the ratio of amacrine to bipolar input is about equal. Consistently, the only EM study of a single OFF parasol cell in foveal retina found 42% amacrine input to this cell (Calkins & Sterling, Reference Calkins, Schein, Tsukamoto and Sterling2007).
When the number of GluR4 and gephyrin IR puncta associated with parasol cells are compared at a cell-to-cell basis, there was a tendency that the density of gephyrin increased more than that of GluR4. As mentioned above (Inhibitory input to midget and parasol cells section), our counts of presumed amacrine input might be an underestimate. Adding synapses containing the α1 subunit of the GABAA receptor (Macri et al., Reference Macri, Martin and Grünert2000) to our estimates would increase the proportion of inhibitory input. Consistently, previous EM studies found amacrine cells provide the dominant input to parasol cells in far peripheral retina: ON parasol: baboon, 80%, n = 5 cells (Jacoby et al., Reference Jacoby, Stafford, Kouyama and Marshak1996); macaque, 87%, n =1 cell (Marshak et al., Reference Marshak, Yamada, Bordt and Perryman2002); OFF parasol: macaque, 73%, n = 1 cell (Bordt et al., Reference Bordt, Hoshi, Yamada, Perryman-Stout and Marshak2006).
Conclusion
Although midget and parasol cells have distinct differences physiologically and anatomically, they do not show major differences in their density and arrangement of synaptic inputs. Hence, properties of ganglion cells in parvocellular and magnocellular pathways are more likely to be shaped from the properties of the presynaptic amacrine and bipolar cells (DeVries, Reference DeVries, Li and Saszik2000; Freed, Reference Freed2000) rather than cell class-specific synaptic distributions.
Acknowledgments
We thank Brett Szmajda and Peter Buzás for help with the retrograde injections and Julia Kaiser for excellent technical assistance with cell tracing. This work was supported by Project Grants from the National Health & Medical Research Council 454460 and 632640, and a Melbourne Research Scholarship from the University of Melbourne (K.A.P.) and the ARC Centre of Excellence in Vision Sciences.