1 Introduction
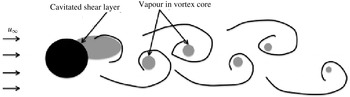
Cavitation is a phenomenon where liquid is abruptly converted into vapour when the pressure drops below the vapour pressure. Although cavitation on lifting bodies has been extensively studied both experimentally (e.g. Franc & Michel Reference Franc and Michel1988; Arndt et al. Reference Arndt, Song, Kjeldsen, He and Keller2000; Laberteaux & Ceccio Reference Laberteaux and Ceccio2001) and numerically (e.g. Kubota, Kato & Yamaguchi Reference Kubota, Kato and Yamaguchi1992; Coutier-Delgosha et al. Reference Coutier-Delgosha, Stutz, Vabre and Legoupil2007; Schnerr, Sezal & Schmidt Reference Schnerr, Sezal and Schmidt2008), relatively fewer studies exist for bluff bodies. Figure 1 shows the schematic of a low-Reynolds-number cavitating flow over a cylinder. As the liquid accelerates past the bluff body, pressure drops in the shear layer, resulting in cavitation inception. The shear layer then rolls up into vortices and, depending on the conditions, the vortices can also cavitate. These vortices are shed from the body into the relatively high-pressure region in the wake. Here the vapour in the vortices collapses, resulting in pressure waves (also referred to as shock waves by many authors), which propagate both downstream and upstream. Cavitation behind bluff bodies can be categorized into three types (Fry Reference Fry1984; Matsudaira, Gomi & Oba Reference Matsudaira, Gomi and Oba1992): cyclic, fixed and transitional cavitation. A cyclic cavity sheds from the body periodically. A major portion of a fixed cavity remains attached to the body while small portions shed from the trailing edge of the attached portion. A transitional cavity displays both of these phenomena.
Schematic of vortex shedding and vapour formation in flow over a circular cylinder at low Reynolds number.

While bluff-body wakes have been studied extensively for single-phase flows (e.g. Roshko Reference Roshko1961; Bearman Reference Bearman1969; Williamson Reference Williamson1988, Reference Williamson1989; Hammache & Gharib Reference Hammache and Gharib1991), only a few studies exist that shed light on the effect of cavitation on Kármán shedding and the near-wake characteristics. Varga & Sebestyen (Reference Varga and Sebestyen1972) studied cavitation behind a circular cylinder with the main objective of understanding the noise generated by cavitation in water tunnels. Brandner et al. (Reference Brandner, Walker, Niekamp and Anderson2010) conducted experiments on a sphere and observed periodic shedding caused by re-entrant jets. A few other studies (e.g. Rao, Chandrasekhara & Seetharamiah Reference Rao, Chandrasekhara and Seetharamiah1972; Rao & Chandrasekhara Reference Rao and Chandrasekhara1976; Selim Reference Selim1981) measured the shedding frequencies and cavity lengths in order to predict the effect of cavitation on the noise produced by a cavitating flow over a cylinder. Fry (Reference Fry1984) conducted detailed experiments on the flow past a cylinder to study the effect of free-stream velocity and cavitation number on the sound spectrum. He observed that the sound was correlated with the vortex shedding, and that larger cavities produced more sound upon collapse. Matsudaira et al. (Reference Matsudaira, Gomi and Oba1992) experimentally studied Kármán vortex cavities and found that regions of high impulse pressures occurred periodically behind the cylinder and were synchronized with the vortex shedding frequency. Balachandar & Ramamurthy (Reference Balachandar and Ramamurthy1999) studied the effect of cavitation on the base pressure coefficient and proposed a scaling based on wake parameters which unifies the wake pressure distribution for several cavitation numbers. Saito & Sato (Reference Saito and Sato2003) observed that cavities that collapse near solid walls generate high impact on the walls due to their proximity to the walls. They also observed three patterns of cavity collapse: three-dimensional (3D) radial, axial and two-dimensional (2D) radial. Seo, Moon & Shin (Reference Seo, Moon and Shin2008) used direct numerical simulation (DNS) to compute sound produced by a cavitating flow over a cylinder at
 $Re=200$
and found that the main source of noise in the cavitating flow was the collapse of vapour cavities.
The wakes of 2D wedges are another canonical configuration that have been studied experimentally, and differ from cylinder wakes in some respects. Young & Holl (Reference Young and Holl1966) measured vortex shedding frequency behind 2D symmetric wedges and concluded that cavitation had a negligible effect on the frequency when the cavitation number was decreased from inception to half the incipient value. They also found that the shedding frequency reduced as choking conditions were approached. The flow over a wedge is relatively independent of Reynolds number unlike flow over circular cylinders. Also the dependence of the shedding frequency on cavitation number is different. Rao & Chandrasekhara (Reference Rao and Chandrasekhara1976) observed that the vortex shedding frequency for cylinders increased to large values when choking conditions were approached. Also for symmetric wedges, the existence of a maximum in the variation of Strouhal number with cavitation number is well established (Young & Holl Reference Young and Holl1966; Belahadji, Franc & Michel Reference Belahadji, Franc and Michel1995) unlike that for cylinders.
Another class of interesting flow in the field of separated cavitating flows is flow over axisymmetric nose-shaped objects. The fundamental difference in these objects from a cylinder is that there is a boundary layer reattachment which modulates the adverse pressure gradient experienced by the cavity closure. Arakeri & Acosta (Reference Arakeri and Acosta1973) studied the effect of viscosity on cavitation inception on axisymmetric bodies and showed the presence of a laminar separation region upstream of the inception location. They also showed that the cavity became unstable and intermittent if the separation region was removed by tripping. Katz (Reference Katz1982, Reference Katz1984) studied cavitation on axisymmetric bodies that underwent laminar separation and demonstrated that surface pressure fluctuations are independent of Reynolds numbers much like flow over a symmetric wedge. He also showed that, for a hemispherical body, the separation zone was smaller when compared to that of cylinders and that the inception region is located within the reattachment zone. Arakeri (Reference Arakeri1975) developed a semi-empirical approach to predict the location of cavity detachment over smooth bodies undergoing laminar separation and obtained good predictions for flow over a sphere, and so did Franc & Michel (Reference Franc and Michel1985) for circular and elliptical cylinders.
The objective of this paper is to study the effect of cavitation on the near-wake characteristics of a cylinder. We consider two Reynolds numbers and four different cavitation numbers. Two interesting phenomena are observed: a low-frequency cavity detachment; and a reduction in vortex shedding frequency with decreasing cavitation number. In single-phase flows, Gerrard (Reference Gerrard1966) characterized vortex shedding frequency using two important length scales: the vortex formation length, and the wake diffusion width. Strykowski & Sreenivasan (Reference Strykowski and Sreenivasan1990) showed that introduction of a strategically placed control cylinder resulted in an increased diffusion, causing vortex shedding suppression. They showed that vortex shedding frequency can be reduced and eventually completely suppressed. Mittal & Raghuvanshi (Reference Mittal and Raghuvanshi2001) and Dipankar, Sengupta & Talla (Reference Dipankar, Sengupta and Talla2007) performed numerical studies that confirmed the control cylinder experiments. In this study, we analyse the effect of cavitation in reducing the vortex shedding frequency.
Also, the effect of cavitation nuclei which are included in the simulations in the form of initial vapour volume fraction is studied. Cavitation nuclei are known to play an important role in the inception process (Katz Reference Katz1984; Arndt & Maines Reference Arndt and Maines2000; Arndt Reference Arndt2002; Hsiao & Chahine Reference Hsiao and Chahine2005). Within the context of homogeneous mixture models, the initial vapour volume fraction determines the speed of sound which is very sensitive to vapour volume fraction values
 ${<}0.1$
. The dynamics of pressure waves may therefore be affected even in advanced stages of cavitation.
The Reynolds numbers considered in this study are 200 and 3900, which are low enough to allow parametric studies. It should be noted that these Reynolds numbers are low for any experimental measurement to be possible. A circular cylinder is chosen as the bluff body, since the Kármán shedding behind a cylinder is well understood for single-phase flows. The paper is organized as follows. Section 2 explains the physical model used for cavitation, along with the governing equations for the compressible mixture of water and water vapour. This section also describes the predictor–corrector algorithm (Gnanaskandan & Mahesh Reference Gnanaskandan and Mahesh2014, Reference Gnanaskandan and Mahesh2015) used to solve the governing equations. Section 3 validates the numerical algorithm for flow over a hemispherical nose-shaped body. Section 4 describes the problem and outlines details of the computational grid and boundary conditions. Section 5 discusses the effect of cavitation number and the mechanism of reduction of vortex shedding frequency. In § 6, the effect of initial void fraction is discussed in detail. A large-eddy simulation (LES) of turbulent
 $(Re=3900)$
flow over a cylinder is presented in § 7 and a summary in § 8 concludes the paper.
2 Governing equations and numerical method
Cavitation inception studies are often performed using the discrete Lagrangian approach, while developed cavitation simulations have traditionally preferred a continuum approach. The most commonly used physical model within the continuum approach is the homogeneous mixture model (e.g. Kunz et al. Reference Kunz, Boger, Stinebring, Chyczewski, Lindau, Gibeling, Venkateswaran and Govindan2000; Senocak & Shyy Reference Senocak and Shyy2002; Singhal et al. Reference Singhal, Athavale, Li and Jiang2002; Shin, Iwata & Ikohagi Reference Shin, Iwata and Ikohagi2003; Schmidt, Schnerr & Thalhamer Reference Schmidt, Schnerr and Thalhamer2009; Gnanaskandan & Mahesh Reference Gnanaskandan and Mahesh2015), which is used in the current simulations. The homogeneous mixture model assumes the mixture of constituent phases to be a single compressible fluid and the phases to be in thermal and mechanical equilibrium. Surface tension effects are assumed small and are neglected.
Although the homogeneous mixture approach is the most commonly used physical model to predict developed cavitation, there are some potential limitations with this model particularly pertaining to cavitation inception. Cavitation inception in homogeneous models depends only on the difference between local pressure and vapour pressure. However, other factors that influence inception such as non-condensible gases, size of nuclei and their distribution are not accounted for in this study. Further, discrete bubble dynamics on a scale smaller than the computational mesh are not represented. Overall, however, the dynamics of cavitation after inception are captured well by this model, as reflected in our simulations of flow over a hydrofoil and wedge (Gnanaskandan & Mahesh Reference Gnanaskandan and Mahesh2015) and in the validation case presented in § 3 of this paper.
The governing equations are the compressible Navier–Stokes equation for the mixture of liquid and vapour, along with a transport equation for vapour. The governing equations are Favre-averaged and then spatially filtered to perform LES. A dynamic Smagorinsky model is used for the subgrid terms. The unfiltered governing equations are
 $$\begin{eqnarray}\displaystyle \left.\begin{array}{@{}c@{}}\displaystyle \frac{\partial {\it\rho}}{\partial t}=-\frac{\partial }{\partial x_{k}}({\it\rho}u_{k}),\\ \displaystyle \frac{\partial {\it\rho}u_{i}}{\partial t}=-\frac{\partial }{\partial x_{k}}({\it\rho}u_{i}u_{k}+p{\it\delta}_{ik}-{\it\sigma}_{ik}),\\ \displaystyle \frac{\partial {\it\rho}e_{s}}{\partial t}=-\frac{\partial }{\partial x_{k}}({\it\rho}e_{s}u_{k}-Q_{k})-p\frac{\partial u_{k}}{\partial x_{k}}+{\it\sigma}_{ik}\frac{\partial u_{i}}{\partial x_{k}},\\ \displaystyle \frac{\partial {\it\rho}Y}{\partial t}=-\frac{\partial }{\partial x_{k}}({\it\rho}Yu_{k})+S_{e}-S_{c},\end{array}\right\} & & \displaystyle\end{eqnarray}$$
where
 ${\it\rho},u_{i},e_{s}$
and
 $p$
are the density, velocity, internal energy and pressure, respectively, of the mixture and
 $Y$
is the vapour mass fraction. The mixture density is
 $$\begin{eqnarray}{\it\rho}={\it\rho}_{l}(1-{\it\alpha})+{\it\rho}_{g}{\it\alpha},\end{eqnarray}$$
where
 ${\it\rho}_{l}$
is the density of liquid,
 ${\it\rho}_{g}$
is the density of vapour and
 ${\it\alpha}$
is the vapour volume fraction, which is related to the vapour mass fraction by
 $$\begin{eqnarray}{\it\rho}_{l}(1-{\it\alpha})={\it\rho}(1-Y)\quad \text{and}\quad {\it\rho}_{g}{\it\alpha}={\it\rho}Y.\end{eqnarray}$$
The system is closed using a mixture equation of state (Gnanaskandan & Mahesh Reference Gnanaskandan and Mahesh2015):
 $$\begin{eqnarray}p=Y{\it\rho}R_{g}T+(1-Y){\it\rho}K_{l}T\frac{p}{p+P_{c}}.\end{eqnarray}$$
Here,
 $R_{g}=461.6~\text{J}~\text{kg}^{-1}~\text{K}^{-1}$
,
 $K_{l}=2684.075~\text{J}~\text{kg}^{-1}~\text{K}^{-1}$
and
 $P_{c}=786.333\times 10^{6}~\text{Pa}$
are constants associated with the equation of state of vapour and liquid. The stiffened equation of state is used for water and the ideal gas equation of state for vapour. The stiffened equation of state has a form very similar to the ideal gas equation of state. It is suitable for liquids with non-isentropic changes and is hence chosen in this study. The expression for
 $e_{s}$
is given by
 $$\begin{eqnarray}{\it\rho}e_{s}={\it\rho}C_{vm}T+{\it\rho}(1-Y)\frac{P_{c}K_{l}T}{p+P_{c}},\end{eqnarray}$$
where
 $C_{vm}=(1-Y)C_{vl}+YC_{vg}$
and
 $C_{vl}$
and
 $C_{vg}$
are the specific heats at constant volume for liquid and vapour, respectively. The viscous stress
 ${\it\sigma}_{ij}$
and heat flux
 $Q_{i}$
are given by
 $$\begin{eqnarray}\displaystyle {\it\sigma}_{ij}={\it\mu}\left(\frac{\partial u_{i}}{\partial x_{j}}+\frac{\partial u_{j}}{\partial x_{i}}-\frac{2}{3}\frac{\partial u_{k}}{\partial x_{k}}{\it\delta}_{ij}\right)\quad \text{and}\quad Q_{i}=k\frac{\partial T}{\partial x_{i}}, & & \displaystyle\end{eqnarray}$$
where
 ${\it\mu}$
and
 $k$
are the mixture viscosity and mixture thermal conductivity, respectively. In addition,
 $S_{e}$
and
 $S_{c}$
are source terms for evaporation of water and condensation of vapour and are given by
 $$\begin{eqnarray}\displaystyle \left.\begin{array}{@{}c@{}}\displaystyle S_{e}=C_{e}{\it\alpha}^{2}(1-{\it\alpha})^{2}\frac{{\it\rho}_{l}}{{\it\rho}_{g}}\frac{\text{max}(p_{v}-p,0)}{\sqrt{2{\rm\pi}R_{g}T}},\\ \displaystyle S_{c}=C_{c}{\it\alpha}^{2}(1-{\it\alpha})^{2}\frac{\text{max}(p-p_{v},0)}{\sqrt{2{\rm\pi}R_{g}T}},\end{array}\right\} & & \displaystyle\end{eqnarray}$$
where
 $p_{v}$
is the vapour pressure, and
 $C_{e}$
and
 $C_{c}$
are empirical constants whose value is 0.1 (Saito et al.
Reference Saito, Takami, Nakamori and Ikohagi2007). Vapour pressure is related to temperature by
 $$\begin{eqnarray}p_{v}=p_{k}\exp \left[\left(1-\frac{T_{k}}{T}\right)(a+(b-cT)(T-d)^{2})\right],\end{eqnarray}$$
where
 $p_{k}=22.130~\text{MPa}$
,
 $T_{k}=647.31~\text{K}$
,
 $a=7.21$
,
 $b=1.152\times 10^{-5}$
,
 $c=-4.787\times 10^{-9}$
and
 $d=483.16$
.
The simulations use the algorithm developed by Gnanaskandan & Mahesh (Reference Gnanaskandan and Mahesh2015) to simulate cavitating flows on unstructured grids. The algorithm makes use of a novel predictor–corrector approach. In the predictor step, the governing equations are discretized using a symmetric non-dissipative scheme, where the fluxes at a cell face are given by
 $$\begin{eqnarray}{\it\phi}_{f_{c}}=\frac{{\it\phi}_{icv1}+{\it\phi}_{icv2}}{2}+\frac{1}{2}(\boldsymbol{{\rm\nabla}}{\it\phi}|_{icv1}\boldsymbol{\cdot }{\rm\Delta}\boldsymbol{x}^{icv1}+\boldsymbol{{\rm\nabla}}{\it\phi}|_{icv2}\boldsymbol{\cdot }{\rm\Delta}\boldsymbol{x}^{icv2}),\end{eqnarray}$$
where
 ${\rm\Delta}\boldsymbol{x}^{icv1}=\boldsymbol{x}_{f_{c}}-\boldsymbol{x}_{icv1}$
, and
 $\boldsymbol{{\rm\nabla}}{\it\phi}|_{icv1}$
denotes the gradient defined at
 $icv1$
, which is computed using a least-squares method. The viscous fluxes are split into compressible and incompressible contributions and treated separately. Once the fluxes are obtained, a predicted value
 $\widehat{q}_{j}^{n+1}$
is computed using an explicit Adams–Bashforth scheme:
 $$\begin{eqnarray}\widehat{q}_{j}^{n+1}=\widehat{q}_{j}^{n}+\frac{{\rm\Delta}t}{2}[3\,\text{RHS}_{j}(\widehat{\boldsymbol{q}}^{n})-\text{RHS}_{j}(\widehat{\boldsymbol{q}}^{n-1})],\end{eqnarray}$$
where
 $\text{RHS}_{j}$
denotes the
 $j$
th component of the right-hand side of the governing equations, and the superscript
 $n$
denotes the
 $n$
th time step. The final solution
 $q_{j}^{n+1}$
at
 $t+{\rm\Delta}t$
is obtained from a corrector scheme
 $$\begin{eqnarray}q_{j,cv}^{n+1}=\widehat{q}_{j,cv}^{n+1}-\frac{{\rm\Delta}t}{V_{cv}}\mathop{\sum }_{faces}(F_{f}^{\ast }n_{f})A_{f},\end{eqnarray}$$
where
 $F_{f}^{\ast }$
is the filter numerical flux of the following form:
 $$\begin{eqnarray}F_{fc}^{\ast }={\textstyle \frac{1}{2}}R_{fc}{\it\Phi}_{fc}^{\ast }.\end{eqnarray}$$
Here
 $R_{fc}$
is the right eigenvector at the face computed using the Roe average of the variables from left and right control volumes. The expression for the
 $l$
th component of
 ${\it\Phi}^{\ast }$
,
 ${\it\phi}^{\ast l}$
, is given by
 $$\begin{eqnarray}{\it\phi}_{fc}^{\ast l}=k{\it\theta}_{fc}^{l}{\it\phi}_{fc}^{l},\end{eqnarray}$$
where
 $k$
is an adjustable parameter and
 ${\it\theta}_{fc}$
is Harten’s switch function, given by
 $$\begin{eqnarray}\displaystyle {\it\theta}_{fc}=\sqrt{0.5(\widehat{{\it\theta}}_{icv1}^{2}+\widehat{{\it\theta}}_{icv2}^{2})},\quad \widehat{{\it\theta}}_{icv1}=\frac{|{\it\beta}_{fc}|-|{\it\beta}_{f1}|}{|{\it\beta}_{fc}|+|{\it\beta}_{f1}|},\quad \widehat{{\it\theta}}_{icv2}=\frac{|{\it\beta}_{f2}|-|{\it\beta}_{fc}|}{|{\it\beta}_{f2}|+|{\it\beta}_{fc}|}.\qquad & & \displaystyle\end{eqnarray}$$
Here,
 ${\it\beta}_{f}=R_{f}^{-1}(q_{icv2}-q_{icv1})$
is the difference between characteristic variables across the face. For
 ${\it\phi}^{\ell }$
, the Harten–Yee total variation diminishing (TVD) form is used as suggested by Yee, Sandham & Djomehri (Reference Yee, Sandham and Djomehri1999):
 $$\begin{eqnarray}\displaystyle \left.\begin{array}{@{}c@{}}{\it\phi}_{f_{c}}^{\ell }={\textstyle \frac{1}{2}}{\it\Psi}(a_{f_{c}}^{\ell })(g_{icv1}^{\ell }+g_{icv2}^{\ell })-{\it\Psi}(a_{f_{c}}^{\ell }+{\it\gamma}_{f_{c}}^{\ell }){\it\beta}_{f_{c}}^{\ell },\\ \displaystyle {\it\gamma}_{f_{c}}^{\ell }=\frac{1}{2}\frac{{\it\Psi}(a_{f_{c}}^{\ell })(g_{icv2}^{\ell }-g_{icv1}^{\ell }){\it\beta}_{f_{c}}^{\ell }}{({\it\beta}_{f_{c}}^{\ell })^{2}+{\it\epsilon}},\end{array}\right\} & & \displaystyle\end{eqnarray}$$
where
 ${\it\epsilon}=10^{-7}$
,
 ${\it\Psi}(z)=\sqrt{{\it\delta}+z^{2}}~({\it\delta}=1/16)$
is introduced for entropy fixing and
 $a_{f_{c}}^{\ell }$
is an element of the Jacobian matrix. Park & Mahesh (Reference Park and Mahesh2007) and Gnanaskandan & Mahesh (Reference Gnanaskandan and Mahesh2015) proposed a modification to Harten’s switch to accurately represent under-resolved turbulence for single-phase and multiphase flow mixtures, respectively, by multiplying
 ${\it\theta}_{f_{c}}$
by
 ${\it\theta}_{f_{c}}^{\star }$
given by
 $$\begin{eqnarray}\displaystyle \left.\begin{array}{@{}c@{}}{\it\theta}_{f_{c}}^{\star }={\textstyle \frac{1}{2}}({\it\theta}_{icv1}^{\star }+{\it\theta}_{icv2}^{\star })+|({\it\alpha}_{icv2}-{\it\alpha}_{icv1})|,\\ \displaystyle {\it\theta}_{icv1}^{\star }=\frac{(\boldsymbol{{\rm\nabla}}\boldsymbol{\cdot }\boldsymbol{u})_{icv1}^{2}}{(\boldsymbol{{\rm\nabla}}\boldsymbol{\cdot }\boldsymbol{u})_{icv1}^{2}+{\it\Omega}_{icv1}^{2}+{\it\epsilon}}.\end{array}\right\} & & \displaystyle\end{eqnarray}$$
Gnanaskandan & Mahesh (Reference Gnanaskandan and Mahesh2015) have evaluated this algorithm for a variety of flows, including a cavitating shock tube and turbulent cavitating flow over a hydrofoil and a wedge.
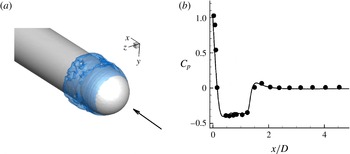
(a) Instantaneous isocontour
 $({\it\alpha}=0.1)$
of void fraction, and (b) time-averaged
 $C_{p}$
distribution (——, LES; ●, experiment of Rouse & McNown (Reference Rouse and McNown1948)).

3 Validation: cavitation over a hemispherical nose-shaped body
We consider partial cavitation over a hemispherical nose-shaped bluff body for validation. We compare our LES results to the experimental results of Rouse & McNown (Reference Rouse and McNown1948). The diameter of the hemisphere is
 $D$
and the length of the cylindrical body is
 $50D$
. The extent of the domain is
 $50D$
in all directions. The Reynolds number based on the diameter of the hemisphere and free-stream velocity is
 $Re_{D}=1.36\times 10^{5}$
and the cavitation number is 0.4. The grid spacing used is
 $0.002D$
in both streamwise and wall-normal directions and the grid is clustered close to the cavity inception region. A uniform grid spacing of
 $0.01D$
is used in the circumferential direction. The solution is initialized with a void fraction of
 ${\it\alpha}_{0}=0.01$
. The non-dimensional time step
 $tu_{\infty }/D=2\times 10^{-5}$
and the solution is advanced in a time-accurate manner. Figure 2(a) shows instantaneous isocontours of void fraction which vary in the circumferential direction and are unsteady in time. Figure 2(b) compares the time-averaged
 $C_{p}$
distribution to the experimental data (Rouse & McNown Reference Rouse and McNown1948); good agreement is obtained, indicating the suitability of the method in predicting bluff-body cavitation also.
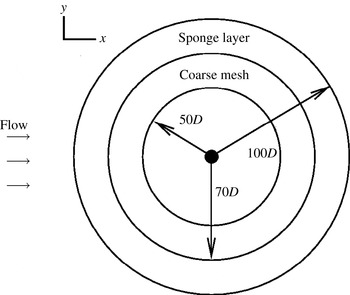
Computational domain illustrating sponge layer and region of coarse mesh (not to scale).

4 Problem description
Figure 3 shows a schematic of the problem. A circular cylinder of diameter
 $D$
is placed at the centre of a circular domain of radius equal to
 $100D$
, chosen to minimize acoustic reflection from the far-field boundaries. The free-stream flow is spatially uniform and the velocity is in the positive
 $x$
direction as shown in figure 3. The subscript
 $\infty$
is used to denote free-stream conditions and
 ${\it\rho}_{\infty },p_{\infty },u_{\infty }$
and
 ${\it\mu}_{\infty }$
denote free-stream density, pressure, velocity and dynamic viscosity, respectively. Free-stream conditions are imposed on all far-field boundaries. Acoustically absorbing boundary conditions (Colonius Reference Colonius2004) are applied in the sponge layer shown in figure 3. The term
 $-{\it\gamma}(\boldsymbol{q}-\boldsymbol{q}_{ref})$
is added to the governing equations, where
 ${\it\gamma}$
is zero outside the sponge layer,
 $\boldsymbol{q}$
denotes the vector of conservative variables and the subscript ‘
 $ref$
’ denotes the reference solution to which the flow inside the sponge layer is damped, which in this case is the free-stream value. Also the mesh is made coarse in the far field to further reduce any reflections.
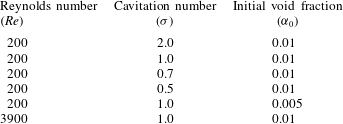
Flow conditions used in the simulations.

Table 1 lists the flow conditions for all the cases considered in this study. Here, cavitation number
 ${\it\sigma}=(p_{\infty }-p_{v})/(0.5{\it\rho}_{\infty }u_{\infty }^{2})$
and the Reynolds number is given by
 $Re=({\it\rho}_{\infty }u_{\infty }D)/{\it\mu}_{\infty }$
. The simulations are initialized with a spatially uniform void fraction
 $({\it\alpha}_{0})$
that nucleates the cavitation. Insensitivity to computational grid and domain size is demonstrated using two grids and two domain sizes for one case (
 $Re=200$
and
 ${\it\sigma}=1.0$
). The mesh spacing for the fine grid is
 $0.005D\times 0.01D$
in the radial and azimuthal directions near the wall and stretches to
 $0.03D\times 0.03D$
at approximately
 $2D$
downstream and then further stretches to
 $0.07D\times 0.07D$
at a distance of
 $5D$
downstream. The coarse grid has a near-wall mesh spacing of
 $0.01D\times 0.02D$
and stretches to
 $0.05D\times 0.05D$
at approximately
 $2D$
downstream. The corresponding domain radii are
 $100D$
and
 $50D$
, respectively.
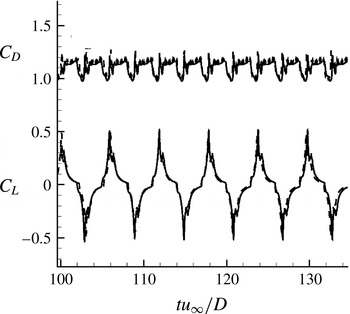
Comparison of lift and drag coefficient history showing grid convergence between two grids and domain insensitivity between two domains: – – – –, coarse grid, small domain; ——, fine grid, big domain.

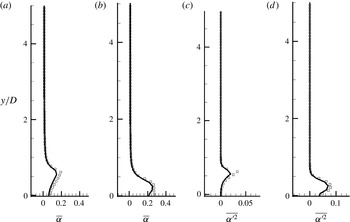
Comparison of (a,b) mean void fraction and (c,d) fluctuation in void fraction, for (a,c)
 $x/D=0.6$
and (b,d)
 $x/D=2.0$
: ——, fine grid, big domain; ▫, coarse grid, small domain.

Figure 4 shows the lift and drag coefficients as functions of time for both the grids. Figure 5 shows the comparison of the mean and fluctuation of void fraction between the two grids. Note that the solutions show good agreement, and the fine grid and the larger domain have therefore been used for all the subsequent simulations at
 $Re=200$
. The mesh spacing and the spanwise extent for the 3D simulation are the same as that in the simulation of Verma & Mahesh (Reference Verma and Mahesh2012) for a single-phase flow at the same Reynolds number, where good agreement was obtained with experiment. The near-wall mesh spacing is
 $0.002D\times 0.005D$
in size and stretches to
 $0.004D\times 0.008D$
at a downstream location of
 $5D$
. A total of 80 points are used in the spanwise direction. Since the presence of vapour decreases the effective Reynolds number, this resolution is deemed sufficient.
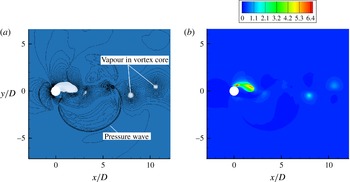
(a) Instantaneous snapshot showing coloured contours of void fraction and contour lines showing pressure. (b) Instantaneous Mach-number contour.

The nature of the instantaneous solution is illustrated in figure 6(a) using the
 $Re=200$
and
 ${\it\sigma}=1.0$
simulation. The void fraction contours show the presence of vapour immediately downstream of the cylinder as well as in the core of the Kármán vortices downstream. The superposed contour lines of pressure show the presence of ‘pressure waves’, which are compression waves that form when vapour pockets collapse in the higher-pressure regions downstream of the cylinder. The speed of sound drops significantly in regions of vapour, resulting in supersonic Mach numbers in some parts of the flow. Figure 6(b) reveals Mach numbers as high as 6 in the cavitated shear layer immediately downstream of the cylinder. The large spatial variation in sound speed results in the pressure waves refracting through the near-field vapour and impinging upon the cylinder. The
 $Re=3900$
flow exhibits similar qualitative behaviour and is discussed in § 7.
The effect of
 ${\it\sigma}$
on the time-averaged flow behind the cylinder as well as the unsteady loads on the cylinder are discussed below (§ 5) for
 $Re=200$
. The
 ${\it\sigma}=0.7$
and 0.5 flows exhibit a ‘low-frequency cavity detachment’ phenomenon, where a pocket of vapour attached to the cylinder sheds downstream. This behaviour is analysed in § 5.6. The
 ${\it\sigma}$
value also affects the Kármán vortex shedding frequency, which is discussed in § 5.7. The influence of
 ${\it\alpha}_{0}$
is considered in § 6, and LES of the
 $Re=3900$
flow is discussed in § 7.
5 Effect of cavitation number
 $({\it\sigma})$

Cavitating flows at three different cavitation numbers (
 ${\it\sigma}=1.0$
, 0.7 and 0.5) are considered and compared to the non-cavitating flow at
 ${\it\sigma}=2.0$
. The cavitation number is varied by changing the free-stream velocity while keeping all other quantities constant. The flow is seeded with a free-stream void fraction of
 ${\it\alpha}_{0}=0.01$
.
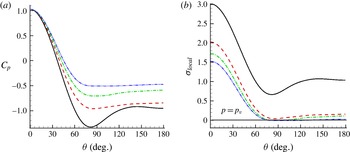
(a) Time-averaged
 $C_{p}$
on the cylinder, and (b) time-averaged distribution of
 ${\it\sigma}_{local}$
on the cylinder: ——,
 ${\it\sigma}=2.0$
; – – – –,
 ${\it\sigma}=1.0$
; – ⋅ – ⋅ –,
 ${\it\sigma}=0.7$
; — ⋅ ⋅ —,
 ${\it\sigma}=0.5$
.

5.1 Pressure on the cylinder surface
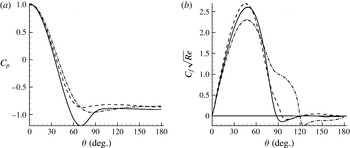
Figure 7(a) shows the mean pressure coefficient on the cylinder surface. Here,
 ${\it\theta}=0^{\circ }$
and
 $180^{\circ }$
correspond to the leading-edge stagnation point and trailing edge, respectively. In the absence of cavitation, the pressure coefficient decreases to its minimum value at approximately
 $80^{\circ }$
as the flow accelerates from the stagnation point, then increases as the flow decelerates, prior to becoming approximately constant in the wake region at the trailing edge. Cavitation is seen to decrease the magnitude of minimum
 $C_{p}$
, with lower values of
 ${\it\sigma}$
causing a larger decrease in magnitude. This is because, once flow cavitates (close to the minimum
 $C_{p}$
location), the pressure in the vapour region remains close to the vapour pressure; it does not further decrease with fluid acceleration. The upstream flow therefore sees lower values of favourable pressure gradient and the downstream flow experiences approximately constant pressure.
Defining
 ${\it\sigma}_{local}=2(p-p_{v})/{\it\rho}_{\infty }u_{\infty }^{2}$
and
 ${\it\sigma}_{\infty }=2(p_{\infty }-p_{v})/{\it\rho}_{\infty }u_{\infty }^{2}$
yields
 ${\it\sigma}_{local}=C_{p}+{\it\sigma}_{\infty }$
. Figure 7(b) reveals small values for
 ${\it\sigma}_{local}$
downstream of the minimum
 $C_{p}$
location on the cylinder surface for the cavitating flows. Also, for
 ${\it\sigma}=1.0$
the mean pressure is always above the vapour pressure, whereas for
 ${\it\sigma}=0.7$
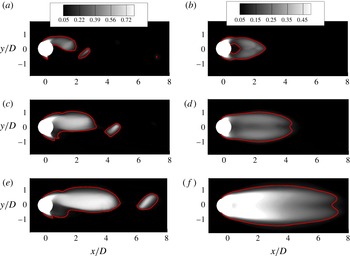
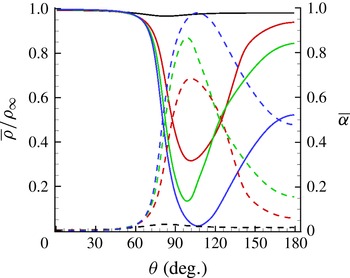
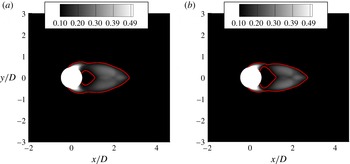
and 0.5, the mean pressure falls below the vapour pressure and recovers to values slightly above the vapour pressure near the trailing edge of the cylinder. High-density fluid can therefore be present near the trailing edge, in the mean flow. This behaviour is illustrated in figure 8, which shows contours of instantaneous and mean void fraction. Since, when
 ${\it\sigma}=1.0$
, only the instantaneous pressure falls below the vapour pressure, vapour is observed largely in the core of the Kármán vortices. In contrast, when
 ${\it\sigma}=0.7$
and 0.5, since the mean pressure in the near wake is also below the vapour pressure, vapour is also present in substantial portions of the near wake. Figure 9 shows the variation of mean void fraction and mixture density along the cylinder surface from the leading edge towards the trailing edge. Note the presence of higher-density fluid near the trailing edge, and that the mean void fraction is not necessarily 1 due to vapour unsteadiness. Although vapour decreases the density of the mixture, the density is still skewed towards the liquid due to its significantly higher value.
Instantaneous (a,c,e) and mean (b,d,f) void fraction contours for (a,b)
 ${\it\sigma}=1.0$
, (c,d)
 ${\it\sigma}=0.7$
and (e,f)
 ${\it\sigma}=0.5$
.

Variation of density (solid) and void fraction (dashed) along the cylinder surface as a function of azimuthal location:
 ${\it\sigma}=2.0$
(black),
 ${\it\sigma}=1.0$
(red),
 ${\it\sigma}=0.7$
(green),
 ${\it\sigma}=0.5$
(blue).

5.2 Velocity divergence due to cavitation
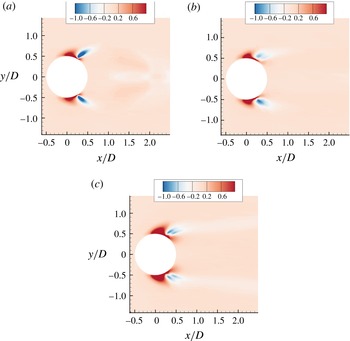
Cavitation causes density change, which implies a considerable change in the divergence of the velocity field. Figure 10 shows the mean velocity divergence
 $(\boldsymbol{{\rm\nabla}}\boldsymbol{\cdot }\boldsymbol{V})$
contours for all the cavitating cases. Expansion caused due to cavitation can be seen as positive divergence and, as the flow cavitates more, the region of positive
 $\boldsymbol{{\rm\nabla}}\boldsymbol{\cdot }\boldsymbol{V}$
also increases due to the increased amount of vapour. It is interesting to note a compression region (negative
 $\boldsymbol{{\rm\nabla}}\boldsymbol{\cdot }\boldsymbol{V}$
) downstream of the expansion region, and the magnitude of this compression region appears to decrease as the cavitation number reduces. This behaviour can be understood by revisiting the mean void fraction contours in figure 8. For
 ${\it\sigma}=1.0$
, there is a large decrease in void fraction corresponding to the region of negative divergence. This is a result of the cavitating vortex being shed from the body, which takes away vapour from close to the body, leading to a sharp decrease in void fraction in the mean. However, we observe that, for
 ${\it\sigma}=0.7$
and 0.5, the void fraction does not decrease as much as in
 ${\it\sigma}=1.0$
, since for these cases the cavitating vortex sheds from the attached cavity at a downstream location. Thus this compression region is an indication of some amount of vapour being converted back to water.
Contours of divergence of velocity field for (a)
 ${\it\sigma}=1.0$
, (b)
 ${\it\sigma}=0.7$
and (c)
 ${\it\sigma}=0.5$
.

5.3 Boundary layer on the cylinder surface
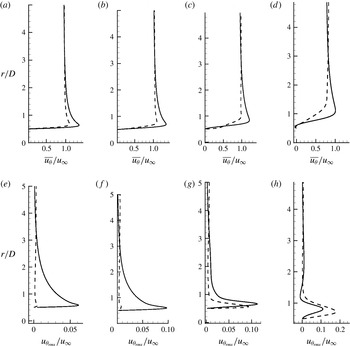
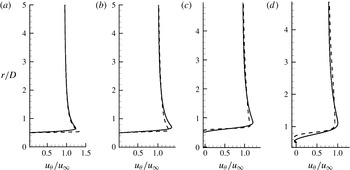
The pressure along the cylinder surface affects the evolution of the boundary layer. Figure 11 shows boundary layer velocity profiles at four different azimuthal locations for
 ${\it\sigma}=2.0$
and 0.5. Mean values are shown on top and root mean square values on the bottom. The azimuthal locations
 ${\it\theta}=70^{\circ }$
,
 $90^{\circ }$
,
 $110^{\circ }$
and
 $130^{\circ }$
are chosen to represent regions of favourable pressure gradient, minimum pressure, adverse pressure gradient and separated flow, respectively. Figure 11 contrasts only
 ${\it\sigma}=2.0$
(non-cavitating) and 0.5 (cavitating) cases for clarity. Here,
 $u_{{\it\theta}}$
is the tangential velocity and
 $r$
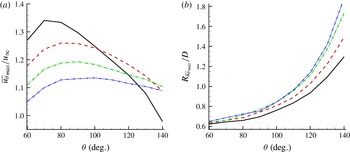
is the normal distance from the cylinder at any given azimuthal location. Cavitation causes expansion (positive dilatation) at the inception location, which causes the flow upstream to decelerate as seen in figure 11. For instance, the maximum velocity in the boundary layer (
 $u_{{\it\theta}_{max}}/u_{\infty }$
) drops to a value of 1.10 for
 ${\it\sigma}=0.5$
from a value of 1.34 for
 ${\it\sigma}=2.0$
at an azimuthal location of
 $70^{\circ }$
. The fluctuation levels of the cavitating flow are much lower at the first two locations, indicating that the flow becomes steady due to cavitation. The location where maximum velocity in the boundary layer occurs is also shifted away from the wall for the cavitating flow as a result. The magnitude of the maximum velocity in the boundary layer (
 $u_{{\it\theta}_{max}}$
) and the location of its occurrence are plotted as a function of
 ${\it\theta}$
in figure 12 for all four cases. Note that the boundary layer thickens with decreasing cavitation number. Also the magnitude of
 $u_{{\it\theta}_{max}}$
initially increases in the favourable pressure gradient region and then drops after
 $80^{\circ }$
. The drop in magnitude of
 $u_{{\it\theta}_{max}}$
is rapid for
 ${\it\sigma}=2.0$
after
 $90^{\circ }$
when compared to the cavitating flow, which points to a rapid thickening of the boundary layer leading to separation. The location of maximum velocity is shifted away from the wall as the flow cavitates more, and this difference between cavitating and non-cavitating flow increases further as we move closer to the trailing edge.
Mean (a–d) and root mean square (e–h) boundary layer profiles at four azimuthal locations
 ${\it\theta}=70^{\circ }$
(a,e),
 $90^{\circ }$
(b,f),
 $110^{\circ }$
(c,g) and
 $130^{\circ }$
(d,h): ——,
 ${\it\sigma}=2.0$
; and – – – –,
 ${\it\sigma}=0.5$
.

(a) Variation of maximum velocity in the boundary layer as a function of azimuthal location, and (b) variation of location of maximum velocity in the boundary layer as a function of azimuthal location: ——,
 ${\it\sigma}=2.0$
; – – – –,
 ${\it\sigma}=1.0$
; – ⋅ – ⋅ –,
 ${\it\sigma}=0.7$
; — ⋅ ⋅ —,
 ${\it\sigma}=0.5$
.

Time-averaged skin friction coefficient distribution on the cylinder: ——,
 ${\it\sigma}=2.0$
: – – – –,
 ${\it\sigma}=1.0$
; – ⋅ – ⋅ –,
 ${\it\sigma}=0.7$
; — ⋅ ⋅ —,
 ${\it\sigma}=0.5$
.

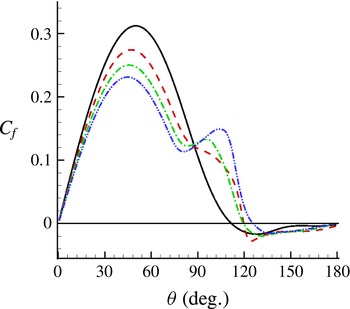
Figure 13 shows the time-averaged skin friction distribution along the cylinder. The magnitude of
 $C_{f}$
initially increases in the favourable pressure gradient region and then drops as the boundary layer thickens due to adverse pressure gradient. Note that the cavitating flows have a reduced skin friction value compared to
 ${\it\sigma}=2.0$
up to
 $80^{\circ }$
due to the deceleration caused by the vapour cavity. Flow expansion due to cavitation also causes the flow downstream of the inception location to accelerate. This can be seen in the form of a local increase in skin friction coefficient in figure 13 for
 ${\it\sigma}=1.0$
, 0.7 and 0.5 at approximately
 $80^{\circ }$
. The flow separates under the influence of adverse pressure gradient at approximately
 $110^{\circ }$
for
 ${\it\sigma}=2.0$
. The separation location for the cavitated flows, however, shifts downstream to approximately
 $120^{\circ }$
for
 ${\it\sigma}=1.0$
and 0.7 and to approximately
 $125^{\circ }$
for
 ${\it\sigma}=0.5$
. This behaviour is in contrast to the observations of Arakeri (Reference Arakeri1975) and Ramamurthy & Bhaskaran (Reference Ramamurthy and Bhaskaran1977), who found that the separation point moves upstream as the flow cavitates more. The main reason for this discrepancy is the fact that the homogeneous mixture model predicts that the inception point is upstream of the separation point. The cavitation criterion in the model is simply based on the difference between the local pressure and the vapour pressure, and hence cavitation occurs as soon as the pressure drops below the vapour pressure (although there is a finite rate at which vapour is produced). However, in reality, cavitation does not occur immediately at the location where the pressure drops below the vapour pressure, but occurs downstream of the separation point. In the numerical simulations, with the separation point downstream of the inception point, the acceleration induced by expansion pushes the separation point further downstream as the flow cavitates more. In contrast, in the experiments of Arakeri (Reference Arakeri1975) and Ramamurthy & Bhaskaran (Reference Ramamurthy and Bhaskaran1977), the separation point is ahead of the inception point and the cavitation-induced expansion causes flow deceleration upstream leading to an earlier separation.
Variation of (a)
 $\overline{{\it\alpha}}$
and (b)
 $\overline{{\it\alpha}^{\prime 2}}$
with downstream distance in the wake: ——,
 ${\it\sigma}=1.0$
; – – – –,
 ${\it\sigma}=0.7$
; – ⋅ – ⋅ –,
 ${\it\sigma}=0.5$
. (c) Variation of normalized cavity length with cavitation number: ——, experimental fit (Rao & Chandrasekhara Reference Rao and Chandrasekhara1976); ▫,
 $Re=200$
; ○,
 $Re=3900$
.

5.4 Cavity length
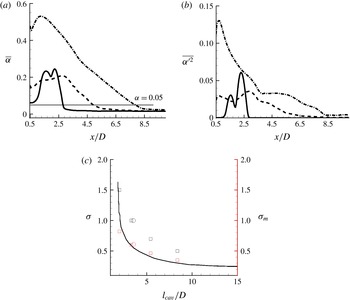
The mean cavity length increases progressively as the cavitation number decreases. The mean length of the cavity is computed from figure 14(a) as the location downstream where
 $\overline{{\it\alpha}}$
reaches a value of 0.05 after its initial increase. This figure also shows the maximum
 $\overline{{\it\alpha}}$
obtained in the near wake. As the cavitation number decreases, it is expected that more vapour will be formed in the wake. Interestingly, the
 $\overline{{\it\alpha}}_{max}$
is higher for
 ${\it\sigma}=1.0$
, when compared to
 ${\it\sigma}=0.7$
. This is due to the effect of the low-frequency cavity detachment when
 ${\it\sigma}=0.7$
, which will be discussed in detail in § 5.6. The root mean square values of void fraction are plotted in figure 14(b) and show a trend similar to the mean value. The mean cavity length as a function of cavitation number is shown in figure 14(c) and shows that the length increases as the cavitation number is reduced. The plot also shows the mean cavity length as a function of a modified cavitation number
 ${\it\sigma}_{m}=(p-p_{v})/(0.5{\it\rho}u_{max}^{2})$
. Here,
 $u_{max}$
is the maximum mean velocity in the boundary layer, which is obtained from figure 12(a). This modification was first suggested by Rao & Chandrasekhara (Reference Rao and Chandrasekhara1976), who observed that, when the mean cavity length was plotted against
 ${\it\sigma}$
, a family of curves were obtained for different Reynolds numbers for cavitating flow over a circular cylinder. Hence they introduced the modified cavitation number, which unified the different families of curves onto a single curve. We observe in figure 14(c) that the mean cavity length obtained at a lower Reynolds number also collapses onto this experimental fit if the modified cavitation number is used. Given that the experimental fit is obtained purely based on experiments at high Reynolds number (typically
 $10^{5}$
), it is interesting to see that the data from our low-Reynolds-number simulations also collapse onto this curve.
Lift and drag history (a–c) and their spectra (d–f) for (a,d)
 ${\it\sigma}=1.0$
, (b,e)
 ${\it\sigma}=0.7$
and (c,f)
 ${\it\sigma}=0.5$
: ——,
 $C_{L}$
; – – – –,
 $C_{D}$
.

5.5 Unsteady loads on the cylinder
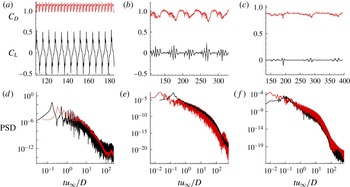
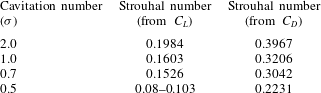
Figure 15 shows the unsteady characteristics of the flow in the form of lift and drag history and their corresponding spectra in the frequency domain. The Strouhal number (
 $fD/u_{\infty }$
, where
 $f$
is the vortex shedding frequency) computed from the lift and drag histories is tabulated in table 2. Further, it is also verified that the same shedding Strouhal number is obtained from the pressure history at three different points at
 $x/D=2.5$
, 5.0 and 10.0 along the wake centreline (not shown here). The lift and drag curve for
 ${\it\sigma}=1.0$
in figure 15(a,d) is periodic (but not sinusoidal as in a single-phase flow) and the cavitating vortices are shed at periodic intervals. The cavitating vortices in
 ${\it\sigma}=1.0$
shed directly from the body and hence this flow belongs to the cyclic cavitation category. The Strouhal number for
 ${\it\sigma}=1.0$
is reduced to 0.16 from a value of 0.19 for a single-phase flow at
 $Re=200$
. Apart from the primary peaks, which correspond to the pressure variation due to vortex shedding, smaller secondary peaks are also observed in the lift curve. These secondary peaks correspond to those instants when a pressure wave impinges on the cylinder. The lift and drag histories for
 ${\it\sigma}=0.7$
and 0.5 in figure 15(b,e) and (c,f) are quasi-periodic, with more than one frequency being observed. Further, the magnitude of the fluctuations is also reduced when compared to
 ${\it\sigma}=1.0$
, pointing to a more steady behaviour near the cylinder as the flow cavitates more. The cavitating vortex does not shed directly from the body as in
 ${\it\sigma}=1.0$
, but from the trailing edge of the cavity attached to the cylinder. The Strouhal number corresponding to this shedding is 0.15 for
 ${\it\sigma}=0.7$
. At
 ${\it\sigma}=0.5$
, the vortex shedding becomes intermittent and a peak is observed between Strouhal numbers of 0.08 and 0.11. Thus decreasing cavitation number has two main effects on the unsteady loads: vortex shedding frequency is reduced, the mechanism of which will be discussed in § 5.7; and the magnitude of unsteady loads on the cylinder is also reduced, pointing to a more steady behaviour near the cylinder.
Strouhal numbers obtained from lift and drag coefficient history.

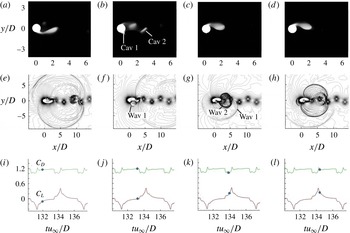
Figure 16 illustrates the dynamics of vapour cloud collapse and the subsequent pressure wave formation for
 ${\it\sigma}=1.0$
. This figure shows void fraction contours, pressure contours and the corresponding instant in the load cycle for various instants of time. Figure 16(a,e,i) shows the impending collapse of the vapour cavity and figure 16(b,f,j) shows the subsequent collapse of the cavity, leading to two separate smaller regions of vapour denoted as Cav 1 and Cav 2. This collapse causes a pressure wave (Wav 1) that propagates outwards. By this time, the separated cavity (Cav 2) also collapses, leading to another pressure wave (Wav 2), as shown in figure 16(c,g,k). Figure 16(d,h,l) shows the fully formed vapour cavity on the top half of the cylinder and this entire cycle repeats itself. This process of cloud collapse and pressure wave formation is similar for both
 ${\it\sigma}=0.7$
and 0.5, except for a low-frequency detachment of the vapour cavity in the wake in these two cases.
Vapour collapse dynamics for
 ${\it\sigma}=1.0$
.

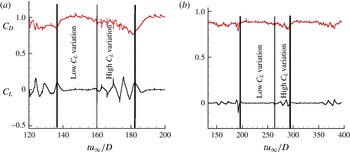
Time history of lift showing two phenomena in a single cycle for (a)
 ${\it\sigma}=0.7$
and (b)
 ${\it\sigma}=0.5$
: ——,
 $C_{L}$
; – – – –,
 $C_{D}$
.

5.6 Low-frequency cavity detachment in
${\it\sigma}=0.7$
and
$0.5$


For
 ${\it\sigma}=0.7$
and 0.5, in addition to the vortex shedding from the trailing edge of the attached cavity, the entire attached vapour cavity also gets detached as a part of the cycle. As a result, the near wake is cavitation-free for a small interval of time. For
 ${\it\sigma}=0.7$
this cavitation-free time period is approximately
 $20tu_{\infty }/D$
and for
 ${\it\sigma}=0.5$
it is approximately
 $30tu_{\infty }/D$
. The frequency corresponding to this detachment can be observed as a peak in the drag spectra in figure 15(b,c) and is computed to be 0.0218 for
 ${\it\sigma}=0.7$
and 0.0102 for
 ${\it\sigma}=0.5$
. The lift curves in figure 17(a,b) suggest that there are two distinct parts within one cycle: one with a relatively low variation in
 $C_{L}$
and another with a higher variation in
 $C_{L}$
. The first part with low
 $C_{L}$
variation corresponds to the time when the vapour cavity is attached to the body. Since the pressure in the vapour region is close to the vapour pressure, the variation in
 $C_{L}$
is very small. As the vapour cavity detaches, water in the wake causes higher variations in the lift coefficient.
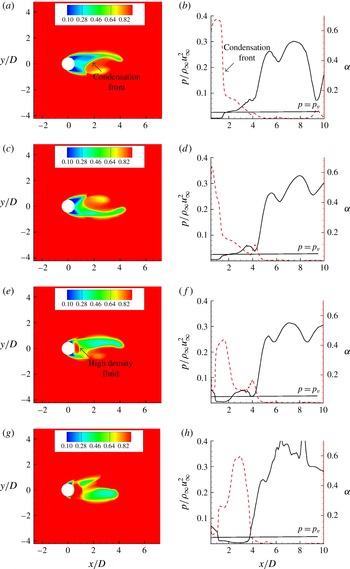
The mechanism behind this detachment is illustrated in figure 18, where a series of snapshots show the presence of a propagating condensation front that causes cavity detachment from the base of the cylinder. Figure 18(a,c) shows the propagation of the condensation front towards the low-pressure base. This causes the pressure in the base to increase, which can be seen as a small patch of high-density fluid near the base of the cylinder (figure 18
e). This causes the vapour cavity to detach, as seen in figure 18(g). The detached cavities advect downstream, leaving the near-wake cavitation free for a while. The presence of a condensation front can also be seen from the line plots in the figure. The pressure increase and the corresponding void fraction decrease close to
 $x/d=2.0$
seen in figure 18(b,d) is the condensation front. Figure 18(f,h) also shows the presence of high-density (low-void-fraction) fluid near the base once the cavity detaches.
The low-frequency cavity detachment in
 ${\it\sigma}=0.7$
means that the entire near wake is cavitation-free for a while. This effectively reduces the time-averaged void fraction in those regions where cavitation is absent during some part of the cycle. Hence the maximum time-averaged void fraction of
 ${\it\sigma}=0.7$
is lower than that of
 ${\it\sigma}=1.0$
, as seen in figure 14(a). This cavitation-free period is a substantial part of one cycle for
 ${\it\sigma}=0.7$
(
 $20tu_{\infty }/D$
out of
 $45tu_{\infty }/D$
) when compared to the
 ${\it\sigma}=0.5$
(
 $30tu_{\infty }/D$
out of
 $100tu_{\infty }/D$
) where the cavitation-free period is for a lesser amount of time in the cycle. Thus this effect is not pronounced in
 ${\it\sigma}=0.5$
when compared to
 ${\it\sigma}=0.7$
.
(a,c,e,g) Density contours at four time instants illustrating a propagating condensation front causing cavity detachment. (b,d,f,h) Variation of pressure and void fraction along the wake centreline at four time instants.

(a,c,e,g) Formation length and (b,d,f,h) instantaneous vorticity contour coloured with density for: (a,b)
 ${\it\sigma}=2.0$
,
 $l_{f}/D=1.45$
; (c,d)
 ${\it\sigma}=1.0$
,
 $l_{f}/D=2.35$
; (e,f)
 ${\it\sigma}=0.7$
,
 $l_{f}/D=4.19$
; and (g,h)
 ${\it\sigma}=0.5$
,
 $l_{f}/D=7.01$
.

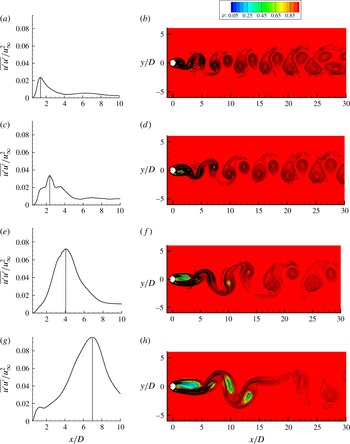
5.7 Mechanism of vortex shedding frequency reduction
At low Reynolds number, the vorticity transported into the wake from the boundary layers on the cylinder is diffused away from the shear layer predominantly by viscous action. As the Reynolds number increases, viscous diffusion alone cannot keep up with the increased vorticity production from the boundary layers, and so vortices break away at regular intervals, constituting vortex shedding (Strykowski & Sreenivasan Reference Strykowski and Sreenivasan1990). Gerrard (Reference Gerrard1966) observed vortex street formation to be a function of two length scales: the formation length and diffusion length. The formation length
 $l_{f}$
is defined as the distance downstream of the cylinder along the centreline where the streamwise velocity fluctuations are maximum, and the diffusion length
 $l_{d}$
is the width to which the free shear layers diffuse. He found that the vortex shedding frequency could be reduced if the shear layer vorticity was reduced over a critical diffusion length, which in turn increases the formation length.
In order to understand the mechanism of vortex shedding suppression due to cavitation, we first compute the formation length (
 $l_{f}$
) by plotting the streamwise velocity fluctuations in figure 19 for
 ${\it\sigma}=2.0$
, 1.0, 0.7 and 0.5. The formation length is seen to increase with decreasing cavitation number, which signifies a reduction in shedding frequency (Gerrard Reference Gerrard1966). It is also worthwhile to note that the magnitude of the streamwise velocity fluctuation also increases as the flow cavitates. This points to higher oscillations at the cavity closure as
 ${\it\sigma}$
is lowered. Also shown in figure 19 are the instantaneous vorticity contours, showing fewer vortices being shed over a given distance as the cavitation number is reduced.
Mean vorticity contour (a,b,e,h), mean baroclinic vorticity (c,f,i) and mean vorticity dilatation (d,g,j) for (a)
 ${\it\sigma}=2.0$
, (b–d)
 ${\it\sigma}=1.0$
, (e–g)
 ${\it\sigma}=0.7$
and (h–j)
 ${\it\sigma}=0.5$
.

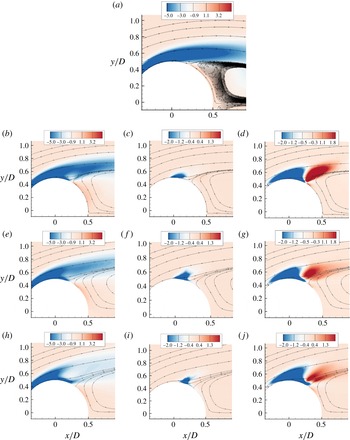
Figure 20 shows the mean vorticity distribution in the top half of the shear layer. The arguments presented here can be applied to the bottom half also by symmetry. Note that the magnitude of negative vorticity in the top shear layer decreases progressively as the cavitation number decreases. Thus cavitating flow has lesser vorticity across a given shear layer width and the reason for this reduction is explained below using the vorticity equation,
 $$\begin{eqnarray}\frac{\partial {\bf\omega}}{\partial t}=-(\boldsymbol{v}\boldsymbol{\cdot }\boldsymbol{{\rm\nabla}}){\bf\omega}+({\bf\omega}\boldsymbol{\cdot }\boldsymbol{{\rm\nabla}})\boldsymbol{v}-{\bf\omega}(\boldsymbol{{\rm\nabla}}\boldsymbol{\cdot }\boldsymbol{v})+\frac{1}{{\it\rho}^{2}}(\boldsymbol{{\rm\nabla}}{\it\rho}\times \boldsymbol{{\rm\nabla}}p)+\boldsymbol{{\rm\nabla}}\times \frac{\boldsymbol{{\rm\nabla}}\boldsymbol{\cdot }{\it\tau}}{{\it\rho}}.\end{eqnarray}$$
For a constant-density non-cavitating flow, the vorticity dilatation term
 $({\bf\omega}(\boldsymbol{{\rm\nabla}}\boldsymbol{\cdot }\boldsymbol{v}))$
and the baroclinic vorticity
 $((1/{\it\rho}^{2})(\boldsymbol{{\rm\nabla}}{\it\rho}\times \boldsymbol{{\rm\nabla}}p))$
terms are zero. However, for a cavitating flow, these values are non-zero. Figure 20 shows the contribution of the mean baroclinic vorticity term. At the inception location, baroclinic vorticity is produced because pressure becomes a function of both vapour mass fraction and density, thus causing a misalignment between pressure and density gradients. The baroclinic term produces more negative vorticity on the top half for all the cavitating cases thus increasing the total vorticity in the shear layer. The main reason for vorticity reduction is the vorticity dilatation term. As seen in figure 10, there is a large region of positive divergence (expansion) corresponding to the vapour region. The magnitude of vorticity dilatation is also shown in figure 20. Note that this term appears in the right-hand side of the vorticity equation with a negative sign. The blue region corresponds to vorticity dilatation, which reduces the vorticity in the shear layer. The compression region (discussed in § 5.2) causes the vorticity to increase downstream, shown as the red contours: however, the larger influence of the expansion region results in a net decrease in vorticity.
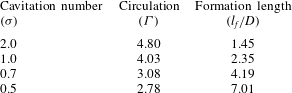
Values of circulation
 ${\it\Gamma}$
and formation length
 $l_{f}$
.

To quantify the extent of vorticity reduction, the circulation in the shear layer is computed as
 $\oint \boldsymbol{V}\boldsymbol{\cdot }\mathbf{d}\boldsymbol{l}$
over a rectangular domain from
 $0.5<x/D<4.0$
and
 $0<y/D<1.0$
, where the centre of the cylinder lies at the origin. As the flow cavitates more, the amount of circulation decreases, pointing to reduced vorticity in the shear layer. Table 3 lists the values of circulation and the corresponding formation lengths for all the cases. Thus the presence of vapour in the wake causes dilatation of vorticity, resulting in a reduction of the vortex shedding frequency.
6 Effect of initial void fraction
In this section, we discuss the effect of initial void fraction
 $({\it\alpha}_{0})$
on the flow field by simulating
 ${\it\sigma}=1.0$
flow with
 ${\it\alpha}_{0}=0.005$
and comparing it to
 ${\it\alpha}_{0}=0.01$
. The initial void fraction values of 1 % and 0.5 % are large compared to those used in controlled experiments. However, these values are chosen to reduce the acoustic stiffness of the system. The main effect of changing
 ${\it\alpha}_{0}$
is the change in free-stream speed of sound. At a temperature of
 $293~\text{K}$
and a pressure of 1 bar, the speed of sound in a mixture with
 ${\it\alpha}_{0}=0.01$
is
 $100.24~\text{m}~\text{s}^{-1}$
, while that at
 ${\it\alpha}_{0}=0.005$
is
 $141.07~\text{m}~\text{s}^{-1}$
. Hence pressure waves propagating in the medium will travel at these substantially different speeds, which would affect related phenomena. However, phenomena that are driven largely by inertia (e.g. cavitation in shear layer, vortex shedding) are not expected to vary significantly.
(a) Time-averaged
 $C_{p}$
distribution on the cylinder, and (b) time-averaged
 $C_{f}$
distribution on the cylinder: ——,
 ${\it\alpha}_{0}=0.01$
; ○,
 ${\it\alpha}_{0}=0.005$
.

6.1 Mean
$C_{p}$
and
$C_{f}$
distributions on the cylinder


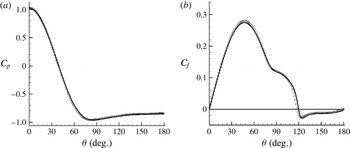
The time-averaged
 $C_{p}$
distribution and
 $C_{f}$
distribution are shown as a function of
 ${\it\theta}$
in figure 21(a,b) for both
 ${\it\alpha}_{0}=0.01$
and 0.005. Note that neither
 $C_{p}$
nor
 $C_{f}$
vary significantly for different
 ${\it\alpha}_{0}$
. The time-averaged load on a cylinder is predominantly due to the alternate vortex shedding, which is not affected significantly by change in acoustic speed. The inflection point (at
 ${\it\theta}=80^{\circ }$
) in the
 $C_{f}$
curve that indicates the cavity inception location (as discussed in § 5) also remains unchanged between the two flows. Figure 22 shows the mean void fraction contours for both the flows. The cavity shape and cavity length
 $(l_{cav}/D=2.71)$
remain largely unaffected. According to the continuity equation,
 $\partial u_{j}/\partial x_{j}=-(1/{\it\rho})(\text{D}{\it\rho}/\text{D}t)$
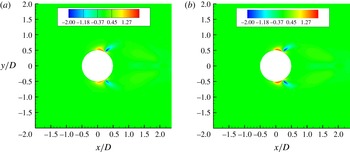
, the divergence of velocity depends on the material derivative of density. The main contribution to density change comes from the phase change, which has a time scale of its own due to the finite rate. Since phase change does not occur on the acoustic scale, changing the speed of sound does not significantly affect the divergence of velocity and hence its interplay with the boundary layer is also largely unaffected. Figure 23 shows contours of mean velocity divergence for both
 ${\it\alpha}_{0}=0.01$
and 0.005. The contours are identical, confirming the fact that velocity divergence is not affected by the initial void fraction.
Mean void fraction contour for (a)
 ${\it\alpha}_{0}=0.01$
and (b)
 ${\it\alpha}_{0}=0.005$
.

Mean velocity divergence contour for (a)
 ${\it\alpha}_{0}=0.01$
and (b)
 ${\it\alpha}_{0}=0.005$
.

6.2 Unsteady loads on the cylinder
The effect of changing
 ${\it\alpha}_{0}$
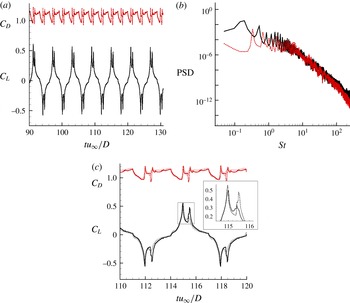
on the unsteady loads is investigated in figure 24(a,b). The lift and drag history shown in figure 24(a) is very similar to the
 ${\it\alpha}_{0}=0.01$
case (figure 15
a), and the corresponding shedding Strouhal number obtained in figure 24(b) is also unaltered. The only effect of reducing
 ${\it\alpha}_{0}$
below 0.005 is an increase in the speed of sound in the medium, effectively reducing the Mach number of the flow, which is not expected to affect the shedding characteristics significantly. Figure 24(c) shows a single lift and drag cycle for both the cases. It can be observed that the time period and the magnitude of the primary peak of the cycle are the same. However, the pressure wave impingement causes a higher pressure increase for
 ${\it\alpha}_{0}=0.005$
, leading to a larger secondary peak, as can be observed from the inset in figure 24(c). This implies that a stronger pressure wave is produced due to vapour collapse for
 ${\it\alpha}_{0}=0.005$
and this aspect is investigated further.
(a) Lift and drag history for
 ${\it\alpha}_{0}=0.005$
. (b) Power spectral density for
 ${\it\alpha}_{0}=0.005$
: ——,
 $C_{L}$
; – – – –,
 $C_{D}$
. (c) Comparison of a single lift and drag cycle: ○,
 ${\it\alpha}_{0}=0.01$
; and ——,
 ${\it\alpha}_{0}=0.005$
.

Pressure history at three different locations along the wake centreline for (a)
 ${\it\alpha}_{0}=0.01$
and (b)
 ${\it\alpha}_{0}=0.005$
: ——,
 $x/D=2.5$
; – – – –,
 $x/D=5.0$
; ○,
 $x/D=10.0$
.

6.3 Pressure waves due to cavity collapse
To understand the effect of
 ${\it\alpha}_{0}$
on pressure waves, the pressure history at three different locations (
 $x/D=2.5$
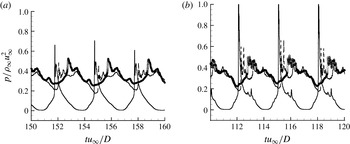
, 5.0 and 10.0) along the wake centreline is examined in figure 25 for both the flows. There are adequate numbers of time samples
 $({\approx}50)$
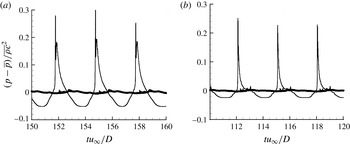
within each peak to resolve it accurately. Note that higher values for pressure peaks are obtained for
 ${\it\alpha}_{0}=0.005$
. This change in pressure can be explained as follows. For an inviscid, isentropic flow, the pressure perturbation due to an acoustic wave is
 $$\begin{eqnarray}p-\overline{p}=\overline{c}^{2}({\it\rho}-\overline{{\it\rho}})=\overline{{\it\rho}}\,\overline{c}^{2}S=Z\,\overline{c}S,\end{eqnarray}$$
where
 $\overline{c}$
is the mean speed of sound,
 $Z\equiv \overline{{\it\rho}}\,\overline{c}$
is the acoustic impedance and
 $S\equiv ({\it\rho}-\overline{{\it\rho}})/\overline{{\it\rho}}$
is the condensation ratio. The time history of pressure perturbation scaled by
 $\overline{{\it\rho}}\,\overline{c}^{2}$
is shown in figure 26(a,b) for both the cases. It can be observed that the peak values of the scaled pressure perturbation are similar for both the flows, indicating similar values of condensation ratio
 $S$
. To obtain the same condensation ratio in a less compressible medium (higher
 $Z$
and
 $\overline{c}$
), a higher pressure rise would be required, explaining the larger pressure peaks for
 ${\it\alpha}_{0}=0.005$
. Thus the major consequence of changing
 ${\it\alpha}_{0}$
seems to be to produce a pressure wave that has a higher pressure rise across it, but produces the same amount of density change in the medium. The similarity in
 $S$
for both
 ${\it\alpha}_{0}$
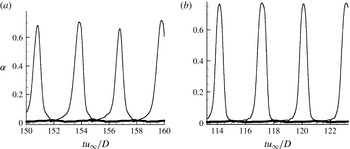
can be explained using figure 27, which shows the vapour volume fraction history corresponding to the pressure history in figures 25 and 26. The vapour volume fraction drops from a value of approximately 0.6 to the free-stream value at the time instant where the pressure spike occurs in figure 25. Since the free-stream values are at least an order of magnitude less (0.01 and 0.005) than 0.6, the change in vapour volume fraction produced is almost the same for both the flows, which explains the density change also being similar for both the flows.
Change in condensation ratio at three different locations along the wake centreline for (a)
 ${\it\alpha}_{0}=0.01$
and (b)
 ${\it\alpha}_{0}=0.005$
: ——,
 $x/D=2.5$
; – – – –,
 $x/D=5.0$
; ○,
 $x/D=10.0$
.

Time history of vapour volume fraction at three different locations along the wake centreline for (a)
 ${\it\alpha}_{0}=0.01$
and (b)
 ${\it\alpha}_{0}=0.005$
: ——,
 $x/D=2.5$
; – – – –,
 $x/D=5.0$
, ○,
 $x/D=10.0$
.

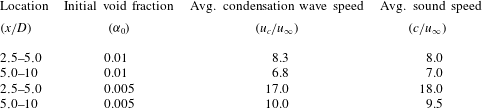
The difference in the average speed of a pressure wave as it travels between two points can also be observed from figure 25. Waves move faster when
 ${\it\alpha}_{0}=0.005$
due to the higher speed of sound. The average speed of the pressure wave is computed and tabulated along with the average speed of sound in table 4. To compute these quantities it is assumed that the speed does not change between the probe locations. Although this assumption is not strictly valid, it gives a sense of the propagation speed of the pressure waves with respect to the sound speed (
 $c$
). The expression for the speed of sound in a liquid–gas mixture is obtained using the equation of state and Gibbs equation and is given by
 $$\begin{eqnarray}\displaystyle \left.\begin{array}{@{}c@{}}\displaystyle c^{2}=\frac{C_{1}T}{C_{0}-{\displaystyle \frac{C_{1}}{C_{pm}}}},\\ \displaystyle C_{0}=1-(1-Y){\it\rho}K_{l}T{\displaystyle \frac{P_{c}}{(p+P_{c})^{2}}},\\ \displaystyle C_{1}=R_{g}Y-K_{l}(1-Y){\displaystyle \frac{P}{p+P_{c}}},\\ \displaystyle C_{pm}=YC_{pg}+(1-Y)C_{pl}.\end{array}\right\} & & \displaystyle\end{eqnarray}$$
The relationship used for the speed of sound follows the established dependence of sound speed on void fraction (Gnanaskandan & Mahesh Reference Gnanaskandan and Mahesh2015). It is observed that the pressure waves travel almost at the local speed of sound in the medium.
Average speed of pressure wave and sound speed.

Comparison of pressure fluctuation (
 $\overline{p^{\prime 2}}$
) contour for (a) non-cavitating flow, and cavitating flow with (b)
 ${\it\alpha}_{0}=0.01$
and (c)
 ${\it\alpha}_{0}=0.005$
.

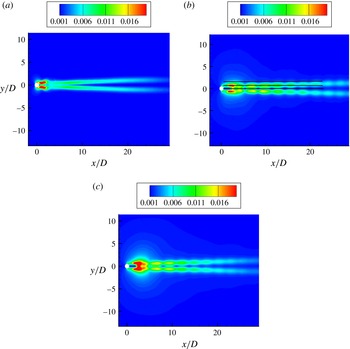
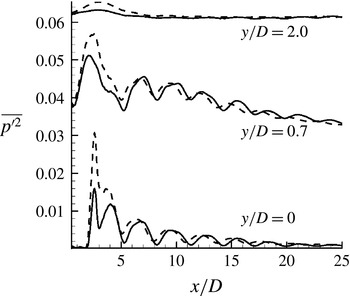
Pressure fluctuation levels of the two cavitating flows are compared to the pressure fluctuations in a non-cavitating flow in figure 28. The difference in the contours downstream of the cylinder on either side of the centreline is evident. The ‘cell’-shaped structures formed in the cavitating cases (figure 28
b,c) are the result of the pressure fluctuations caused by the pressure waves due to cavity collapse, which are absent in a single-phase flow. The structures are localized in space due to the fact that the pressure wave impinges with the vortices only at specific points in space. This interaction causes the residual vapour in the vortex core to collapse, leading to a momentary increase in pressure followed by a recovery back to a lower pressure due to the rotation of the vortices. Since this happens until the pressure waves decay and the vapour in the vortices is destroyed completely, a train of ‘cell’-shaped structures can be observed until approximately
 $20D$
. Such behaviour would be absent if the wake only had advecting vortices or propagating pressure waves: it is a result of their interaction. Figure 29 shows the variation of pressure fluctuations along the streamwise direction at three different
 $y$
locations as marked in figure 28(b) for both the cavitating flows. Both the wake centreline plot
 $(y/D=0.0)$
and the cut through the vortex core
 $(y/D=0.7)$
show several cycles of cavity growth and collapse, and in each cycle the crest corresponds to the collapse of a bubble and each trough is the cavity at its maximum regrown state. The absence of vapour at
 $y/D=2.0$
means that pressure fluctuation change is not as substantial as inside the vortices. The propagation speed of the wave is also different and can be observed from the figure. Owing to a larger speed of sound, the pressure wave for
 ${\it\alpha}_{0}=0.005$
travels faster and impinges with the vortex at a more upstream location than in the
 ${\it\alpha}_{0}=0.01$
flow.
Comparison of pressure fluctuations as a function of downstream distance at three different locations in the wake: ——,
 ${\it\alpha}_{0}=0.01$
; – – – –,
 ${\it\alpha}_{0}=0.005$
. The curves at
 $y/D=0.7$
and
 $y/D=2.0$
have been shifted along the
 $y$
axis by 0.03 and 0.06, respectively.

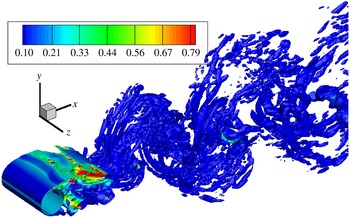
Isocontours of
 $Q=2$
coloured by void fraction.

7 Large-eddy simulation of turbulent cavitating flow at
$Re=3900$

LES of turbulent cavitating flow at
 $Re=3900$
and
 ${\it\alpha}_{0}=0.01$
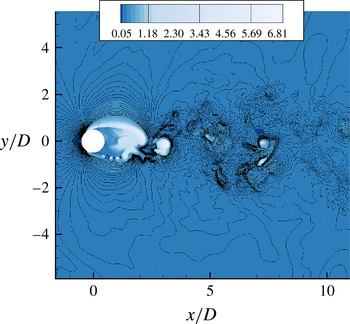
is performed. The topology used for the simulation is similar to the lower-Reynolds-number cases; the grid however is 3D and more refined in the near wake. The averaged statistics are obtained over 10 shedding cycles and satisfactory convergence is obtained in the near-wake region. The number of samples is further increased by averaging along the spanwise direction and also about the wake centreline to improve convergence. Figure 30 shows the instantaneous vortical structures in the form of Q-criterion coloured by void fraction; 3D flow structures of varying scales can be observed. The shear layer breaks up into smaller spanwise structures. The flow structures in the near wake, especially in the vapour cavity, appear to be larger when compared to the flow structures observed by Verma & Mahesh (Reference Verma and Mahesh2012) (figure 16 in their paper) in single-phase flow. This is because of the effective lowering of Reynolds number by the presence of vapour. Further, small vapour pockets can be seen trapped in the smaller-scale vortices downstream of the wake. Although the flow is 3D inside the vapour cavity immediately downstream, breakdown to finer scales occurs downstream of the cavity closure. Figure 31 shows instantaneous contours of Mach number, showing supersonic Mach numbers in the shear layer. Cavitation in wake vortices also causes locally supersonic Mach numbers there. The contour lines of pressure show distorted fronts of pressure waves. Turbulence causes different points in the wave fronts to have different speeds, resulting in their distortion.
Instantaneous Mach-number contours superimposed with lines of pressure.

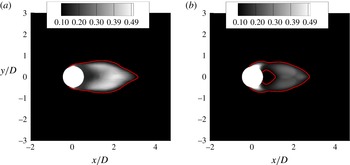
Mean void fraction contour for (a)
 $Re=3900$
and (b)
 $Re=200$
.

7.1 Comparison of
$Re=3900$
cavitating flow to
$Re=200$
cavitating flow


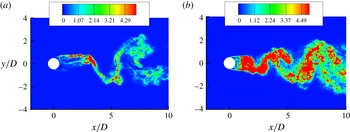
Figure 32 compares the mean void fraction for
 $Re=3900$
to the
 $Re=200$
flow. There are minor differences in the cavity shape; the major change, however, is the fact that vapour is distributed uniformly in the wake for the turbulent case as opposed to only in the vortices for the laminar case. The length of the cavity
 $(l_{cav}/D)$
is 3.04 for the high-Reynolds-number flow, while it is only 2.71 for the low-Reynolds-number flow. Also note the presence of a larger fraction of vapour in the wake for
 $Re=3900$
. Thus increasing Reynolds number at the same cavitation number makes the flow cavitate more, resulting in a larger cavity dimension. This observation is also in line with that of Rao & Chandrasekhara (Reference Rao and Chandrasekhara1976). The presence of an increased amount of vapour also affects the
 $C_{p}$
and
 $C_{f}$
distributions. Figure 33(a,b) compares the time-averaged
 $C_{p}$
and
 $C_{f}$
distributions of
 $Re=3900$
at
 ${\it\sigma}=1.0$
with the
 $Re=200$
flow at the same cavitation number. Also shown in the figure are the
 $C_{p}$
and
 $C_{f}$
distributions from the single-phase flow at
 $Re=3900$
, which will be discussed in § 7.2. When compared to the
 $Re=200$
flow, the minimum
 $C_{p}$
location is shifted upstream, pointing to the inception location moving upstream. The magnitude of the minimum
 $C_{p}$
is also reduced in the
 $Re=3900$
flow, which is also consistent with the increased amount of vapour. The
 $C_{f}$
curve for the
 $Re=3900$
flow in figure 33(b) shows a different behaviour when compared to the
 $Re=200$
flow. The main difference is that there is a marked difference in the inflection point in the
 $C_{f}$
curve. This is due to the fact that the deceleration upstream of the inception location and acceleration downstream of inception caused by cavitation explained in § 5.3 is subdued at
 $Re=3900$
when compared to
 $Re=200$
due to 3D effects. This also results in the separation location being shifted upstream
 $(95^{\circ })$
for the
 $Re=3900$
flow since the acceleration effect present in the
 $Re=200$
flow is now reduced.
(a) Time-averaged
 $C_{p}$
distribution along the cylinder and (b) time-averaged
 $C_{f}$
distribution along the cylinder: ——,
 $Re=3900$
single-phase flow; – – – –,
 $Re=3900$
cavitating flow; and – ⋅ – ⋅ –,
 $Re=200$
cavitating flow.

Boundary layer profile at four azimuthal locations of (a)
 ${\it\theta}=70^{\circ }$
, (b)
 $90^{\circ }$
, (c)
 $110^{\circ }$
and (d)
 $130^{\circ }$
: ——,
 $Re=200$
; and – – – –,
 $Re=3900$
.

The mean boundary layer evolution of the high-Reynolds-number flow is compared with the low-Reynolds-number flow in figure 34. At an azimuthal location of
 $70^{\circ }$
, the
 $Re=3900$
flow has a higher magnitude for maximum velocity, which is consistent with the reduced amount of deceleration due to cavitation inception. Further, the location of maximum velocity is also shifted closer to the wall for the
 $Re=3900$
flow. The maximum velocity at
 $90^{\circ }$
is lower for
 $Re=3900$
since the flow is closer to the separation point and is decelerating much more than the
 $Re=200$
flow at the same location. The flow separates at approximately
 $95^{\circ }$
and instances of separated flow can be observed at the downstream locations.
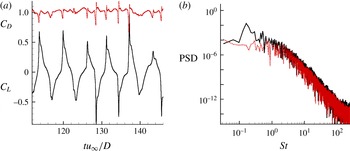
The lift and drag history and their power spectral density are plotted in figure 35. The secondary peaks due to pressure wave impingement are not as prominent as they were in the
 $Re=200$
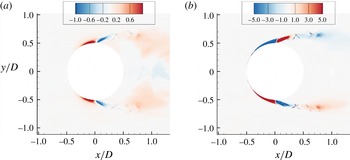
flow. The presence of an increased amount of vapour in the wake presumably reduces the effect of pressure wave impingement. The Strouhal number corresponding to vortex shedding frequency is 0.167, and the reason for the Strouhal number reduction from the single-phase value of 0.2 is very similar to that for the 2D flow and is depicted in figure 36(a,b). The mean velocity divergence contour shows an expansion region corresponding to vapour formation. A compression region is found immediately downstream of the expansion similar to the
 $Re=200$
flow. The expansion region causes vorticity dilatation that can be observed in figure 36(b). As in the
 $Re=200$
flow, this vorticity dilatation is the main reason for the vorticity reduction which reduces the vortex shedding frequency.
(a) Lift and drag coefficient history, and (b) power spectral density: ——,
 $C_{L}$
; – – – –,
 $C_{D}$
.

(a) Mean velocity divergence contour. (b) Mean vorticity dilatation contour.

Comparison of vertical profiles at streamwise stations downstream of the cylinder at
 $Re=3900$
: ●, Verma & Mahesh (Reference Verma and Mahesh2012); ——, present results.

7.2 Comparison of
$Re=3900$
cavitating flow to
$Re=3900$
non-cavitating flow


Figure 35(a,b) also compares the
 $C_{p}$
and
 $C_{f}$
distributions of
 $Re=3900$
cavitating flow with that of the single-phase results of Verma & Mahesh (Reference Verma and Mahesh2012) at the same Reynolds number. Cavitation decreases the magnitude of minimum
 $C_{p}$
when compared to the single-phase
 $C_{p}$
and the flattening of the
 $C_{p}$
curve is due to the presence of vapour, similar to the discussion in § 5.1. The
 $C_{f}$
curve comparison shows that the separation location is shifted downstream compared to the single-phase flow. The reason for this shift is the same as discussed in § 5.3.
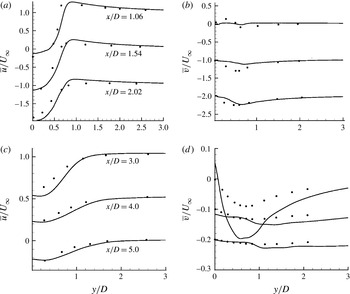
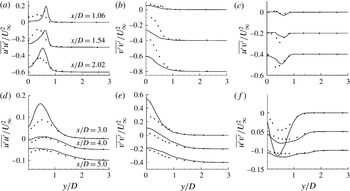
Figures 37 and 38 compare the mean velocity profiles and turbulence intensity profiles, respectively, in the wake for the cavitating case at
 $Re=3900$
to the single-phase results of Verma & Mahesh (Reference Verma and Mahesh2012) at the same Reynolds number. The streamwise velocity profiles at all stations show a wider wake profile for the cavitating flow. The station
 $x/D=3.0$
shows the maximum difference in the vertical velocity profile since it corresponds to the cavity closure region. Inside the cavity (except at
 $x/D=1.06$
), larger values of vertical velocity are obtained. The maximum value for
 $\overline{u^{\prime }u^{\prime }}$
occurs downstream
 $(x/D=3.0)$
, pointing to a larger formation length. Inside the cavity, the values for
 $\overline{v^{\prime }v^{\prime }}$
are much smaller than those obtained for the single-phase flow. However, the cavity closure at
 $x/D=3.0$
is highly unsteady with higher fluctuation values in both streamwise and vertical velocities. The
 $\overline{u^{\prime }v^{\prime }}$
curve shows a similar trend to the mean vertical velocity profiles. Overall, cavitation seems to have delayed the complete 3D breakdown of the Kármán vortices by effectively lowering the Reynolds number in the wake. This fact is corroborated in figure 39, which shows the instantaneous magnitude of vortex stretching in the symmetry plane for the multiphase and single-phase flows. Note that the vortex stretching magnitude in the wake is reduced in a cavitating flow. Hence formation of vapour suppresses turbulence, yielding highly correlated spanwise structures in the near wake in figure 30.
Comparison of vertical profiles at streamwise stations downstream of the cylinder at
 $Re=3900$
: ●, Verma & Mahesh (Reference Verma and Mahesh2012); ——, present results.

Magnitude of vortex stretching in the symmetry plane for (a) cavitating flow and (b) non-cavitating flow.

8 Summary
A numerical method based on the homogeneous mixture model and characteristic-based filtering is used to study cavitation on a circular cylinder at two Reynolds numbers and several cavitation numbers. The simulated cavitation numbers correspond to two different regimes based on how the cavity is shed into the wake. The dynamics of cavity formation and collapse leading to pressure waves is captured in the simulations and discussed in detail. A scaling for cavitation number based on maximum velocity in the shear layer is found to collapse the cavity length as a function of cavitation numbers at different Reynolds numbers onto a single curve. In the cyclic regime
 $({\it\sigma}=1.0)$
of cavitation, the cavity detaches from the body itself at the shedding frequency, while in the transitory regime of cavitation (
 ${\it\sigma}=0.7$
and 0.5), a low-frequency cavity detachment phenomenon is observed in addition to the shedding frequency. Cavitation is found to significantly modify the vortex shedding frequency, and vorticity dilatation due to vapour is found to be responsible for this shedding frequency reduction. This effect is further verified by computing circulation in the wake, which shows that vorticity reduces as the cavitation number is lowered.
The effect of initial void fraction is assessed. It is found that changing the initial void fraction does not affect the general dynamics of cavity formation. However, the speed of sound is altered significantly and this leads to pressure waves travelling at different speeds. The compressibility and acoustic impedance of the medium are altered but the condensation ratio in the medium shows a similarity for different free-stream void fraction values. The pressure fluctuation contours show spatially local phenomenon due to the interaction between condensation waves and vortices at specific locations in space.
Finally, LES of cavitating flow at
 $Re=3900$
reveals that the length of the mean cavity obtained at higher Reynolds number is higher than that at low Reynolds number for the same cavitation number. The vortex shedding frequency is again lower compared to a single-phase shedding frequency and vorticity dilatation is again found to be an important factor in reducing the vorticity in the wake. Cavitation effectively reduces the Reynolds number in the near wake, suppresses turbulence and delays the 3D breakdown of Kármán vortices.
Acknowledgements
This work was supported by the United States Office of Naval Research under ONR grant N00014-11-1-0497 with Dr K.-H. Kim as technical monitor. Computing resources were provided by the Arctic Region Supercomputing Center of HPCMP and the Minnesota Supercomputing Institute.