Implications
Pigs are estimated to waste up to 0.5% of the ingested dietary energy as methane. Different sources of dietary fiber altered the methanogenic community, such that Methanobrevibacter species were more prevalent in the hindgut of gilts fed a low-fiber diet (wheat bran) as compared with those fed a high-fiber diet (ground rice hull). It is speculated that rice hull, being less digestible, contains tannins that are known to suppress methanogens and decrease methane production. Understanding methanogen ecology in the hindgut of pigs may lead to improving their dietary utilization and decreasing their impact on the environment.
Introduction
As a greenhouse gas, methane (CH4) emission not only contributes to global warming, but it also represents an energy loss for the animal. However, studies on the role of enteric methane have mostly focused on ruminant livestock and there is a tendency to overlook the significance of the microbial fermentation in monogastric animals, even though the digestive tract of the latter is also quite complex (Jensen, Reference Jensen1996). Methane emission represents a loss of 0.2%–0.5% of dietary gross energy in pigs (Jørgensen, Reference Jørgensen2011). Furthermore, it was shown in a humanized gnotobiotic mouse model that methanogens play an important role in energy metabolism (Samuel and Gordon, Reference Samuel and Gordon2006), because methanogens are of great importance in carbon cycling and alternative energy production (Steinberg and Regan, Reference Steinberg and Regan2009). Thus, understanding the ecology of gastrointestinal methanogens in pigs may lead to improving their dietary utilization and reducing the negative impact of enteric methane on the environment.
Methanogens have strict nutritional requirements, and quantitation with culture-based methods is time-consuming and biased against methanogen groups that are difficult to cultivate in laboratory. To the best of our knowledge, we are aware of only one report on the isolation of methanogens from feces of pig (Miller et al., Reference Miller, Wolin and Kusel1986). For these reasons, methanogens are typically studied through culture-independent molecular techniques (Wright et al., Reference Wright, Williams, Winder, Christophersen, Rodgers and Smith2004; Jennifer et al., Reference Jennifer, David, Wang and Ellender2007; Mao et al., Reference Mao, Yang and Zhu2011). However, very little information is available on the methanogen community in the gut of pigs. Based on cell wall composition, the strains isolated from pig feces appeared to belong to the genus Methanobrevibacter (Miller et al., Reference Miller, Wolin and Kusel1986). Methanogens belonging to the family Methanobacteriaceae and the genus Methanobrevibacter (Steinberg and Regan, Reference Steinberg and Regan2009; Mao et al., Reference Mao, Yang and Zhu2011; Luo et al., Reference Luo, Su, Wright, Zhang, Smidt and Zhu2012) were detected using molecular techniques as the most predominant methanogens in pig feces, whereas Methanosphaera-like species (Luo et al., Reference Luo, Su, Wright, Zhang, Smidt and Zhu2012) were the second dominant methanogens. Cao et al. (Reference Cao, Liao, Liang, Wu and Yu2012) reported that the diversity of methanogens in the gastrointestinal tract of pigs was correlated to the quantity of fiber fermented in the hindgut. Likewise, in the rumen, a high abundance of methanogens was also found with a high-roughage diet (Liu et al., Reference Liu, Zhu, Liu, Guo and Dong2011). Su et al. (Reference Su, Smidt and Zhu2014) also reported that in pigs, other than genotype, the growth phase (including diet factor) may affect the fecal methanogenic archaeal community in the hindgut. We have recently reported that indigenous Chinese Lantang gilts fed a high-fiber diet (HFD) produced lower enteric CH4 than their counterparts fed a low-fiber diet (LFD) (Cao et al., Reference Cao, Gong, Liao, Liang, Yu and Wu2013). In order to provide a sound explanation for the above unexpected finding, the methanogenic community and other microbiota in the hindgut of the same Lantang gilts in the above study were investigated in this study.
Materials and methods
In vivo experiment
Institutional guidelines for the use and care of laboratory animals were closely followed. The use of animals in this study was approved by the South China Agricultural University Committee for Animal Experiments (approval ID: 201004152). In total, 12 Chinese Lantang gilts (6 months) with an average BW of 58.7±0.37 kg from a commercial farm in Heyuan, Guangdong province, China, were used for this study. The pigs were randomly allocated into two treatment groups (six pigs per treatment) and individually housed in open-circuit respiration chambers (Cao et al., Reference Cao, Gong, Liao, Liang, Yu and Wu2013). During the study, mean temperature and relative humidity inside the respiration chamber were 24.4±0.10°C and 92.6±1.09%, respectively. The average concentration of CO2 inside the respiration chamber was below 2.2% all the time. The gilts were in good health throughout the experiment and consumed 80% of the average ad libitum intake, which was determined during the adaptation period.
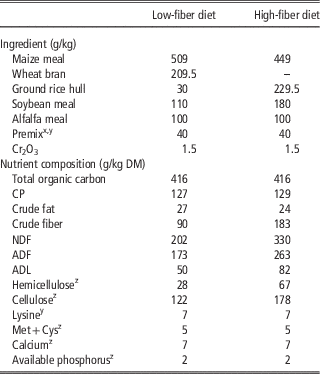
The two experimental diets were formulated to meet the nutrient requirements for Lantang pigs recommended by the Agriculture Local Standard in Guangdong province, China (DB441900/T05-2006). The ingredients and nutrient content of these two experimental diets (Table 1) were analyzed by Cao et al. (Reference Cao, Gong, Liao, Liang, Yu and Wu2013). To ensure that the pigs completely consumed the daily ration, the amount offered to them was calculated based on 80% of the averaged ad libitum intake (1.64 kg dry matter (DM)/pig per day) determined for the 12 pigs during the adaptation period. In order not to disrupt the wet-feeding method, which the pigs were accustomed to on their original farm, the experimental diets were mixed with water (3 : 1 ratio w/w) and fed daily in two equal portions at 0700 and 1600 h. Fresh drinking water was available at all times. During the first 3 days of the adaptation, pigs were fed a diet similar to that offered to them in their original farm to ensure minimal stress to the animals receiving the assigned experimental diets from the 4th day of adaptation. The experiment consisted of 20 days of adaptation followed by 7 days of digestion trial and 3 days of CH4 measurements. The gilts were fed the assigned experimental diets; either a LFD (NDF=89.72 g/kg) or a HFD (NDF=182.57 g/kg). In order to formulate the two iso-caloric and iso-nitrogenous diets with diverse fiber levels, wheat bran (NDF=477.7 g/kg) was used as the main source of fiber for LFD and ground rice hull (NDF=767.3 g/kg) was used for HFD. The reasons for selecting the two feed ingredients above as a source of fiber for the two treatments were that, first, they are commonly used (up to 600 g of ground rice hull/kg of the diet for Lantang gilts) in the farm from which the experimental pigs were obtained, and, second, that the ground rice hull used for the study was a mixture of ground rice bran and rice hull, which is more fermentable than the rice hull generally reported in the literature (López et al., Reference López, García, Karimi, Taherzadeh and Martín2010). The digestibility coefficient data for this ground rice hull were reported previously (Cao et al., Reference Cao, Gong, Liao, Liang, Yu and Wu2013) and showed that the ground rice hull was as fermentable as the wheat bran used in this study. At the end of the trial, the 12 pigs were sacrificed ~3 h after morning feeding. The whole gastrointestinal tract was immediately excised (cecum, proximal colon, medium colon, distal colon and rectum) and their contents sterilely collected separately into 50 ml sterile centrifuge tubes and stored at −80°C for later determination of the diversity and quantification of microbiota.
Ingredients and nutrient content of two experimental diets

DM=dry matter; NDF assayed with a heat stable amylase and expressed inclusive of residual ash; ADF expressed inclusive of residual ash; ADL determined by solubilization of cellulose with sulfuric acid.
Values are the average of three replicates.
x Commercial premix (g/kg per diet) for low-fiber diet: consists of trace elements (Fe, 0.08; Cu, 0.015; Zn, 0.08; Mn, 0.04; I, 0.003; Se, 0.00035), vitamin (A, 6000 IU; D3, 1500 IU; E, 20 IU; K3, 0.015; B1, 0.0015; B2, 0.00375; B6, 0.00225; B12, 0.000015; C, folic acid, 0.00075; biotin, 0.001), amino acids (lysine, 0.00187; methionine, 0.00071; threonine, 0.00139), Ca, 0.00441; P, 0.00069; sodium, 0.00119; and chlorine, 0.00177.
y Commercial premix (g/kg per diet) for high-fiber diet: consists of trace elements (Fe, 0.08; Cu, 0.015; Zn, 0.08; Mn, 0.04; I, 0.003; Se, 0.00035), vitamin (A, 6000 IU; D3, 1500 IU; E, 20 IU; K3, 0.015; B1, 0.0015; B2, 0.00375; B6, 0.00225; B12, 0.000015; C, folic acid, 0.00075; biotin, 0.001), amino acids (lysine, 0.00055; methionine, 0.00038; threonine, 0.00109), Ca, 0.00416; P, 0.00078; sodium, 0.00119; and chlorine, 0.00177.
z The values of lysine, Met+Cys, calcium, available phosphorus, cellulose and hemicellulose were calculated; hemicellulose=NDF−ADF, cellulose=ADF−ADL.
In vitro fermentation experiment
In order to explain the effect of different fiber source on methanogenic diversity and quantities, a follow-up in vitro fermentation using factorial design comprised of two inocula×four substrates was conducted in two runs as duplicates. In each run, three gas syringes (as analytical replicates) for each parameter were averaged and used as replicate in the statistical analysis.
LFD, HFD, wheat bran (W) and ground rice hull (R) were used as the substrates for Experiment No. 2. All substrates were ground through 1 mm screen, dried for 5 h at 60°C and stored in sealed plastic containers. Four Lantang gilts (60.5±0.50 kg) were purchased from the same commercial pig farm as in Experiment No. 1 and fed either with LFD (two gilts) or HFD (two gilts) similar to those used in Experiment No. 1 for 30 days before they were sacrificed to collect contents from their respective large intestine. The two fiber inocula were obtained from the above four gilts fed two diets differing in dietary fiber contents (Cao et al., Reference Cao, Gong, Liao, Liang, Yu and Wu2013).
Hindgut contents of the two pigs fed the same diet were pooled, thoroughly mixed, and diluted in sodium and ammonia bicarbonate buffer solution (35.0 g NaHCO3+4.0 g NH4HCO3/l) according to Menke and Steingass (Reference Menke and Steingass1988) in a ratio of 1 : 3 (w/v). The intestinal content buffer mixture was stirred for 60 s in a blender after which the solution was gently squeezed through four layers of surgical gauze, and then mixed with the buffer mineral solution (Menke and Steingass, Reference Menke and Steingass1988) in a 1 : 2 ratio (v/v) at 39°C under continuous flushing with CO2.
In vitro fermentation was performed using the gas production procedure (Cao et al., Reference Cao, Gong, Liao, Liang, Yu and Wu2013). At the end of incubation, syringes were put into an ice box to stop further fermentation. Next, 4 ml of the fluid was sampled and stored at −80°C for later determination of the diversity and quantification of methanogens.
Extraction of total microbial DNA
Microbial DNA was extracted from each segment of hindgut contents and in vitro fermentation samples using the soil DNA kit (Omega Bio-Tek Inc., Norcross, GA, USA) according to the manufacturer’s protocol. Microbial DNA from the five segments from the same pig was pooled and the extracted DNA was verified on a 1% agarose gel stained with ethidium bromide. The concentration of DNA was determined at A260 nm using ND-2000C spectrophotometer (Thermo Fisher Scientific Inc., Wilmington, DE, USA). The ratio of A260 and A280 for all samples was between 1.80 and 1.90.
Amplification of methanogenic 16S ribosomal RNA genes
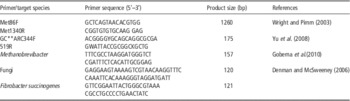
The universal primer pair Met86F/Met1340R (Wright and Pimm, Reference Wright and Pimm2003) was used to PCR amplify the 16S ribosomal RNA (rRNA) gene (1260 bp) using the following protocol: initial denaturation for 5 min at 95°C; 95°C for 30 s, 54°C for 30 s and 72°C for 2 min; and final elongation for 10 min at 72°C. The PCR reaction (25 μl) contained: 0.5 μl (10 pmol) of each primer, 12.5 μl 2× Easy Taq PCR Supermix (Takara Bio Inc., Ostu, Japan) and 1–2 μl (50–100 ng) of DNA template and supplemented with sterilized H2O to 25 μl. The PCR products were used as templates for a nested PCR amplification using the universal primer pair GC**ARC344F/519R (with a GC clamp added to the 5' end of ARC344F). As reported by Yu et al. (Reference Yu, García-González, Schanbacher and Morrison2008), the V3 region of the 16S rRNA gene (175 bp) is the preferred target in PCR-denaturing gradient gel electrophoresis (PCR-DGGE) analysis when ruminal archaeal communities are profiled. Therefore, primers targeting the V3 region of the 16S rRNA gene were used for methanogenic community profiling in this study. The amplification conditions were as follows: denaturation at 95°C for 3 min; 34 cycles of 95°C for 30 s, 56°C for 30 s and 72°C for 30 s, and final elongation for 7 min at 72°C.
Denaturing gradient gel electrophoresis analysis
The nested PCR products were subjected to DGGE using Bio-Rad DCodeTM universal mutation detection system (Bio-Rad Laboratories Inc., Hercules, CA, USA). The PCR products were separated using 6.5% polyacrylamide gel in 1×Tris Acetate-Ethylene diamine tetraacetic acid (EDTA) buffer (TAE Buffer: 40 mM Tris base, 20 mM glacial acetic acid, and 1 mM EDTA) with a 45%–65% linear denaturing gradient. The gels were initiated by pre-running for 10 min at 200 V at 60°C and then at 100 V for 10 h. The gel was stained with 500 ml of 0.01% (v/v) Goldview for 15 min, washed by sterilized water for 20 min and photographed by using SIM Bio-Best 200E gel image system (SIM International Group Co. Ltd, Newark, DE, USA).
Gel images were analyzed using Gel-Pro analyzer software (version 4.0; Media Cybernetics Inc., Rockville, MD, USA). The DGGE bands patterns were automatically identified. Lanes were individually converted to filled plots by the program. After background correction, the intensity of each band was measured by integrating the area under the peak and expressing the total area in the lane in percentage, and then the Shannon diversity index of the different lanes were calculated.
The similarity of DGGE profiles was analyzed using Phroetix-1D andPhroetix-1D pro (Total Lab Ltd, Newcastle, England), and Dice similarity coefficient (D sc ) index of each lane was calculated and the matrix of similarity coefficient was obtained, which was unweighted pair group mean average. The DGGE profile was considered completely different when the distance was 0, and similar when the distance was 1.
Cloning and sequence analysis of DNA fragments in denaturing gradient gel electrophoresis gels
Bands were excised aseptically from the DGGE gels and transferred to sterile water for 24 h at 4°C to remove the DNA fragments from the acrylamide gel. The excised DNA was used as a template in PCR re-amplification using the ARC344F/519R primers without the GC clamp, as described above. The fresh PCR products were later purified using the gel extraction kit (Omega Bio-Tek Inc.) following the manufacturer’s protocol. The purified PCR products were cloned into the pEASY-T3 cloning vector (pESAY-T3 Cloning Kit, Trans Gen Biotech Co. Ltd., Beijing, China) using the manufacturer’s chemical transformation procedures and were screened using 5-bromo-4-chloro-3-indolyl-β-d-galactopyranoside (X-Gal) (Sigma, St. Louis, MO, USA) medium containing ampicillin (100 μg/ml). Colonies with insertions (white colonies) were randomly selected and used for extraction of plasmid DNA with E.Z.N.A.TM Plasmid Mini Kit (Omega Bio-Tek Inc.) and the fresh plasmid DNA was sent for sequencing (BGI, Beijing, China). Sequences of the PCR-DGGE fragments were compared with the Gen Bank database using the BLAST program (http://blast.ncbi.nlm.nih.gov/).
Real-time PCR
The predominant methanogens (i.e. Methanobrevibacter spp.), F. succinogenes and anaerobic fungi in each sample were measured by determining the 16S rRNA gene (or 18S rRNA for fungi) copy numbers. Real-time PCR was performed with the Bio-Rad Real-Time PCR system (Bio-Rad Laboratories Inc.). Primer information is shown in Table 2. Real-time PCR reactions were performed in a total volume of 20 μl and final reaction mixtures contained 10 μl SYBR Green Supermix (Bio-Rad), 0.5 μl of each primer, 2 μl of DNA template and 7 μl of sterilized H2O. PCR conditions were as follows: 3 min at 95°C, followed by 40 cycles of 95°C for 30 s, 54°C (55.4°C for fungi and F. succinogenes) for 30 s, 72°C for 30 s. At the melting curve detection stage, the temperature was increased from 72°C to 95°C at a rate of 0.3°C every 20 s.
Sequences of primers for PCR-denaturing gradient gel electrophoresis and real-time PCR

GC**: GC clamp versions were constructed by the addition of the following to the 5' end of ARC344F primer: 5'-CGCCCGCCGCGCGCGGCGGGCGGGGCGGGGGCACGGGGGGACGGGGYGCAGCAGCGCGA-3'.
Standard curves were constructed using a serial dilution series of cloned plasmid DNA (pESAY-T3 Cloning Kit) from Methanobrevibacter smithii (ATCC 35061), F. succinogenes S85 (ATCC 19169) and uncultured Piromyces clone 99 (GQ_850318.1). The copy numbers for the plasmid standards were calculated based on the following equation: copy number=(NL×A×10−9)/(660×n), where NL is the Avogadro’s constant (6.02×10²³), A the molecular weight of the molecule in the standard and n the length of the amplicon (bp). The copy number of the methanogen 16S rRNA gene, per milliliter of sample, was calculated using the following equation: copy number=(QM×V×DV)/M, where QM is the quantitative mean copy number, V the volume of DNA subjected to analysis, DV the dilution volume of extracted DNA and M the weight of sample used for DNA extraction. The PCR efficiency (E) was calculated as E=[10(−1/slope)−1]×100%. The data generated for reactions with efficiencies between 0.9 and 1.1 were used for further analysis.
Statistical treatment of results
Data are presented as means±SEM. All statistical analyses were performed by SPSS 20.0 program (Chicago, IL, USA). For the in vivo experiment, one of the gilts in the HFD group had an irregular feed intake; thus all data from this replicate were excluded. The effects of two experimental diets on the Shannon diversity indexes of methanogens and the quantities of Methanobrevibacter spp., fungi and F. succinogenes, were assessed by an independent sample t test for unequal sample size with six pigs in the LFD dietary group and five pigs in the HFD dietary group. The differences among five segments of the hindgut in either the LFD or HFD group were identified by one way ANOVA. Pearson’s correlation coefficient was used to analyze the correlation with daily methane production and diversity and quantity of microorganisms.
For the in vitro fermentation, all values were corrected by the control (containing no substrate, but only the low- or high-fiber inoculum) (Bindelle et al., Reference Bindelle, Buldgen, Boudry and Leterme2007). One way ANOVA was used to identify differences among the four substrates means (six replicates for each substrate) incubated with high- or low-fiber inoculum using the GLM procedures of the SPSS 20.0 program. The differences in all parameters between two fiber inocula were assessed by an independent sample t test for equal sample size. Pearson’s correlation coefficient was used to analyze the correlation of daily methane production with diversity and density of the microorganisms. Differences between treatments were considered significant when P<0.05.
Results
Diversity of methanogens in the hindgut of Lantang gilts
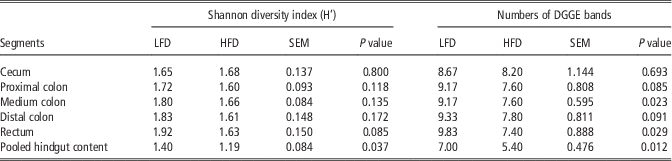
Within the same dietary group, the Shannon diversity index for methanogens across the five hindgut segments (cecum, proximal colon, medium colon, distal colon and rectum) was not different (P>0.05) (Table 3). However, between treatments, the diversity index for the pooled hindgut sample from gilts fed the LFD was significantly higher (P<0.05) than that of the HFD. As for the number of DGGE bands in the hindgut segments, significant differences (P<0.05) were observed in the medium colon and rectum between LFD and HFD groups. The mean number of DGGE bands in content of the pooled sample of pigs fed the LFD diet was higher (P<0.05) than that fed the HFD.
Shannon diversity index and denaturing gradient gel electrophoresis (DGGE) bands in the hindgut of Lantang gilts

LFD=low-fiber diet; HFD=high-fiber diet.
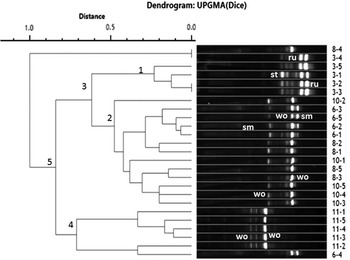
The similarity of DGGE band patterns was analyzed using the phroetix-1D pro software (Figures 1 and 2). The results showed that DGGE band patterns of the hindgut segments within each gilt illustrated high similarity coefficient (r=0.64–0.82) and clustered into one group. However, DGGE profiles of different individuals had low similarity coefficient (r<0.50) and in some cases individuals within the same dietary group, especially gilts in the HFD group, also exhibited large differences among them.
Unweighted pair group mean average (UPGMA) trees of five segments in hindgut of Lantang gilts fed low-fiber diet (LFD). Methanogenic PCR-denaturing gradient gel electrophoresis (DGGE) profiles generated from large intestinal content of six gilts using primers GC-ARC344f and 519r. As for the ordinal number of each lane on the right was used to identify the gilt and different segment of large intestine, the first number means the number (one, two, four, five, nine, 12) of six Lantang gilts in LFD group, and the second number (one, two, three, four, five) indicates five segments of hindgut (cecum, proximal colon, medium colon, distal colon and rectum). The ‘ru’ represents the Methanobrevibacter ruminantium M1 strain M1; ‘wo’ is Methanobrevibacter wolinii strain SH; ‘st’ is Methanosphaera stadtmanae DSM 3091; ‘sm’ is Methanobrevibacter smithii ATCC 35061 in DGGE profiles.

Unweighted pair group mean average (UPGMA) trees of five segments in hindgut of Lantang gilts fed high-fiber diet (HFD). Methanogenic PCR-denaturing gradient gel electrophoresis (DGGE) profiles were generated from the large intestinal content of the six gilts belonging to the HFD group using primers GC-ARC344f and 519r. The ordinal number of each lane on the right was used to identify the animal and the different segments of the large intestine, the first number means the gilt (three, six, eight, 10, 11) and the second number (one, two, three, four, five) indicates one of the five segments of hindgut (cecum, proximal colon, medium colon, distal colon and rectum). The ‘ru’ represents the Methanobrevibacter ruminantium strain M1; ‘wo’ is Methanobrevibacter wolinii strain SH; ‘st’ is Methanosphaera stadtmanae DSM 3091; ‘sm’ is Methanobrevibacter smithii ATCC 35061 in DGGE profiles.

A total of 46 distinctive PCR-DGGE bands were examined across hindgut samples, from animals in the two dietary groups. Of the 46 bands, 21 bands were found to be Methanobrevibacter wolinii (wo), 18 bands were found to be Methanobrevibacter ruminantium M1 (ru), two bands were found to be M. smithii PS (sm) and five bands were found to be Methanosphaera stadtmanae (st) (Figures 1 and 2; Table 4). No differences at the species level were observed between the two dietary groups.
Identification of PCR-denaturing gradient gel electrophoresis bands from the hindgut of gilts

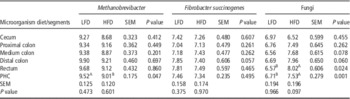
Density of Methanobrevibacter, fungi and Fibrobacter succinogenes in the hindgut of Lantang gilts
No clear trend or differences (P>0.05) were observed in the total copies of Methanobrevibacter spp. among the hindgut segments (from cecum to rectum) from gilts in the LFD or HFD group (Table 5). However, the gene copies of species belonging to the genus Methanobrevibacter, in the pooled hindgut samples, were more than three times higher in the LFD animals (3.29×10⁹ copies/g DM) (P<0.05) than those in the HFD group (1.02×10⁹ copies/g DM). No difference (P>0.05) was observed in the number of gene copies of F. succinogenes for the pooled hindgut content between the two dietary groups (average 2.51×10⁷ copies/g DM) (Table 5). In contrast, the gene copies of fungi in the rectum and the pooled hindgut samples of gilts fed LFD (5.13×10⁶ copies/g DM) was nearly 85% lower (P<0.05) than those of gilts fed the HFD (3.39×10⁷ copies/g DM). Except for the rectum, the fungal population for the other segments did not differ (P>0.05) between two dietary groups.
Density of 16S ribosomal RNA gene of three microorganisms in five segments of hindgut contents of Lantang gilts fed low-fiber diet or high-fiber diet in vivo trial

LFD=low-fiber diet; HFD=high-fiber diet; PHC=pooled hindgut contents.
A,BFor each microorganism, within same row differed (P<0.05) between two fiber diets.
Diversity of methanogens of samples in in vitro fermentation
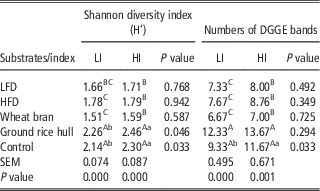
The Shannon diversity index and DGGE bands of control and ground rice hull used as sole substrate were higher (P<0.05) than LFD, HFD and wheat bran (W) irrespective of which inoculum was used (Table 6). However, no difference (P>0.05) was observed in Shannon diversity index and DGGE bands between LFD, HFD and wheat bran.
Shannon diversity index and denaturing gradient gel electrophoresis (DGGE) bands of four substrates inoculated by two inocula in vitro fermentation

LI=low-fiber inoculum; HI=high-fiber inoculum; LFD=low-fiber diet; HFD=high-fiber diet
A,B,CWithin the same column differed (P<0.05) between substrates inoculated by same inoculum; a,bwithin the same row differed between two fiber inocula (P<0.05).
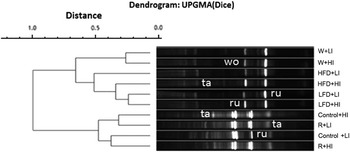
For the same substrate, higher similarity of DGGE fingerprints was observed between low-fiber inoculum and high-fiber inoculum. The DGGE fingerprint of control had higher similarity with ground rice hull (R) than that of LFD, HFD and wheat bran (Figure 3).
Unweighted pair group mean average (UPGMA) trees of methanogenic diversity in vitro fermentation. Methanogenic PCR-denaturing gradient gel electrophoresis (DGGE) profiles were generated from five substrates (including control (no substrate), low-fiber diet (LFD), high-fiber diet (HFD), wheat bran (W) and ground rice hull (R) incubated with high-fiber inoculum (HI) or low-fiber inoculum (LI). The ‘ru’ represents the Methanobrevibacter ruminantium strain M1; ‘wo’ is Methanobrevibacter wolinii strain SH; ‘ta’ is Thermogymnomonas acidicola strain in PCR-DGGE profiles.

A total of 15 distinctive PCR-DGGE bands were successfully identified, these sequences represented three known species of methanogens (Figure 3). Eight bands were found to be M. ruminantium M1 (ru), two bands were found to be M. wolinii strain (wo) and five bands were found to be Thermogymnomonas acidicola strain (ta) (similarity coefficient 90%).
Density of Methanobrevibacter, fungi and Fibrobacter succinogenes of samples in in vitro fermentation
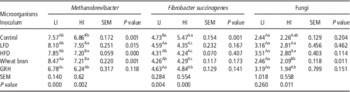
Except for the ground rice hull, the number of 16S rRNA gene copies of Methanobrevibacter from the other three substrates and the control incubated with low-fiber inoculum was higher (P<0.05) than that of high-fiber inoculum. Within the same fiber inoculum, ground rice hull (R) used as sole substrate, the number of 16S rRNA gene copies of Methanobrevibacter was lower (P<0.05) than for the control and the other three treatments. However, no differences (P>0.05) were observed in Methanobrevibacter gene copies between LFD and HFD (Table 7).
Density of 16S ribosomal RNA gene of three microorganisms in vitro fermentation

LI=low-fiber inoculum; HI=high-fiber inoculum; LFD=low-fiber diet; HFD=high-fiber diet; GRH=ground rice hull.
A,BWithin each microorganism, within same row differed (P<0.05) between two inocula; a,b,cwithin same column differed (P<0.05) between five substrates incubated with the same inoculum.
As for the numbers of F. succinogenes, the low-fiber inoculum was lower (P<0.05) than high-fiber inoculum. However, for the other four substrates, no differences (P>0.05) were observed between the two fiber inocula. When incubated with the same fiber inoculum, the number of gene copy of the control was the highest when ground rice hull was used as substrate (Table 7). The 18S rRNA gene copies of fungi incubated with low-fiber inoculum were higher (P<0.05) than those of high-fiber inoculums for LFD when bran (W) and ground rice hull (R) used as the sole substrate.
Correlation of parameters with methane production in vivo and in vitro trials
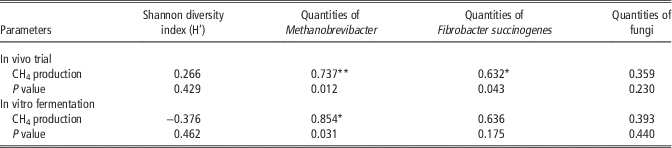
In the in vivo trial, mean daily CH4 production of the gilts (2.38 l/kg DM feed intake for LFD v. 1.50 for HFD; Cao et al., Reference Cao, Gong, Liao, Liang, Yu and Wu2013) was positively correlated (P<0.05) with the density of Methanobrevibacter (r=0.737) and F. succinogenes (r=0.632). Similarly, in the in vitro fermentation, the gene copies of Methanobrevibacter was also positively correlated (P<0.05) with CH4 production (r=0.854). However, Shannon diversity index of methanogens was not correlated with methane production (Table 8).
Correlation coefficient of Shannon diversity index (H’), density of Methanobrevibacter, fungi and Fibrobacter succinogenes with CH4 production in vivo and in vitro trial

**, *Correlation is significant at 0.01, 0.05 levels, respectively (two-tailed).
Discussion
Results of our in vivo and in vitro trials indicated that Methanobrevibacter was the dominant methanogens in hindgut of Lantang gilts, which is in agreement with results previously reported studies (Miller et al., Reference Miller, Wolin and Kusel1986; Mao et al., Reference Mao, Yang and Zhu2011). Interestingly, five DGGE bands from the in vitro fermentation were related to T. acidicola. However, the similarity was only 90%. Stackebrandt and Goebel (Reference Stackebrandt and Goebel1994) reported that microbial homology was no more than 60% when microbial identity coefficient was less than 0.97 no matter which hybridization method is applied. Considering that methanogens and Thermoplasmatales all belong to the Archaea, which indicated that these five DGGE bands are likely to be methanogenic strains or species, that have not yet been identified. Likewise, methanogens related to the Thermoplasmatales clade were also found in ruminants (Whitford et al., Reference Whitford, Teather and Forster2001; Wright et al., Reference Wright, Toovey and Pimm2006; Pei et al., Reference Pei, Mao, Cheng and Zhu2010) and pig feces (Mao et al., Reference Mao, Yang and Zhu2011).
The increased methanogen diversity from gilts fed LFD in the in vivo trial contradicted the low methanogenic diversity of the control treatment incubated with low-fiber inocula in the in vitro fermentation. One reason for this discrepancy could be because in vitro technique does not totally represent what actually occurs in a living digestive tract (Williams et al., Reference Williams, Bosch, Boer, Verstegen and Tamminga2005). Moreover, the microbial population present in the hindgut varied between individuals, as it is evidenced by the differences of the DGGE profiles of individuals within the same dietary group (Figures 1 and 2), and to some extents, host species (individual differences) may also influence methanogenic community (Shi et al., Reference Shi, Meng, Zhou, Wang, Diao and Yao2008). In addition, results of the in vitro fermentation incubated with the same fiber inoculums showed that methanogenic diversity of the control treatment was lower than that of the ground rice hull, but higher than wheat bran. This indicates that the fiber content of substrate plays an important role in influencing the methanogenic diversity and dominant species, which is in agreement with study of Varel (Reference Varel1987). The above information showed that the methanogenic diversity in the hindgut of pigs was affected by many factors (such as the fiber content of substrate or diet, host genotypes and experimental procedure), and thus suggesting that the methanogenic diversity may not be a good predictive index for methane production.
As Methanobrevibacter was the dominant methanogens in hindgut of Lantang gilts, we chose to quantify the predominant Methanobrevibacter rather than the total methanogens. Results of this study showed that the density of Methanobrevibacter from gilts fed LFD was higher (P<0.05) than that of gilts fed HFD in both the in vivo and in vitro trials. In the latter, the density of Methanobrevibacter for all substrates, except for ground rice hull, incubated with low-fiber inoculum was higher compared with the high-fiber inoculums. The above findings thus indicate that dietary fiber has direct influence on density of Methanobrevibacter in the hindgut of Lantang gilts. Although the density of Methanobrevibacter species were positively correlated with CH4 production in both in vivo (y=1.141x−7.329, P<0.01, r=0.737) and in vitro trials (y=1.622x−10.502, P<0.05, r=0.854), because of the big differences between individuals, larger samples number of hindgut contents of pigs (replicates) are needed to obtain more accurate correlation equations of methanogenic population and CH4 production.
It has been reported that hydrogen transfer through methanogenesis is beneficial to the degradation of plant cell wall carbohydrates in the rumen (Chaucheyras-Durand et al., Reference Chaucheyras-Durand, Masséglia, Fonty and Forano2010) and the microbiota in the large intestine of pigs contains all of the predominant ruminal cellulose degrading bacteria, including F. succinogenes (intestinalis), Ruminococcus albus and Rumnococcus flavefaciens (Varel and Yen, Reference Varel and Yen1997). Accordingly, we also quantified some of the abovementioned bacteria and anaerobic fungi in the large intestinal contents, but only F. succinogenes and anaerobic fungi were successfully amplified. Varel and Pond (Reference Varel and Pond1985) reported no increase in cellulolytic bacteria from fecal samples of gestating sows fed with 20% corn–cob diet but a twofold increase in the same bacteria when fed with 40% and 96% alfalfa meal. The above results suggested that the level and perhaps the sources of fiber influence the activity and growth of cellulolytic bacteria. In agreement with the above, our results showed that cellulolytic microorganisms (sum of F. succinogenes and fungi) for the pooled hindgut sample of gilts fed HFD was higher than those of gilts fed LFD in the in vivo trial, and similar results were obtained for the control substrate incubated in low-fiber inoculum compared with high-fiber inoculums the in vitro study, indicating that higher fiber diet enhances population of cellulolytic bacteria.
It has been reported that, in the rumen, among the major cellulolytic communities, anaerobic fungi are the major contributors of H2, whereas F. succinogenes does not produce H2 (Chaucheyras-Durand et al., Reference Chaucheyras-Durand, Masséglia, Fonty and Forano2010). Miller (Reference Miller1991) reported that feed ingredients rich in crude fiber stimulate some microbial species within the cellulolytic-methanogen consortium, which serve to couple the degradation of carbohydrates with the use of H2 for the reduction of CO2 to methane. Based on the above information, methanogen community in the hindgut of gilts fed HFD should be higher than that of LFD group. Our data showed the opposite, that is, higher density of Methanobrevibacter community was detected in the pooled hindgut sample of gilts fed LFD and not that of HFD. However, the higher density of Methanobrevibacter, the main methanogens in hindgut of pigs, in gilts fed LFD is in agreement with their higher CH4 production than gilts fed HFD reported previously by us (Cao et al., Reference Cao, Gong, Liao, Liang, Yu and Wu2013). As methane production is a loss of dietary energy for the animals (although much lower in pigs than ruminants), understanding methanogen ecology in the hindgut of pigs may lead to improving their dietary utilization and decreasing their impact on the environment.
The higher density of Methanobrevibacter recorded for the LFD gilts in the present study are a direct evidence to explain the unexpected higher CH4 production from this group of gilts as compared with those fed HFD. However, the unanswered question is why did the HFD gilts produced lower CH4? Although we do not have further data to explain the lower CH4 emissions from gilts fed HFD, we speculate that it could be due to differences in the physico-chemical properties of the fiber of the two diets. Wang (Reference Wang2008) reported that rice bran, among other components, contained about 0.8% tannins. Considering that tannins inhibit CH4 emission (Jayanegara et al., Reference Jayanegara, Leiber and Kreuzer2012; Whitehead et al., Reference Whitehead, Spence and Michael2013) by suppressing activity and growth of methanogens (Liu et al., Reference Liu, Zhu, Liu, Guo and Dong2011; Tan et al., Reference Tan, Abdulah, Liang, Huang and Ho2011), we believed that the tannins in the rice hull (mixture of rice bran and rice hull) used as the main source of the HFD may have inhibited CH4 production in gilts fed HFD. In addition, as previously report (Cao et al., Reference Cao, Gong, Liao, Liang, Yu and Wu2013), rice hull is rich in lignin and can hardly be degraded by microbes, thus further explain the lower CH4 production from the HFD. The latter is also reported by Lee et al. (Reference Lee, Lee, Kim, Oh, Kim, Kim and Kim2003) who noted that the negative relationship between in vitro methane production and high crude fiber feed ingredients could be due to their hard outer layer, which is hardly degraded by microbes.
Another probable explanation for the lower CH4 production from the HFD than that from the LFD gilts could be due to different fermentation pathways of wheat bran and ground rice hull used in this study. Matsui et al. (Reference Matsui, Wakabayashi, Fukushima, Ito, Nishikawa, Yoshimi, Ogawa, Yoneda, Ban-Tokuda and Wakita2013) reported that supplementing the substrate with 10% raw rice bran affected short-chain fatty acid profiles by significantly increasing the proportion of butyrate and reducing the methanogen density by 25%, compared with the control which resulted in 18% inhibition of methane production after 24-h in vitro incubation. As highlighted earlier, the ground rice hull contained 2% fermentable oligosaccharides that may influence the fermentation pathway to favor the conversion of lactic acid to propionate production (Shinoda et al., Reference Shinoda, Singu, Kushibiki and Ueda2007; Cao et al., Reference Cao, Takahashi, Horiguchi, Yoshida and Cai2010). This probability is supported by results of our previous study that observed lower (P<0.05) acetate/propionate ratio when rice hull and its NDF were used as substrates than when wheat bran and NDF of wheat bran were used in an in vitro experiment (Cao et al., Reference Cao, Gong, Liao, Liang, Yu and Wu2013). Moss et al. (Reference Moss, Jouany and Newbold2000) reported that acetate and butyrate fermentation pathways produced a large amount of H2 and the latter is competitively used for propionate production. Thus, higher propionate production served as a competitor for the H2 in the system for the methanogens.
Conclusion
The primary objective of this study was to explain the unexpected results that Lantang gilts fed LFD produced higher enteric CH4 than their counterparts fed a HFD, which we previously reported (Cao et al., Reference Cao, Gong, Liao, Liang, Yu and Wu2013). Results of this study showed that gilts fed LFD had higher density of Methanobrevibacter species in their hindgut compared with those fed HFD. As density of Methanobrevibacter species is positively correlated with CH4 production, it explained the higher enteric CH4 production from gilts fed the LFD diet. In addition, based on information from the literature, we speculate that the rice hull used as the main fiber source in the HFD contained tannins and lignin, which to some extents may have suppress CH4 production from gilts fed HFD.