Implications
The present study quantified the phenotypic and genetic characteristics of bovine milk lactose. Lactose is the major sugar of mammals’ milk and in solid form it is an important ingredient for different food and products. In addition, phenotypic studies reported that it can be used as biomarker for identification of cow udder inflammation. As literature on genetic aspects of bovine milk lactose is scarce, the parameters estimated in the present study are a contribution to increase the knowledge on the genetic background of milk lactose, making it exploitable for breeding purposes.
Introduction
Lactose is a disaccharide composed of glucose and galactose and it is the major carbohydrate in mammals’ milk. Cow milk contains around 5% of lactose, which represents about 40% of total solids (Fox et al., Reference Fox, Uniacke-Lowe, McSweeney and O’Mahoni2015). The Golgi apparatus is the organelle of the mammary gland cell where the synthesis of lactose takes place, starting from blood glucose. The amount of synthesized lactose is the major regulator of milk volume; in fact, due to different osmotic pressures between cell lumen and Golgi vesicles, water is transported into the Golgi apparatus to stabilize the osmotic equilibrium. This mechanism explains why lactose percentage (LP) is not affected by milk dilution, when compared with other milk solids whose concentration is affected by the volume of milk and drops at the peak of lactation (Fox et al., Reference Fox, Uniacke-Lowe, McSweeney and O’Mahoni2015). The reference analysis of milk LP, typically expressed as monohydrate form, is the HPLC (ISO 22662, 2007). Infrared spectroscopy is routinely adopted to determine LP (ISO 9622, 2013), as the correlation between measured and predicted LP in validation is 0.996 (FOSS, Hillerød, Denmark).
Lactose plays a central role in milk powder production, being often the limiting milk solid. Considering that international standards require specific final composition of milk powders, some countries such as New Zealand have to purchase extra lactose from the international market in order to reach the proper composition of milk powder and exploit the amounts of fat and protein contained in the liquid milk or, alternatively, remove the excesses of fat and protein (World Health Organization and Food and Agriculture Organization of the United Nations, 2011; Sneddon et al., Reference Sneddon, Lopez-Villalobos, Hickson, Davis, Geary, Garrick and Shalloo2016). In Italy, the production and exportation of solid lactose has increased since 2014, as a consequence of rising cheese and whey production (CLAL, 2017).
Lactose percentage is influenced by several sources of variation, mainly parity number, stage of lactation, udder health status and individual animal (Henao-Velásquez et al., Reference Henao-Velásquez, Múnera-Bedoya, Herrera, Agudelo-Trujillo and Cerón-Muñoz2014; Fox et al., Reference Fox, Uniacke-Lowe, McSweeney and O’Mahoni2015; Alessio et al., Reference Alessio, Neto, Velho, Pereira, Miquelluti, Knob and da Silva2016). Heritability of LP ranges from 0.25 to 0.51 (Miglior et al., Reference Miglior, Sewalem, Jamrozik, Bohmanova, Lefebvre and Moore2007; Gillon et al., Reference Gillon, Bastin, Soyeurt and Gengler2010; Haile-Mariam and Pryce, Reference Haile-Mariam and Pryce2017). Because of the central role of lactose in regulating milk volume, phenotypic and genetic correlations between lactose yield (LY) and milk yield (MY) are close to unity (Sneddon et al., Reference Sneddon, Lopez-Villalobos, Davis, Hickson and Shalloo2015), and thus their lactation curves have the same pattern (Henao-Velásquez et al., Reference Henao-Velásquez, Múnera-Bedoya, Herrera, Agudelo-Trujillo and Cerón-Muñoz2014). Likewise, the lactation curve of LP resembles those of MY and LY, but shows greater persistency and smaller variation across lactation (Miglior et al., Reference Miglior, Sewalem, Jamrozik, Lefebvre and Moore2006; Leitner et al., Reference Leitner, Merin and Silanikove2011). Negative correlation exists between milk LP and somatic cell score (SCS), meaning that lactose could be an indicator of udder health. Phenotypic and genetic correlations between LP and SCS range from −0.66 to −0.19 (Sneddon et al., Reference Sneddon, Lopez-Villalobos, Davis, Hickson and Shalloo2015; Vilas Boas et al., Reference Vilas Boas, Vercesi Filho, Pereira, Roma Junior and El Faro2017) and −0.35 to −0.07 (Gillon et al., Reference Gillon, Bastin, Soyeurt and Gengler2010; Sneddon et al., Reference Sneddon, Lopez-Villalobos, Davis, Hickson and Shalloo2015), respectively, depending on cow breed and statistical model. The drop of LP in the presence of high SCS is due to the increased permeability of basal membrane of cells during mammary tissue inflammation; however, the mechanisms behind this relation are not totally understood yet (Fox et al., Reference Fox, Uniacke-Lowe, McSweeney and O’Mahoni2015). Finally, some reports have estimated negative phenotypic correlations between LP and milk freezing point (FRP), suggesting that high LP leads to lower (i.e. more desirable) milk FRP (Bjerg et al., Reference Bjerg, Rasmussen and Nielsen2005; Kedzierska-Matysek et al., Reference Kedzierska-Matysek, Litwińczuk, Florek and Barłowska2011; Costa et al., Reference Costa, De Marchi, Cassandro and Penasa2017).
The scientific community has only marginally investigated lactose as a feature of potential interest for the dairy industry, and there is a paucity of information on phenotypic and genetic aspects of this trait so far. Furthermore, Løvendahl and Weisbjerg (Reference Løvendahl and Weisbjerg2017) have stressed the lack of genetic correlations between LP and other milk traits computed using big data sets. Gaining knowledge on the genetics of milk lactose could be useful to address breeding strategies that consider this compound, for example, as indicator of udder health of dairy cows. Hence, the aims of the present paper were to characterize phenotypic aspects of LP and LY, and to estimate their genetic parameters in Italian Holstein cows.
Material and methods
A total of 293 575 test-day records from 16 523 Holstein cows in 1097 herds were collected from January 2011 to December 2014 in the Province of Bolzano (North of Italy) during monthly milk recording. Milk yield (kg/day) for each test-day record was available. Lactose percentage, fat percentage (FP), protein percentage (PP) and FRP were determined with mid-IR spectroscopy using a MilkoScan™ FT6000 (Foss Electric A/S, Hillerød, Denmark), and somatic cell count (SCC, cells/µl) was assessed through Fossomatic™ FC (Foss Electric A/S). The milk analyses were performed in the laboratory of the South Tyrolean Dairy Association (Bolzano, Italy). Lactose yield, fat yield (FY) and protein yield (PY) expressed in kg/day were derived by multiplying the respective percentages by MY.
Cows were required to have known sire and dam, to be in parity 1 to 5 and between 6 and 480 days in milk. Based on the frequency distribution of age at calving within parity, records of animals outside the following ranges of age (months) were removed: 20 to 40 for first-parity, 32 to 58 for second-parity, 44 to 76 for third-parity, 56 to 94 for fourth-parity and 68 to 112 for fifth-parity cows. According to International Committee for Animal Recording (ICAR, 2016) guidelines, test-day records of LP, FP and PP outside the ranges 4.0% to 5.5%, 2.0% to 6.0% and 2.5% to 4.5%, respectively, were discarded from the data set. Somatic cell count was required to be between 1000 and 10 000 000 cells/ml, MY between mean ±3 SD and FRP between mean ±2 SD. To achieve normality and homogeneity of variance, SCC was converted to SCS using the formula SCS=3+log2(SCC/100). A minimum of three records per cow within lactation and a minimum of three cows per herd-test-date (HTD) were required for subsequent statistical analyses. This restriction was established considering that the average herd size in Bolzano province is around 15 lactating cows and thus setting the minimum number of cows per HTD to a higher threshold than three would have resulted in an excessive loss of test-day records. The final data set consisted of 150 633 records from 10 893 cows in 664 herds.
Statistical analysis
The software adopted for all analyses was ASReml 4.1 (Gilmour et al., Reference Gilmour, Gogel, Cullis, Welham and Thompson2015). A phenotypic ANOVA of milk production and composition traits, SCS and FRP was performed using the following linear model:
 $$ \eqalign { Y_{{ijklm}} {\equals} \mu {\plus}{\rm htd}_{i} {\plus}{\rm parity}_{j} {\plus}{\rm stage}_{k} {\plus}{\rm season}_{l} \cr {\plus}\left( {{\rm parity}\,{\times}\,{\rm stage}} \right)_{{jk}} {\plus}{\rm cow}_{m} {\plus}e_{{ijklm}} $$
where Y ijklm is the dependent variable (MY, FY, PY, LY, FP, PP, LP, FRP or SCS); µ the overall intercept of the model; htd i the fixed effect of the ith HTD (i=1 to 18 402); parity j the fixed effect of the jth parity number of the cow (j=1, 2, 3, 4, 5); stage k the fixed effect of the kth class of stage of lactation (k=6 to 30, 31 to 60, 61 to 90, … , 301 to 330, 331 to 390, >390 days); season l the fixed effect of the lth season of calving [(l=winter (December to February), spring (March to May), summer (June to August) and autumn (September to November)]; (parity × stage) jk the fixed interaction effect between parity and stage of lactation; cow m the random effect of the mth cow (m=1 to 10 893)~N(0, σ 2 cow); and e ijklm the random residual ~N(0, σ 2 e).
In order to evaluate the impact of different levels of LP on milk production and composition traits (except for LY and LP), SCS and FRP, a second ANOVA was performed by adding the fixed effect of classes of LP to the previous model. Three classes were created according to mean±1 SD (class 1: LP<4.59%; class 2: 4.59%⩽LP⩽4.93%; class 3: LP>4.93%) and LP averaged 4.47±0.11%, 4.77±0.09% and 5.01±0.07% in class 1, 2 and 3, respectively. Pair-wise comparisons of means were performed for the effect of classes of LP using a t-test (P<0.05).
To reduce computational time, genetic analysis was carried out on a randomly selected subset of herds that included 40% (n=266) of the total number of herds in the edited data set (n=664). The subset consisted of 59 811 records from 4355 cows and 7530 HTD. Means and variation of all traits and the frequency of observations within each parity in this subset (34%, 28%, 19%, 12% and 7% for parity 1, 2, 3, 4 and 5, respectively) reflected those of the whole data set. A six-generation pedigree was provided by the Italian Holstein Association (ANAFI, Cremona, Italy) and included 17 092 animals, that is all cows with records and their ancestors. Univariate repeatability animal models were used to estimate variance components for milk production and composition traits, SCS and FRP, and bivariate repeatability animal models were used to compute covariances between the traits. The general form of the univariate repeatability animal model, in matrix notation, was:
 $${\bf y}{\equals}{\bf Xb}{\plus}{\bf Za}{\plus}{\bf Ww}{\plus}{\bf Sc}{\plus}{\bf e}$$
where y is the vector of phenotypic observations of the dependent variable (MY, LY, FY, PY, LP, FP, PP, SCS or FRP); b the vector of fixed effects (HTD, parity, stage of lactation, calving season, interaction between parity and stage of lactation); a the vector of random additive genetic effects; w the vector of random within-lactation permanent environmental effects; c the vector of random across-lactation permanent environmental effects; e the vector of random residuals; and X, Z, W and S are incidence matrices relating the corresponding effects to the dependent variable. The following expectations (E) of the variables were assumed: E(y)=Xb, E(a)=0, E(w)=0, E(c)=0 and E(e)=0. The variances of random effects were assumed as follows: var(a)=A σ 2 a, var(w)=I 1 σ 2 w, var(c)=I 2 σ 2 c and var(e)=I 3 σ 2 e, where σ 2 a is the additive genetic variance, σ 2 w the within-lactation permanent environmental variance, σ 2 c the across-lactation permanent environmental variance, σ 2 e the random residual variance, A the numerator relationship matrix between all animals considered in the data set, I 1 is an identity matrix of order equal to the number of lactations in the data set; I 2 is an identity matrix of order equal to the number of cows in the data set; and I 3 is an identity matrix of order equal to the number of records.
The bivariate repeatability animal model for any pair of two traits could be generally represented as:
 $$\eqalign { \left[ {\matrix{ {{\rm y}_{{\rm 1}} } \cr {{\rm y}_{{\rm 2}} } \cr } } \right]{\rm {\equals}} \left[ {\matrix{ {{\rm X}_{{\rm 1}} } & {\rm 0} \cr {\rm 0} & {{\rm X}_{{\rm 2}} } \cr } } \right]{\rm {\plus}}\left[ {\matrix{ {{\rm b}_{{\rm 1}} } \cr {{\rm b}_{{\rm 2}} } \cr } } \right]{\rm {\plus}}\left[ {\matrix{ {{\rm Z}_{{\rm 1}} } & {\rm 0} \cr {\rm 0} & {{\rm Z}_{{\rm 2}} } \cr } } \right]\left[ {\matrix{ {{\rm a}_{{\rm 1}} } \cr {{\rm a}_{{\rm 2}} } \cr } } \right]{\rm} \cr { {\plus}}\left[ {\matrix{ {{\rm W}_{{\rm 1}} } & {\rm 0} \cr {\rm 0} & {{\rm W}_{{\rm 2}} } \cr } } \right]\left[ {\matrix{ {{\rm w}_{{\rm 1}} } \cr {{\rm w}_{{\rm 2}} } \cr } } \right]{\rm {\plus}}\left[ {\matrix{ {{\rm S}_{{\rm 1}} } & {\rm 0} \cr {\rm 0} & {{\rm S}_{{\rm 2}} } \cr } } \right]\left[ {\matrix{ {{\rm c}_{{\rm 1}} } \cr {{\rm c}_{{\rm 2}} } \cr } } \right]{\rm {\plus}}\left[ {\matrix{ {{\rm e}_{{\rm 1}} } \cr {{\rm e}_{{\rm 2}} } \cr } } \right]$$
The following assumptions were considered: E(y 1)=X1 b 1, E(y 2)=X2 b 2, E(a i )=0, E(w i )=0, E(c i )=0 and E(e i )=0. The (co)variance structure of the random effects was assumed as follow:
 $$ \scale77% { {\rm Var}\left[ {\matrix{ {{\rm a}_{1} } \cr {{\rm a}_{2} } \cr {{\rm w}_{1} } \cr {{\rm w}_{2} } \cr {{\rm c}_{1} } \cr {{\rm c}_{2} } \cr {e_{1} } \cr {e_{2} } \cr } } \right] {\equals} \left[ {\matrix{ {{\rm A}\sigma _{{{\rm a}_{1} }}^{2} } & {{\rm A}\sigma _{{{\rm a}_{{12}} }} } & 0 & 0 & 0 & 0 & 0 & 0 \cr {{\rm A}\sigma _{{{\rm a}_{{12}} }} } & {{\rm A}\sigma _{{{\rm a}_{2} }}^{2} } & 0 & 0 & 0 & 0 & 0 & 0 \cr 0 & 0 & {{\rm I}_{1} \sigma _{{{\rm w}_{1} }}^{2} } & {{\rm I}_{1} \sigma _{{{\rm w}_{{12}} }} } & 0 & 0 & 0 & 0 \cr 0 & 0 & {{\rm I}_{1} \sigma _{{{\rm w}_{{12}} }} } & {{\rm I}_{1} \sigma _{{{\rm w}_{2} }}^{2} } & 0 & 0 & 0 & 0 \cr 0 & 0 & 0 & 0 & {{\rm I}_{2} \sigma _{{{\rm c}_{1} }}^{2} } & {{\rm I}_{2} \sigma _{{{\rm c}_{{12}} }} } & 0 & 0 \cr 0 & 0 & 0 & 0 & {{\rm I}_{2} \sigma _{{{\rm c}_{{12}} }} } & {{\rm I}_{2} \sigma _{{{\rm c}_{2} }}^{2} } & 0 & 0 \cr 0 & 0 & 0 & 0 & 0 & 0 & {{\rm I}_{3} \sigma _{{{\rm e}_{1} }}^{2} } & {{\rm I}_{3} \sigma _{{{\rm e}_{{12}} }} } \cr 0 & 0 & 0 & 0 & 0 & 0 & {{\rm I}_{3} \sigma _{{{\rm e}_{{12}} }} } & {{\rm I}_{3} \sigma _{{{\rm e}_{2} }}^{2} } \cr } } \right]$$
where σ a12, σ w12, σ c12 and σ e12 are genetic, within-lactation permanent environmental, across-lactation permanent environmental and residual covariances between traits 1 and 2, respectively. Heritability (h 2) and repeatability (t) of a trait were calculated as:
 $$h^{{\rm 2}} {\rm {\equals}}{{\sigma _{{\rm a}}^{{\rm 2}} } \over {\sigma _{{\rm a}}^{{\rm 2}} {\rm {\plus}}\sigma _{{\rm w}}^{{\rm 2}} {\rm {\plus}}\sigma _{{\rm c}}^{{\rm 2}} {\rm {\plus}}\sigma _{{\rm e}}^{{\rm 2}} }}{\rm ,}\,t{\rm {\equals}}{{\sigma _{{\rm a}}^{{\rm 2}} {\rm {\plus}}\sigma _{{\rm w}}^{{\rm 2}} {\rm {\plus}}\sigma _{{\rm c}}^{{\rm 2}} } \over {\sigma _{{\rm a}}^{{\rm 2}} {\rm {\plus}}\sigma _{{\rm w}}^{{\rm 2}} {\rm {\plus}}\sigma _{{\rm c}}^{{\rm 2}} {\rm {\plus}}\sigma _{{\rm e}}^{{\rm 2}} }}$$
Genetic (r a) and phenotypic (r p) correlations were calculated as:
 $$r_{{\rm a}} {\rm {\equals}}{{\sigma _{{{\rm a}_{{{\rm 12}}} }} } \over {\sqrt {\sigma _{{{\rm a}_{{\rm 1}} }}^{{\rm 2}} {\times}\sigma _{{{\rm a}_{{\rm 2}} }}^{{\rm 2}} } }}{\rm ,}\,r_{{\rm p}} {\rm {\equals}}{{\sigma _{{{\rm p}_{{{\rm 12}}} }} } \over {\sqrt {\sigma _{{{\rm p}_{{\rm 1}} }}^{{\rm 2}} {\times}\sigma _{{{\rm p}_{{\rm 2}} }}^{{\rm 2}} } }}$$
where σ 2 p is the phenotypic variance for any trait calculated as σ 2 p=σ 2 a+σ 2 w+σ 2 c+σ 2 e, and σ p12 the phenotypic covariance between traits 1 and 2, calculated as σ p12=σ a12+σ w12+σ c12+σ e12.
Results
Descriptive statistics and analysis of variance
Descriptive statistics for the edited data set (n=150 633) are reported in Table 1. Lactose percentage averaged 4.76% with a CV of 3.57%. Lactose yield had a CV of 29.01%, close to the CV of MY (28.03%), FY (29.09%) and PY (25.00%). The greatest CV was obtained for SCS (60.82%) and the lowest for FRP (1.33%).
Descriptive statistics of quality and production traits of bovine milk (n=150 633)

SCS=somatic cell score.
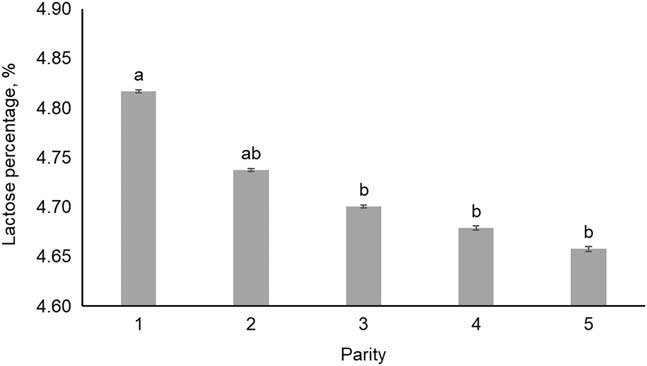
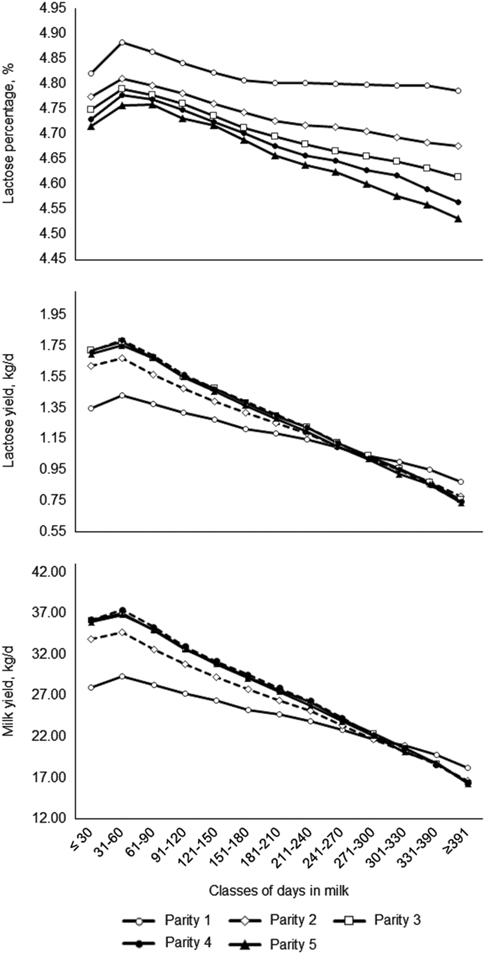
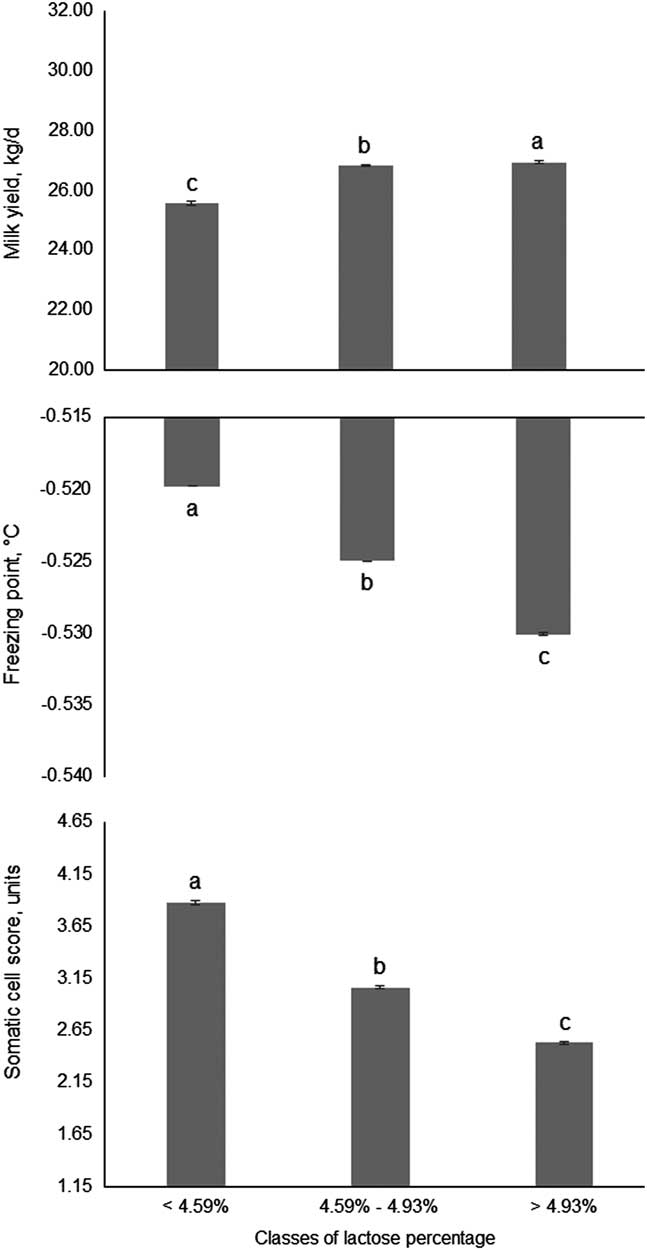
Fixed effects of HTD, parity, stage of lactation, season of calving and the interaction between parity and stage of lactation were significant (P<0.001) in explaining the variation of milk production and composition traits, SCS and FRP. Least squares means of LP for parity are depicted in Figure 1; significant differences (P<0.05) were observed between cows in first- (4.82±0.002%) and cows in third- (4.70±0.002%), fourth- (4.68±0.002%) and fifth-lactation (4.66±0.003%). Parity order-specific lactation curves of LP, LY and MY (Figure 2) highlighted the greater persistency of LP and MY in younger compared with older animals, which led to greater LY in first-parity cows at the end of lactation. The fixed effect of classes of LP added to the second ANOVA was significant (P<0.001) for MY, FP, PP, FY, PY, FRP and SCS. In particular, MY increased from 25.58±0.05 to 26.94±0.05 kg/day moving from low to high LP class, whereas FRP and SCS decreased from −0.519±0.00°C to −0.530±0.00°C and from 3.88±0.02 units to 2.53±0.02°units, respectively (Figure 3).
Least squares means (with SE) of milk lactose percentage across parities of dairy cows. a,bMeans with different letters are significantly different (P<0.05).

Least squares means of lactose percentage (SE from 0.00 to 0.01), lactose yield (SE from 0.00 to 0.01) and milk yield (SE from 0.07 to 0.22) of dairy cows for the interaction effect between classes of days in milk and parity.

Least squares means (with SE) of cow milk yield, freezing point and somatic cell score across classes of lactose percentage. a,b,cMeans with different letters are significantly different (P<0.05).

Genetic parameters
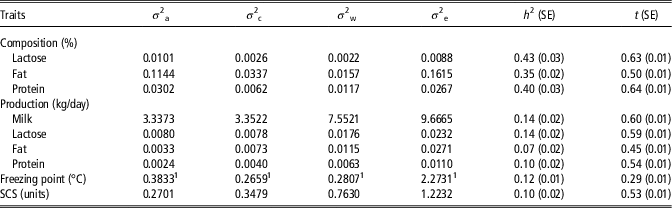
Estimates of variance components, heritability and repeatability for each trait are presented in Table 2. Lactose percentage had the highest heritability (0.43±0.03) among the studied traits. Heritabilities were low for LY (0.14±0.02), FRP (0.12±0.01) and SCS (0.10±0.02), and moderate for FP (0.35±0.02) and PP (0.40±0.03). Lactose percentage, PP, MY and LY were highly repeatable, with values between 0.59±0.01 (LY) and 0.64±0.01 (PP). Repeatabilities of the other traits ranged from 0.29±0.01 (FRP) to 0.54±0.01 (PY).
Additive genetic (σ 2 a), across-lactation permanent environmental (σ 2 c), within-lactation permanent environmental (σ 2 w) and residual (σ 2 e) variances, heritability (h 2; SE in parentheses) and repeatability (t; SE in parentheses) of daily bovine milk composition and production traits, milk freezing point and somatic cell score (SCS) (n=59 811)

1 (×10−5).
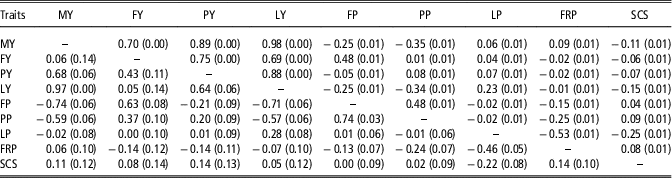
Phenotypically, LP was moderately correlated with FRP (−0.53±0.01), SCS (−0.25±0.01) and LY (0.23±0.01), and it was uncorrelated with other production and quality traits (Table 3). Milk FRP was negatively associated with FP (−0.15±0.01) and PP (−0.25±0.01), and uncorrelated with LY, FY and PY. Somatic cell score exhibited correlations of −0.11±0.01 with MY, −0.15±0.01 with LY and close to 0 with the other features. Phenotypic correlations of LY with milk composition and production traits were generally stronger than the correlations involving LP, except for the associations between LY and FRP (−0.01±0.01), and LY and SCS (−0.15±0.01).
Phenotypic correlations (above diagonal) and genetic correlations (below diagonal) between the studied traits in bovine milk

MY=milk yield; FY=fat yield; PY=protein yield; LY=lactose yield; FP=fat percentage; PP=protein percentage; LP=lactose percentage; FRP=freezing point; SCS=somatic cell score.
SE are given in parentheses.
From a genetic point of view, LP correlated with LY (0.28±0.08), SCS (−0.22±0.08) and FRP (−0.46±0.05), and did not associate with FP, PP, MY, FY and PY (Table 3). The strongest associations involving LY were estimated with MY (0.97±0.00), PY (0.64±0.06), FP (−0.71±0.06) and PP (−0.57±0.06).
Discussion
Descriptive statistics
Milk composition was in accordance with results reported by Tiezzi et al. (Reference Tiezzi, Pretto, De Marchi, Penasa and Cassandro2013), Penasa et al. (Reference Penasa, Tiezzi, Gottardo, Cassandro and De Marchi2015) and Toffanin et al. (Reference Toffanin, Penasa, McParland, Berry, Cassandro and De Marchi2015) in Holstein cows. Lactose yield, FY and PY were slightly lower than mean values reported by Tiezzi et al. (Reference Tiezzi, Pretto, De Marchi, Penasa and Cassandro2013). Overall, LP was comparable with the literature, but greater than the averages reported by Miglior et al. (Reference Miglior, Sewalem, Jamrozik, Lefebvre and Moore2006) for Canadian Holsteins (4.58%), Glantz et al. (Reference Glantz, Lindmark-Månsson, Paulsson and Stålhammar2012) for Swedish Holsteins (4.38%), Alessio et al. (Reference Alessio, Neto, Velho, Pereira, Miquelluti, Knob and da Silva2016) for Holstein and Jersey breeds (4.47%) and Petrini et al. (Reference Petrini, Iung, Rodriguez, Salvian, Pértille, Rovadoscki, Cassoli, Coutinho, Machado, Wiggans and Mourão2016) for Holstein cows reared under tropical conditions (4.60%). Conversely, greater values were reported by Haile-Mariam and Pryce (Reference Haile-Mariam and Pryce2017) using data from Australian Holstein and Jersey herds; in particular, in their study, LP averaged 5.03%, 4.97% and 4.94% in first-, second- and third-lactation cows, respectively. Similarly, Sneddon et al. (Reference Sneddon, Lopez-Villalobos, Davis, Hickson and Shalloo2015) reported higher mean LP (5.12%) in a multi-breed study conducted in New Zealand. Indeed, this was mainly due to the feeding system based on pasture and seasonal calving. Lactose percentage of Australian and New Zealand milk is generally greater than that of European and American milk (Haile-Mariam and Pryce, Reference Haile-Mariam and Pryce2017). The low CV of LP was expected as it is the direct consequence of the physiological and osmotic mechanism that determines the final concentration of lactose in milk.
Fixed effects
The greater LP in milk of primiparous than multiparous cows (Figure 1) agrees with findings of Haile-Mariam and Pryce (Reference Haile-Mariam and Pryce2017), and it could be attributed to a higher SCC level in milk of multiparous animals, which results in higher incidences of mastitis (Oltenacu and Broom, Reference Oltenacu and Broom2010) and therefore lower LP. Moreover, first-calving cows are usually less stressed than older cows, because they do not have a previous lactation and they theoretically can convert a higher amount of serum glycogen into lactose (Larsen and Moyes, Reference Larsen and Moyes2015). Indeed, multiparous are more likely to suffer from negative energy balance than primiparous cows, as milk production increases with parity number. Lactation curves of LP were similar to lactation curves of MY and LY (Figure 2), and opposite to lactation curves of FP and PP, again supporting that LP is not affected by the amount of milk produced. The greater persistency of LP and LY in first- compared with later-parity cows are responsible for the greater persistency of MY in primiparous than multiparous animals (Haile-Mariam and Pryce, Reference Haile-Mariam and Pryce2017). Least squares means of LP and LY were similar across calving seasons, suggesting that the significance of this effect can be mainly attributed to the high number of records available in the study rather than to an actual seasonal effect.
The second ANOVA with the inclusion of the fixed effect of classes of LP (Figure 3) confirmed that LP and FRP have an opposite trend (Hanuš et al., Reference Hanuš, Frelich, Tomáška, Vylětelova, Genčurová, Kučera and Třináctý.2010; Kedzierska-Matysek et al., Reference Kedzierska-Matysek, Litwińczuk, Florek and Barłowska2011). In addition, the highest value of SCS assessed in the low-lactose class corroborates the view that cows with on average lower milk LP are those with higher milk SCS, and thus they are more likely to be susceptible to mastitis. This finding is supported by previous investigation on the effect of high SCS and mastitis on milk composition (Lindmark-Månsson et al., Reference Lindmark-Månsson, Bränning, Aldén and Paulsson2006; Vilas Boas et al., Reference Vilas Boas, Vercesi Filho, Pereira, Roma Junior and El Faro2017).
Heritability and repeatability
Heritability of LP (0.43±0.03; Table 2) was similar to estimates reported by Miglior et al. (Reference Miglior, Sewalem, Jamrozik, Bohmanova, Lefebvre and Moore2007) for Canadian Holsteins and by Gillon et al. (Reference Gillon, Bastin, Soyeurt and Gengler2010) in a multi-breed study, and higher than heritabilities of 0.33 and 0.30 estimated in Holstein cows by Tiezzi et al. (Reference Tiezzi, Pretto, De Marchi, Penasa and Cassandro2013) and Petrini et al. (Reference Petrini, Iung, Rodriguez, Salvian, Pértille, Rovadoscki, Cassoli, Coutinho, Machado, Wiggans and Mourão2016), respectively, and 0.25 reported by Sneddon et al. (Reference Sneddon, Lopez-Villalobos, Davis, Hickson and Shalloo2015) in a multi-breed population. In agreement with findings of Tiezzi et al. (Reference Tiezzi, Pretto, De Marchi, Penasa and Cassandro2013) and Haile-Mariam and Pryce (Reference Haile-Mariam and Pryce2017), a lower heritability of LY (0.14±0.02) compared with LP was somewhat expected, as LY is strongly related to MY. Regarding FRP, Costa et al. (Reference Costa, De Marchi, Cassandro, Visentin, Lopez-Villalobos and Penasa2018) estimated a heritability of 0.11 and a repeatability of 0.26 in a large data set of primiparous Holstein cows, very close to the values of the present research. Nevertheless, comparison with the literature is difficult because few genetic studies have attempted to estimate genetic parameters of FRP at population level. Overall, heritabilities of FP and PP were in agreement with estimates reported in Ireland by Visentin et al. (Reference Visentin, McParland, De Marchi, McDermott, Fenelon, Penasa and Berry2017), and heritabilities of MY, FY and PY were in accordance with findings of Tiezzi et al. (Reference Tiezzi, Pretto, De Marchi, Penasa and Cassandro2013) and Sneddon et al. (Reference Sneddon, Lopez-Villalobos, Davis, Hickson and Shalloo2015). The repeatabilities of LP (0.63±0.01) and LY (0.59±0.01) agreed with recent findings of Scarso et al. (Reference Scarso, McParland, Visentin, Berry, McDermott and De Marchi2017) and Visentin et al. (Reference Visentin, McParland, De Marchi, McDermott, Fenelon, Penasa and Berry2017), and suggested that ~40% of the variability of these traits is attributable to temporary environmental effects.
Phenotypic correlations
Similar to our findings, Hanuš et al. (Reference Hanuš, Frelich, Tomáška, Vylětelova, Genčurová, Kučera and Třináctý.2010) and Costa et al. (Reference Costa, De Marchi, Cassandro and Penasa2017) assessed a negative phenotypic correlation between LP and FRP. The negative association between FRP and solids percentages (Table 3) corroborated that this trait is mainly associated with concentration of milk components, especially with water-soluble traits (lactose and protein; Fox et al., Reference Fox, Uniacke-Lowe, McSweeney and O’Mahoni2015). Somatic cell score was negatively correlated with LP, as reported by Lindmark-Månsson et al. (Reference Lindmark-Månsson, Bränning, Aldén and Paulsson2006) and Vilas Boas et al. (Reference Vilas Boas, Vercesi Filho, Pereira, Roma Junior and El Faro2017), and with LY, similar to the results of Haile-Mariam and Pryce (Reference Haile-Mariam and Pryce2017). Indeed, lactose synthesis and availability in udder decreases in presence of high SCC, due to mastitis pathogens which use lactose as a substrate, but also due to the increase of mammary homeostasis during inflammation (Blum et al., Reference Blum, Heller, Krifucks, Sela, Hammer-Muntz and Leitner2008; Alessio et al., Reference Alessio, Neto, Velho, Pereira, Miquelluti, Knob and da Silva2016). Berglund et al. (Reference Berglund, Pettersson, Östensson and Svennersten-Sjaunja2007) observed a decrease of LP from 4.86% to 4.69% when SCC increased from 31 000 to 450 000 cells/ml in Swedish Red and White cows.
Genetic correlations
Overall, genetic correlations (Table 3) were in agreement with estimates reported by Miglior et al. (Reference Miglior, Sewalem, Jamrozik, Bohmanova, Lefebvre and Moore2007), Sneddon et al. (Reference Sneddon, Lopez-Villalobos, Davis, Hickson and Shalloo2015) and Visentin et al. (Reference Visentin, McParland, De Marchi, McDermott, Fenelon, Penasa and Berry2017). The weak genetic relationship between LP and LY was expected as LP is the concentration of lactose in udder in equilibrium with water, whereas LY is the anabolic amount of lactose synthesized and present in a given volume of milk. Lactose yield is more dependent on blood glucose and on GLUT transporters expression; therefore, the correlation between LP and LY was expected to be positive but even far from unity. The correlation between LP and SCS was consistent with the estimates of Sneddon et al. (Reference Sneddon, Lopez-Villalobos, Davis, Hickson and Shalloo2015) and Haile-Mariam and Pryce (Reference Haile-Mariam and Pryce2017). Nevertheless, investigations including data of mastitis diagnoses are necessary to validate LP as reliable indicator of intramammary infection. The negative genetic correlation between LP and FRP was expected because milk FRP depends on milk solids concentration. Indeed, more positive FRP values (>−0.520°C) denote diluted milk. Considering this result and that low values of FRP are desirable, FRP could be depressed or stabilized through genetic selection for higher LP. In the present study, the correlation between LP and FP estimated through a repeatability animal model was close to zero. However, Haile-Mariam and Pryce (Reference Haile-Mariam and Pryce2017), using random regression models, estimated positive correlations between LP and FP at the beginning of lactation and negative at the end. Finally, the genetic correlation close to one between LY and MY corroborates that milk volume is highly dependent on lactose synthesis in the udder (Miglior et al., Reference Miglior, Sewalem, Jamrozik, Bohmanova, Lefebvre and Moore2007; Sneddon et al., Reference Sneddon, Lopez-Villalobos, Davis, Hickson and Shalloo2015; Haile-Mariam and Pryce, Reference Haile-Mariam and Pryce2017). Therefore, selection indexes with a positive weight for MY such as in the United States and South Africa, indirectly, account for LY.
Conclusions
Lactose is a milk component of economic relevance and under substantial genetic control, exhibiting greater heritability than most traditional milk traits already included in selection indexes worldwide. Genetic selection for LP is thus feasible and genomic selection could be used on this trait to help improve milk marketability and maybe respond to new market demands. Correlations with traits of interest are present and therefore lactose could be used to accelerate the gains of those traits that are difficult and expensive to measure, and that exhibit low heritability. For example, after validation with mastitis information, LP could help in monitoring the udder health of dairy cows, in addition to SCC. Further work should be carried out to estimate the economic value of LP under different scenarios and to shift genetic selection towards country-specific needs.
Acknowledgments
This study was supported by the University of Padova (Ricerca Scientifica fondi DOR – 2017, project DOR1721792/17, Italy). The authors thank the South Tyrolean Dairy Association, the Breeders Association of Bolzano province (Bolzano, Italy) and the Italian Holstein Association (ANAFI, Cremona, Italy) for providing milk data and pedigree information. Mrs Raquel Lopez-Lozano (Massey University, New Zealand) is gratefully acknowledged for reading and correcting the manuscript.
Declaration of interest
The authors declare that they do not have conflicts of interest.
Ethics statement
Procedures used in this study are excluded from the authorization of the animal welfare committee.
Software and data repository resources
None of the data were deposited in an official repository.