

Introduction
In Australia, mental disorders are the third leading contributor to the burden of disease. Depression is one of the top-ranking causes of non-fatal diseases (Henderson et al., Reference Henderson, Andrews and Hall2000; Mathers et al., Reference Mathers, Vos, Stevenson and Begg2000). Results from the Australian Longitudinal Study of Ageing (ALSA; Luszcz et al., Reference Luszcz, Giles, Eckermann, Edwards, Browne-Yung and Hayles2007) have shown that at baseline 14% of community-dwelling and 32% of residential-care dwelling participants reported symptoms in the “depressed” range (Anstey et al., Reference Anstey, van Sanden, Sargent-Cox and Luszcz2007). This analysis suggested depression was associated with increased dependency and therefore with increased burden of the disease.
The recognition in the 1990s of the under-diagnosis and under-treatment of depression led to national initiatives to support appropriate screening and treatment (Whiteford, Reference Whiteford2008). In the same period, the marketing of the selective serotonin reuptake inhibitors (SSRIs), which were perceived to be safer than the tricyclic antidepressants, led to an increase in the use of antidepressants in all countries (Blazer et al., Reference Blazer, Hybels, Fillenbaum and Pieper2005; Mamdani et al., Reference Mamdani, Rapoport, Shulman, Herrmann and Rochon2005; Montagnier et al., Reference Montagnier, Barberger-Gateau, Jacqmin-Gadda, Dartigues, Rainfray and Peres2006; Sonnenberg et al., Reference Sonnenberg, Deeg, Comijs, van Tilburg and Beekman2008). In Australia, antidepressant prescriptions dispensed through community pharmacies increased almost fivefold between 1990 and 2002 (Mant et al., Reference Mant, Rendle, Hall, Mitchell, Montgomery and McManus2004). In 2006, government expenditure on antidepressants was more than AUS$476 million (Australian Government and Department of Health and Ageing, 2008). Despite this increased use, discrepancies between data on treatment provision and treatment need suggest that not all social strata in Australia have equal access to treatment (Page et al., Reference Page, Swannell, Martin, Hollingworth, Hickie and Hall2009).
There has been some concern about the correctness of the diagnosis and treatment of depression in general practice (Parker, Reference Parker2007). In 2001, Krupinski and Tiller (Reference Krupinski and Tiller2001) reported that only 28% of Australian general practitioners (GPs) were able to list at least five DSM-IV criteria for diagnosing depression. General practitioners were using their own “intuitive” taxonomy in diagnosing depression (Clarke et al., Reference Clarke, Cook, Smith and Piterman2008). While antidepressants were listed for “major depressive disorders”, they were predominantly prescribed in primary care management for “chronic mild depression” (McManus et al., Reference McManus, Mant, Mitchell, Britt and Dudley2003). Some experts have estimated that as many as half a million Australians were being prescribed antidepressants possibly inappropriately, mostly for mild depression (Jureidini and Tonkin, Reference Jureidini and Tonkin2006). Recently, the therapeutic value of antidepressants for depression has also been questioned as a result of finding that negative trials of antidepressants had not been published (Kirsch et al., Reference Kirsch, Deacon, Huedo-Medina, Scoboria, Moore and Johnson2008; Turner et al., Reference Turner, Matthews, Linardatos, Tell and Rosenthal2008).
While studies have examined trends in antidepressant use in the elderly population and shown rising use (Blazer et al., Reference Blazer, Hybels, Fillenbaum and Pieper2005; Mamdani et al., Reference Mamdani, Rapoport, Shulman, Herrmann and Rochon2005; Montagnier et al., Reference Montagnier, Barberger-Gateau, Jacqmin-Gadda, Dartigues, Rainfray and Peres2006), only a few studies have examined the use of antidepressants in relation to depressive symptomatology. Our study aimed to investigate the patterns of use of antidepressants between 1992 and 2004 in the ALSA.
Methods
Sample
ALSA was the first longitudinal study of older people in Australia examining how social, biomedical and environmental factors affect age-related changes in people aged 65 years and above. The sampling and data collection procedures have been described elsewhere (Luszcz et al., Reference Luszcz, Giles, Eckermann, Edwards, Browne-Yung and Hayles2007). Briefly, between 1992 and 2004, ALSA comprised seven waves of data collection. Subsequent waves have been conducted but are beyond the scope of this report. In wave 1, 2087 adults aged 65 years and over, living in the community or in residential aged care dwellings, were enrolled. All participants at waves 1 (1992–1993), 3 (1994–1995), 6 (2000–2001) and 7 (2003–2004), respectively, were interviewed at home on a wide range of sociodemographic, psychological and health-related questions.
Measures
Depressive symptoms were measured by the Centre for Epidemiologic Studies Depression Scale (CES-D; Radloff, Reference Radloff1977). Participants were asked how often they had experienced each of 20 symptoms during the past week, on a scale from 0 to 3. Total scores range from 0 to 60 with higher scores indicating more depressive symptoms. Elevated depressive symptoms were defined by a CES-D score of 16 or higher (Pandya et al., Reference Pandya, Metz and Patten2005). The expectation-maximization (EM) algorithm (Rubin, Reference Rubin1987; Schafer and Graham, Reference Schafer and Graham2002) was used to impute missing data for respondents who had less than 50% missing items of the CES-D scale.
Covariates were collected at each wave: residential status (community or aged care), perceived health, cognitive function, and physical impairment. Perceived health was determined by self-report as excellent, very good, good, fair or poor. Cognitive function was assessed by the Mini-mental State Examination (MMSE) where a score lower than 23 was indicative of cognitive impairment (Folstein et al., Reference Folstein, Robins and Helzer1983; Reference Folstein, Anthony and Parhad1985). Physical impairment was measured using the Activities of Daily Living (ADL) scale (Zautra et al., Reference Zautra, Maxwell and Reich1989). ADL includes eight self-care activities, which include bathing, personal grooming, dressing, eating, using the toilet, going to a place away from home, moving inside the house and transferring from bed to chair. The ADL score was dichotomized into no difficulty with any activity (score of 0) or difficulty with one or more activities (score of 1), in this study.
The prevalence of antidepressant use was measured using patient self-reported data in waves 1, 3 and 6. Participants were asked about any medications that they were taking or were supposed to take in the previous two weeks, including the drug name, duration of treatment and the reason for use. They were also asked to show the medicine container to the interviewer. All medications were coded using the World Health Organization Anatomical Therapeutic Chemical (ATC) coding system and all antidepressants with code “N06A” (excluding lithium) were considered in this study. Antidepressants were placed in the following classes: tricyclic antidepressants (TCAs) (ATC code = N06AA), SSRIs (ATC code = N06AB), non selective monoamine oxidase inhibitors (ATC code = N06AF), selective monoamine oxidase inhibitors (ATC code = N06AG) and other antidepressants (ATC code = N06AX). In wave 7, instead of patient self-reported medication use, data on prescription medications dispensed through community pharmacies and subsidized by the Australian government were obtained from the Health Insurance Commission (HIC).
The self-reported reasons for use of antidepressants were grouped into three categories: psychological indications (depression, sleeping problems and anxiety); physical indications (commonly accepted indications including pain, migraine and urinary incontinence); or others. “Other” indications included reasons reported by the respondents which were unlikely to be “true” indications and may indicate poor understanding of the indications for taking the medication (for instance “heart rhythm”, “memory”, “blood pressure”).
Duration of the use of antidepressants was assessed in waves 1 and 6, when respondents were asked how long they had been taking the medications. Adherence was examined in wave 1 only. Patients were asked on how many days in the last two weeks they had taken the medications.
Statistics
Descriptive analysis of the characteristics of the participants, prevalence of depressive symptoms and antidepressant use, classes of antidepressants, reasons for antidepressant use and persistence of antidepressant use was conducted. The χ2 test was used to compare data between different waves. Longitudinal analysis of the prevalence of antidepressant use was performed by using logistic generalized estimating equations (GEE). The GEE model enables adjustment for the repeated measures for a given subject (Ballinger, Reference Ballinger2004). It was used to detect if there was any trend in the prevalence of antidepressant use over the study period, adjusting for potential confounding factors (covariates): sex, age group, residential status, perceived health, physical impairment, depressive symptoms and cognitive impairment. Time was the date of the first participant being interviewed at each wave. Age and gender were collected at baseline. The population-averaged GEE model was applied to describe how the average response across participants changes with the covariates (Zeger et al., Reference Zeger, Liang and Albert1988). A regression coefficient in the logistic GEE model also represents the change in log odds for a unit change in the predictor, adjusted for other covariates in the model. This change should be interpreted at the population level rather than for any individual.
In order to deal with the missing data in the longitudinal analysis, comparisons of the characteristics of participants according to their follow-up status at the subsequent wave (interviewed, deceased or not interviewed) was conducted. It showed that deceased people were more likely to have been male, living in residential aged care, depressed, physically impaired, cognitively impaired and to have reported lower perceived health than people interviewed at the subsequent wave. People who declined to be interviewed at wave 3 and wave 6 were more likely to be cognitively impaired and to report lower perceived health than people interviewed; but at wave 7, the only significant difference was that people who declined to be interviewed were older. Given the missing data were not missing at random, imputation for the missing data was not applied in the longitudinal analysis except for the CES-D scores. All statistical analyses were performed using Stata 9.0 (StataCorp, 2001) with a significant level of 0.05.
Results
Sample characteristics
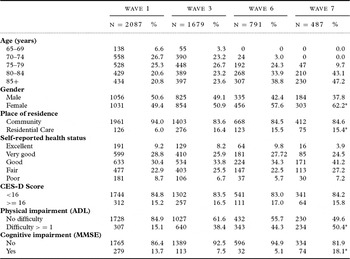
At wave 1, in 1992, there were 2087 participants. The main reasons for attrition in subsequent waves were death, followed by refusal to participate, moving out of scope and unable to be contacted. When these factors are taken into consideration, response rates were 93.1%, 74.1% and 74.2%, respectively for waves 3, 6, and 7. As of June 2004, 62% (1295) of the original sample had died. The demographic characteristics of the sample at waves 1, 3, 6 and 7 are presented in Table 1. Compared with data at the start of the study, the proportion of women, the number living in residential aged care, and the number with physical or cognitive impairment were higher at the end of the study (Table 1).
Demographic characteristics of ALSA respondents at waves 1, 3, 6 and 7

*Compared with data at wave1, p <0.05
ALSA = Australian Longitudinal Study of Ageing; CES-D = Center for Epidemiologic Studies – Depression scale; ADL = activities of daily living; MMSE = Mini-mental State Examination.
Prevalence of depressive symptoms and antidepressant use
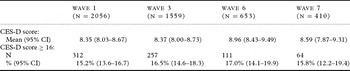
The prevalence of participants with depressive symptoms was 15.2% at the start of the study and 15.8% at wave 7 (Table 2). No trend was detected over the study time after adjusting for the confounders (p > 0.05).
Mean CES-D scores and prevalence of participants with scores ≥ 16

CES-D = Center for Epidemiologic Studies – Depression Scale.
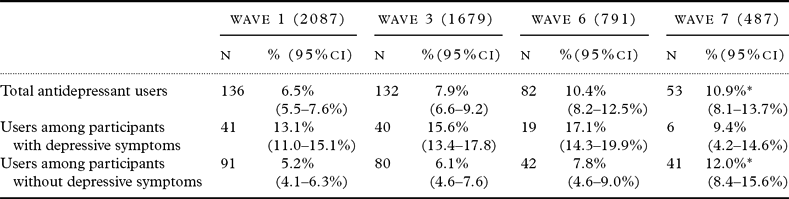
Among the participants with depressive symptoms, fewer than 20% were taking antidepressants at any of the waves (Table 3). Among the participants without depressive symptoms, the prevalence of antidepressants users was 5.2% at wave 1 and 12.0% at wave 7 (p < 0.01) (Table 3).
Prevalence of antidepressant users and depressive symptoms at each wave
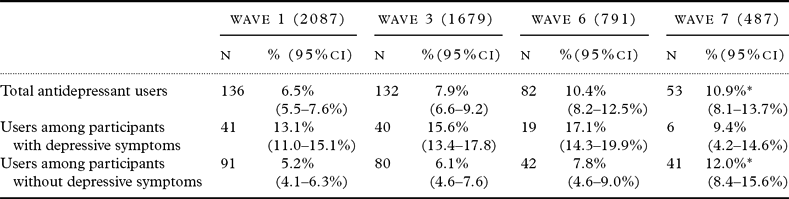
*Compared with data at wave 1, p < 0.05
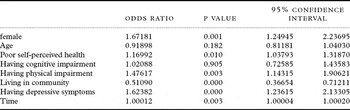
The prevalence of antidepressant users in the cohort increased from 6.5% at wave 1 to 10.9% at wave 7 (p = 0.003). Participants who were female, had a poorer perceived health, were living in residential aged care, and had physical impairment or depressive symptomatology were more likely to report taking antidepressants (Table 4). The increasing trend in antidepressant use was also significant when respondents who reported using antidepressants for physical and other indications were excluded (from 4.8% to 7.2%, p = 0.003).
Results of the logistic generalized estimating equation model for antidepressant use

Antidepressant classes
The increase in antidepressant use was mainly due to an increase in the use of SSRIs, from 2.2% of users at wave 1 to 39.6% at wave 7. The proportion of TCAs among all antidepressant use dropped from 91.2% at wave 1 to 56.6 % at wave 7 but the prevalence of users of TCAs in the cohort seemed to remain stable over time (approximately 6%). Other antidepressants used by a minority of participants included tranylcypromine, moclobemide, mianserin, nefazodone, and venlafaxine.
Indications for antidepressant use
Psychological indications, which included depression, anxiety and sleeping problems, accounted for approximately 70% of all indications at waves 1, 3 and 6, respectively. Use of antidepressants for physical indications, including bladder problems, pain and migraine, was around 10% at each wave. SSRIs were exclusively used for psychological indications while TCAs were more commonly used for physical indications. The prevalence of antidepressant users for psychological indications was 4.8% at wave 1, 5.8% at wave 3 and 7.2% at wave 6.
Adherence and persistence with antidepressant use
Most respondents using antidepressants (90.5%) had a high level of self-reported adherence and, across all indications, took antidepressants every day during the two weeks prior to the interview at wave 1. In terms of the duration of antidepressant use, for psychological indications, 53% and 45% of users had been taking antidepressants for more than two years at wave 1 and wave 6, respectively, and 79% and 65% of users had been taking antidepressants for more than six months at wave 1 and wave 6, respectively.
Discussion
This longitudinal study of a population-based sample of the Australian elderly people showed an increase in antidepressant use from 1992 to 2004, after adjusting for sex, age group, residential status, perceived health, physical impairment, depressive symptomatology and cognitive impairment. This increase was mainly due to the increase in use of SSRIs while use of TCAs remained stable over time. The results are consistent with the increase in antidepressant consumption observed in Australia (McManus et al., Reference McManus, Mant, Mitchell, Montgomery, Marley and Auland2000). The results are also consistent with the trends observed in other international longitudinal studies in the elderly population. For example, the Longitudinal Ageing Study Amsterdam showed that antidepressant use increased from 2% to 6% between 1992–93 and 2001–02 (Sonnenberg et al., Reference Sonnenberg, Deeg, Comijs, van Tilburg and Beekman2008). The French study PAQUID found an increase in antidepressant use from 5.2% in 1988–90 to 11.9% in 1998–99 in older people (Montagnier et al., Reference Montagnier, Barberger-Gateau, Jacqmin-Gadda, Dartigues, Rainfray and Peres2006).
Psychological indications such as depression, sleeping problems and anxiety were the only indications for SSRIs, while up to 17% people used TCAs for physical illnesses, such as bladder problems, pain and migraine. Information on indications for antidepressant use was obtained from self-report and may not always be reliable. However, according to a study by Kwon et al. (Reference Kwon, Bungay, Pei, Rogers, Wilson and Zhou2003), which compared self-report and medical claims data for antidepressant exposure from a longitudinal study, there was a good concordance (85% agreement) between self-reported and medical claims data for antidepressant use. Our results are also similar to those of another Australian study in general practice, using data from the Bettering the Evaluation and Care of Health program (Charles et al., Reference Charles, Britt, Fahridin and Miller2007). Between 2004 and 2006 they found that 71% of antidepressants were indicated for depression, 15% were for other psychological indications, such as anxiety and sleep disturbance, and 14% for other non-psychological problems.
Among participants with depressive symptom scores ≥16, fewer than 20% were taking antidepressants at any wave, with no identifiable pattern over time. However, among the participants without depressive symptoms, there may have been an increase in the use of antidepressants (5% at wave 1 and 12% at wave 7). In the French study PAQUID, there was an increase in antidepressant use in both depressed and non-depressed respondents (Montagnier et al., Reference Montagnier, Barberger-Gateau, Jacqmin-Gadda, Dartigues, Rainfray and Peres2006). However, similar to our study, the use of antidepressants in depressed people remained low, between 15% and 25%. A Dutch study showed that while there was a doubling of antidepressant use in the subgroup with a major depressive disorder, the largest increase was found in the subgroup with sub-threshold depression (CES-D score above 16 but no major depressive disorder) measured with the Diagnostic Interview Schedule (Sonnenberg et al., Reference Sonnenberg, Deeg, Comijs, van Tilburg and Beekman2008). These results indicate overuse of antidepressants in mild depressive disorders where scientific evidence for their use is controversial. Alternatively, it is possible that antidepressant use could have contributed to improvement in depressive symptomatology or could have been prescribed to prevent recurrence of depression. In other words, if the antidepressants are having their desired effect there should be at least a portion of participants who are still taking them, but not showing depressive symptoms.
The persistence of antidepressant use for psychological reasons in this study was high, with 79% and 65% of users having been taking antidepressants for more than six months at wave 1 and wave 6, respectively. Some other studies have also found long duration of antidepressant use, with more than 80% of participants taking antidepressants for more than a year (Healy and Aldred, Reference Healy and Aldred2005; Esposito et al., Reference Esposito, Wang, Adair, Williams, Dobson and Schopflocher2007). However, short-term antidepressant use has also been reported in recent studies (Esposito et al., Reference Esposito, Wahl, Daniel, Stoto, Erder and Croghan2009; Sawada et al., Reference Sawada, Uchida, Suzuki, Watanabe, Kikuchi and Handa2009).
As is the case with any longitudinal study of older age groups, attrition occurs over the life of the study. In our study attrition was predominantly caused by mortality in the later waves of ALSA. In terms of dealing with the missing data in the cohort for those who were alive for the four waves but had incomplete information (missing data), we compared participants being interviewed and non-responders. The comparison showed that interviewed people were less likely to be cognitively impaired (see also Anstey and Luszcz, Reference Anstey and Luszcz2002) and reported higher perceived health at the previous wave. Therefore imputation of the missing data was problematic given the above difference between the interviewed and non-responders (the data are not missing at random) (Rubin, Reference Rubin1987). However, our results could be limited by the exclusion of the missing values, which is another common problem for longitudinal mental health studies with a long study period. In addition, although a long-term increase in antidepressant use was observed in this cohort, the use of antidepressants by participants during the intervals between waves could not be ascertained.
Previous work within ALSA examined the prevalence and risk factors for depression (Anstey et al., Reference Anstey, van Sanden, Sargent-Cox and Luszcz2007) in community-dwelling and residential aged care dwelling respondents. This study complements the previous one in that it is the first to investigate changes in the patterns of antidepressants in this group. Although the use of antidepressants increased over time, it remained low for people with depressive symptoms. This is in line with previous research suggesting less antidepressant treatment for older people with depression than younger people (Kendrick et al., Reference Kendrick, Dowrick, McBride, Howe, Clarke and Maisey2009). General practitioners may be reluctant to prescribe antidepressants because of potential interactions with other drugs (van Weel et al., Reference van Weel, van Weel-Baumgarten and van Rijswijk2009) and increased risk of falls (Kerse et al., Reference Kerse, Flicker, Pfaff, Draper, Lautenschlager and Sim2008; Pfaff et al., Reference Pfaff, Draper, Pirkis, Stocks, Snowdon and Sim2009).
In conclusion, the present results point to a number of areas of concern for those working with older adults. The correct use of antidepressants should be carefully monitored by health care professionals. Use of antidepressants over a long period should be done with caution, particularly in light of evidence of their being a risk factor for falling. On the other hand, there may be older people experiencing depressive symptoms that go undetected, and these individuals are also of concern, as severe depression is quite responsive to pharmacological treatment, although this combined with behavioral interventions is perhaps the optimal way to deal with depression in late life.
Conflict of interest
None.
Description of authors’ roles
Ying Zhang, Veronica Chow and Agnes Vitry designed the study and conducted the analyses. Elizabeth Roughead, Philip Ryan, Adrian Esterman, Gillian Gaughey and Andrew Gilbert participated in the analysis and the interpretation of the data, and reviewed the manuscript critically. Emmae Ramsay contributed to the data analyses and interpretation. Mary Luszcz conducted the ALSA study, provided raw data and reviewed the manuscript. All authors read and approved the final manuscript.
Acknowledgments
This study was supported by funding from a National Health and Medical Research Council/Australian Research Council Ageing Well Ageing Productively (AWAP) Program grant (APP ID 401832). We acknowledge the contributions of all the Chief Investigators who assisted with the preparation of this study including Professor Robyn McDermott and Dr. Sepehr Shakib. We thank the ALSA participants, the late Professor Gary Andrews and other staff from the Flinders (University) Centre for Ageing Studies for conducting the study and providing raw data and advice. Grants from the U.S. National Institute of Ageing (No. AG08523–02) and the National Health and Medical Research Council (No. 229933) funded the waves included in this report.