The effects of forest loss and habitat conversion on biodiversity are generally assessed by estimating trends in local species richness that provide only a partial view of biodiversity change (Magurran & McGill Reference Magurran and McGill2011). Studies integrating variation in species composition among sites (beta diversity; Anderson et al. Reference Anderson, Crist, Chase, Vellend, Inouye, Freestone, Sanders, Cornell, Comita, Davies, Harrison, Kraft, Stegen and Swenson2011) are useful in understanding the impacts of land-use changes on spatial distribution of species composition (Ribeiro et al. Reference Ribeiro, Colli, Batista and Soares2017, Socolar et al. Reference Socolar, Gilroy, Kunin and Edwards2016). Although concepts of beta diversity and species turnover have often used interchangeably in the ecological literature, the failure to recognize the distinction between dissimilarity due to species replacement (i.e. turnover) and dissimilarity due to species loss from site to site (i.e. nestedness) can lead to inappropriate use of some indices of beta diversity (Anderson et al. Reference Anderson, Crist, Chase, Vellend, Inouye, Freestone, Sanders, Cornell, Comita, Davies, Harrison, Kraft, Stegen and Swenson2011, Baselga Reference Baselga2010, Reference Baselga2012). For example, the turnover component generally reflects species sorting by environmental or dispersal processes, stochastic events, geographic barriers or large areas involving regions with different pools of species (Baselga Reference Baselga2010, Reference Baselga2012). The nestedness component is frequently connected to ordered extinction-colonization dynamics, with the sample of lower richness being a subset of species found in the richer sample (Baselga Reference Baselga2010, Reference Baselga2012). Thus, identifying the role of each of these beta diversity components is paramount to understand how diversity is shaped in response to multi-spatial scales, species sorting, different biological groups and life-history traits (Almeida-Gomes et al. Reference Almeida-Gomes, Rocha and Vieira2016, Melchior et al. Reference Melchior, Rossa-Feres and Da Silva2017, Soininen et al. Reference Soininen, Heino and Wang2018).
Here, we evaluated the spatial distribution of anuran beta diversity components in 18 temporary pools distributed across the north-western region of São Paulo State, Brazil. Previous studies in the region have showed that hydroperiod and vegetation complexity of the pools (Da Silva et al. Reference Da Silva, Gibbs and Rossa-Feres2011, Reference Da Silva, Candeira and Rossa-Feres2012a), and distance from the pool to the nearest forest fragments (Da Silva & Rossa-Feres Reference Da Silva and Rossa-Feres2011, Ribeiro et al. Reference Ribeiro, Colli, Batista and Soares2017) are important environmental descriptors explaining anuran species richness at the local scale. However, a lack of studies addressing distribution of anuran species composition in this region is worrying, because we are not aware: (1) if anuran species occurring in species-poor pools are subsets of anuran species occurring in species-rich pools (i.e. nestedness); or (2) if pools inserted in the landscape are hosting distinct anuran species composition (i.e. turnover) due to response of the anuran species to the environmental variables. Therefore, we evaluated how the spatial distributions of anuran beta diversity components, species replacement and nestedness, are associated with local and landscape descriptors in a tropical agricultural landscape. Considering that anuran species of this region are associated with open environments and are widely distributed (Provete et al. Reference Provete, Garey, Da Silva and Rossa-Feres2011), we hypothesized high values of species replacement among pools because of the variation in stochastic factors such as recruitment or random colonization (Melchior et al. Reference Melchior, Rossa-Feres and Da Silva2017).
The sites and sampling design are the same as those used in Da Silva et al. (Reference Da Silva, Gibbs and Rossa-Feres2011). Sampling took place throughout the north-western region of São Paulo State, Brazil. This region is among the most deforested and fragmented within São Paulo State, due to the expansion of grassland, rubber plantations and recently sugar cane (Rodrigues et al. Reference Rodrigues, Joly, De Brito, Paese, Metzger, Casatti, Nalon, Menezes, Ivanauskas, Bolzani and Bononi2008). It is characterized by an annual mean temperature between 22°C and 23°C with a well-defined rainy season between October and March, and a pronounced dry season between April and September, when only 15% of the total annual rainfall (mean ± SD = 1100 ± 225 mm) occurs. The 18 selected temporary pools were inserted in a pasture matrix. The minimum and maximum distances between any two pools were 0.15 and 201 km, respectively (mean distance = 85.8 km). Sampling was conducted every 2 wk during the rainy season, October 2008 to March 2009, between 19h00 to 24h00, totalling 12 surveys per pool. Visual and acoustic surveys involved walking the perimeter of each pool upon arrival and recording the presence of anuran species observed or heard calling. For further details, see Da Silva et al. (Reference Da Silva, Gibbs and Rossa-Feres2011).
We used nine local and landscape scale variables recognized as important to anuran species (Da Silva et al. Reference Da Silva, Gibbs and Rossa-Feres2011, Reference Da Silva, Candeira and Rossa-Feres2012a; Van Buskirk Reference Van Buskirk2005). The local variables are: (1) hydroperiod (HDP) – classified in short (≤ 3 mo) and long (> 3 mo with water), (2) area – surface area based on the formula of an ellipse, (3) percentage of vegetation in the interior of the pool (PVI) – measured in increments of 0–20%, 21–50%, 51–80% and 81–100%, (4) percentage of vegetation in the margin of the pool (PVM) – measured in increments of 0–20%, 21–50%, 51–80%, and 81–100%, (5) heterogeneity of vegetation in the interior of the pool (HVI) – classified according to prevalence of vegetation types, and (6) heterogeneity of vegetation in the margin of the pool (HVM) – classified according to prevalence of vegetation types. The landscape variables are: (1) distance from pool to nearest forest fragment (DFR), (2) distance to nearest breeding pool (DBA), and (3) distance to nearest paved road (DR). We standardized the local and landscape variables to zero mean and unit variance due to different measure scales. The standardized data were used as predictor variables in the subsequent analyses.
We calculated the pairwise dissimilarity in species composition between sampled pools by partitioning the Sørensen index (βsor) into two components (Baselga Reference Baselga2010, Reference Baselga2012): (1) the turnover component (βsim), which uses the Simpson index to account for the proportion of unique species in two sites pooled together if both sites are equally rich; and (2) the nestedness component (βsne), which measures how dissimilar the sites are due to a nested pattern. We used a forward selection procedure with double stopping criteria (Blanchet et al. Reference Blanchet, Legendre and Borcard2008) to only select local and landscape variables that significantly explained the variance in the species composition matrix. Based on species composition, heterogeneity in the margin of pools and distance to nearest forest fragment were the only local- and landscape-variables retained by forward selection, respectively. Then, we performed a partial redundancy analysis with variation partitioning (Dray et al. Reference Dray, Pélissier, Couteron, Fortin, Legendre, Peres-Neto, Bellier, Bivand, Blanchet, Cáceres, Dufour, Heegaard, Munoz, Oksanen, Thioulouse and Wagner2012) to determine the relative importance of geographic distance (Euclidean distance inferring the distance decay of similarity between sites) and local and landscape variables in explaining variation in beta diversity components. We determined the significance of the first three fractions using a partial redundancy analysis with 999 Monte Carlo permutations. All analyses were conducted in the statistical software R version 3.5.0.
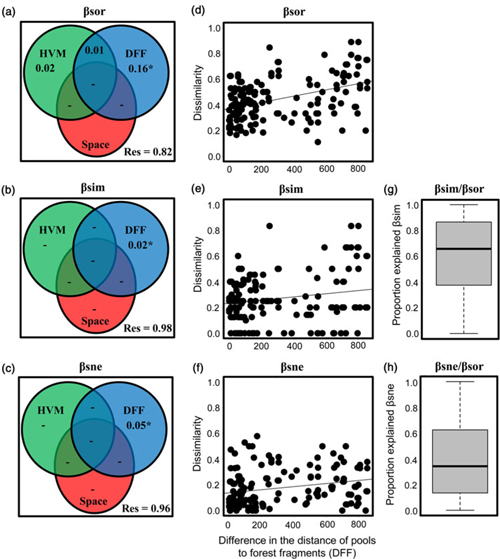
Overall, 27 anuran species were found in the region with average ± SD species richness in each pool of 9.5 ± 3.5 species, ranging from 4 to 15 species. We found that the variance of beta diversity components was associated to distance from pools to the nearest forest fragment, explaining 16% of variance in total beta diversity (βsor), 5% of variance of nestedness-resultant (βsne) component, and 2% of spatial turnover (βsim) component (Figure 1). Thus, most of anuran species occurring in pools distant from the forest fragments are different from anuran species occurring in pools near forest fragments (Figure 1). These results are complementary to previous studies that evaluated patterns of species richness distribution in the region (Da Silva & Rossa-Feres Reference Da Silva and Rossa-Feres2011, Da Silva et al. Reference Da Silva, Oliveira, Gibbs and Rossa-Feres2012b, Ribeiro et al. Reference Ribeiro, Colli, Batista and Soares2017). For example, Da Silva et al. (Reference Da Silva, Oliveira, Gibbs and Rossa-Feres2012b) in a study conducted within the same region with artificial ponds, showed that breeding sites located both at the edge of and near to (within 50 m of) forest fragments supported greater abundance and species richness of frogs and toads than breeding sites located 100 and 200 m far from forest fragments. Forest fragments have been identified as important habitats that enhance landscape connectivity (Laan & Verboom Reference Laan and Verboom1990) and provide refuge for many species that spend part or all the time in trees, bushes or in leaf litter when not breeding (Knutson et al. Reference Knutson, Sauer, Olsen, Mossman, Hemesath and Lannoo1999). Although pools near forest fragments harbour higher anuran species richness than pools distant from forest fragments (Da Silva & Rossa-Feres Reference Da Silva and Rossa-Feres2011, Da Silva et al. Reference Da Silva, Oliveira, Gibbs and Rossa-Feres2012b), our results show that farmland pools at different distance to nearest forest fragments are harbouring different anuran species composition.
Partitioning of the variance of anuran species composition explained by geographic distance (space), heterogeneity in the margin of pools (HVM) and distance to nearest forest fragment (DFF) for 18 pools in the north-western region of São Paulo State, Brazil. Total beta diversity (βsor) (a), dissimilarity due to species replacement (i.e. turnover – βsim) (b) and dissimilarity due to species loss from site to site (i.e. nestedness – βsne) (c). Res = unexplained variance. * = P values < 0.05. ‘-’ = variation explained ≤ 0. Relationships between the difference in the distance to nearest forest fragment (DFF) and compositional beta diversity components – βsor (d), βsim (e) and βsne (f). Proportion explained by turnover (βsim/βsor) (g) and nestedness (βsne/βsor) (h) components.

We confirmed our hypothesis that spatial turnover is the dominant component of anuran beta-diversity in farmland pools (Figure 1). This pattern seems not to be specific to partition of anuran beta diversity (Almeida-Gomes et al. Reference Almeida-Gomes, Rocha and Vieira2016, Da Silva et al. Reference Da Silva, Almeida-Neto and Arena2014, Melchior et al. Reference Melchior, Rossa-Feres and Da Silva2017), but also for different organisms and ecosystems. For example, Soininen et al. (Reference Soininen, Heino and Wang2018) performed a meta-analysis of nestedness and turnover components of beta diversity and found that species turnover was consistently the larger component of total beta diversity. Although spatial turnover and nestedness components tended to be associated with distance to nearest forest fragments, the relative importance of environmental variables and geographic distance in explaining the variation of anuran beta diversity was extremely low (Figure 1). This implies that important variables were not included in the analysis (Jacobson & Peres-Neto Reference Jacobson and Peres-Neto2010, Soininen Reference Soininen2014) or environmental variables are not better at predicting anuran beta distributions than any randomly chosen set of non-biological variables. Studies using pools as sampling units have found that both stochastic and deterministic factors might be important mechanisms structuring anuran assemblages, but they are dependent on the region studied (Melchior et al. Reference Melchior, Rossa-Feres and Da Silva2017). We observed that pools contain fewer species than the total species richness observed in the regional species poll, indicating that ponds differ in species composition. Considering that most anuran species recorded in this region are adapted to the agricultural matrix and habitat generalists and that characteristics of the pools are satisfactory to support the life cycle and reproduction (Provete et al. Reference Provete, Garey, Da Silva and Rossa-Feres2011), it is possible that stochastic processes such as recruitment or random colonization could be driving species occurrence in farmland pools (Chase & Myers Reference Chase and Myers2011, Melchior et al. Reference Melchior, Rossa-Feres and Da Silva2017). Thus, we should focus on keeping as many pools as possible distributed across farmland landscapes to contribute to regional diversity, especially in this region that is considered one of the most deforested and fragmented within São Paulo State, Brazil.
Author ORCIDs
Rodrigues da Silva https://orcid.org/0000-0002-0983-3207
Financial support
We thank Fundação de Amparo à Pesquisa do Estado de São Paulo – FAPESP (Grants 13/50714-0, 07/50738-5 and 04/12223-5) for financial support.