Implications
There is limited evidence in this study that European conformation score or European fat score have any relationship with eating quality. If value is defined by a combination of quality and volume, then the European industry must look beyond the European conformation and fat scores in order to deliver an eating quality-based price signal to all levels of the supply chain, and therefore meet consumer demands for a consistent and quality product.
Introduction
Variability in eating quality is seen as a major factor in the decline in beef consumption (Morgan, Reference Morgan1992; Polkinghorne et al., Reference Polkinghorne, Thompson, Watson, Gee and Porter2008). With all industry revenue either directly or indirectly linked to both consumer satisfaction and purchase volume, payment systems within the supply chain should ideally reflect the consumer value delivered by that sector (Polkinghorne and Thompson, Reference Polkinghorne and Thompson2010), with value being defined as a combination of weight and quality. In the European Union, however, beef carcasses are valued on the basis of production class (bull, steer, heifer, cow), carcass weight and the European carcass classification score. This score is a combination of a visual assessment of carcass muscling and fatness by either a certified human grader or video image analysis system. The European carcass classification system was introduced to provide a standardised description of the carcass that would underpin an industry pricing system, particularly where the purchaser was unable to view the carcass before sale (Fisher, Reference Fisher2007) and the value of each class or category would be determined by the requirements of each individual market. Many of the factors that influence carcass muscling and fatness characteristics, and therefore the European carcass grade, also influence eating quality, such as breed, sex and production system (Field, 1971; De Roest, Reference De Roest2015; Soji et al., Reference Soji, Mabusela and Muchenje2015). However, few studies have evaluated the relationships between the European carcass classification system and sensory evaluation of meat quality.
Consumer assessment of eating quality, in particular juiciness and flavour, has a strong positive relationship with marbling score and chemical intramuscular fat percentage (IMF) (Thompson, Reference Thompson2001 and Reference Thompson2004). European fat cover score also demonstrates some correlation with marbling score and chemical IMF (R 2=0.29 to 0.49) (Indurain et al., Reference Indurain, Carr, Goni, Insausti and Beriain2009) along with other measures of adiposity. For example, Conroy et al. (Reference Conroy, Drennan, McGee, Keane, Kenny and Berry2010) found with a one unit increase in European fat cover score (using the full 15-point scale) as the proportion of total fat in the carcass increased by 12.00 g/kg (determined with dissection). Similarly, in Irish steers fat depth over the m. longissimus thoracis et lumborum, as recorded with ultrasound pre-slaughter, also has a moderately strong positive correlation (0.63) with European fat cover score (Conroy et al., Reference Conroy, Drennan, Kenny and McGee2009). Given the association between fatness and eating quality, this indicates that it is possible that increasing European fat cover score will be associated with improved eating quality.
In contrast, the other part of the European carcass classification score, European conformation score, has a negative relationship with carcass fat proportion, marbling score and chemical IMF. In Holstein-Friesians, every one point increase in European conformation score (using the full 15-point scale) was associated with a 4.40 g/kg reduction in carcass fat proportion (Conroy et al., Reference Conroy, Drennan, McGee, Keane, Kenny and Berry2010). Likewise, European conformation score demonstrated a negative simple correlation with marbling score in 2-year old Holstein-Friesian and Holstein-Friesian cross Angus steers with values of r=−0.19 and −0.22 (Conroy et al., Reference Conroy, Drennan, Kenny and McGee2009), and also with chemical intramuscular fat levels in Pirenaica yearling bulls with values of −0.44 (Conroy et al., Reference Conroy, Drennan, Kenny and McGee2009; Indurain et al., Reference Indurain, Carr, Goni, Insausti and Beriain2009). In contrast, Guzek et al. (Reference Guzek, Głąbska, Lange and Głąbski2014) found that cross-bred Limousin-Holstein-Friesian bulls failed to exhibit a difference in IMF and collagen levels between European conformation scores P and O. Therefore, on the balance of the evidence and given the importance of fatness and IMF for eating quality, it seems plausible that European conformation score will have a negative relationship with eating quality.
However, despite the negative relationship between IMF and European conformation score, Guzek et al. (Reference Guzek, Glabska, Pogorzelski, Kozan, Pietras, Konarska, Sakowska, Glabski, Pogorzelska, Barszczewski and Wierzbicka2013) found no difference in tenderness (estimated by Warner-Bratzler shear force) between Limousin bulls with a very limited range of European conformation scores, U−, U= or U+. This may be due to the influence of the myostatin mutation. It has been demonstrated that this mutation concurrently increases European conformation scores and improves tenderness while decreasing IMF. Allais et al. (2010) found that heterozygous carriers of the myostatin mutation within the breeds Charolais, Limousin and Blond d’Aquitaine scored 1.40±0.12, 1.38±0.24, 0.83±0.43 points, respectively, higher European conformation scores (using a 18-point scale) than animals without the mutation. When the eating quality of these carcasses was evaluated the heterozygous animals scored significantly higher by 2.13±0.69 points in tenderness and significantly lower by 0.96±0.21 points in flavour (trained taste panel, score 0 to 100) than individuals without the myostatin mutation. Juiciness scores were unchanged. Therefore, as a result of the conflicting influences of muscling and fatness on eating quality, there appears to be no consistent association between European conformation score and eating quality. Consequently we hypothesise that, while European fat score will have a positive relationship with eating quality, European conformation score will have no overall relationship with eating quality for commercial carcasses.
Material and methods
Animals and muscle samples
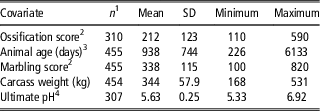
A total of 455 cattle were chosen randomly at abattoirs on the day of sampling to reflect the different commercial production practices within France, Poland, Ireland and Northern Ireland. As a result the carcasses had an uneven distribution of age, sex and carcass composition (Tables 1 and 2). The Polish carcasses were processed at a number of facilities distributed across the country. The Irish carcasses were processed at two commercial abattoirs and one pilot scale abattoir. The French carcasses were processed at a single facility in the West of France. The carcasses from Northern Ireland were processed at five different facilities distributed across the region. The cattle travelled for up to 5 h to the abattoirs and were slaughtered commercially according to standard practice in each country. European conformation and fat scores were graded automatically by certified video image analysis systems already installed at the abattoirs. These scores both have a five-point scale (E-U-R-O-P for conformation and 5 to 1 for fat score) and each score can be further broken down into high, medium and low creating a total of 15 possible scores. There is an additional ‘S’ class in the conformation score to describe carcasses from double muscled animals, which are beyond the scope of this study.
Number of carcasses and the raw maximum, minimum, mean and standard deviation for the measured covariates

n=number of carcasses.
1 The number of carcasses varies for each measure because not all measurements were recorded for all carcasses.
2 Measures were recorded as standard MSA (Meat Standards Australia) measurements by trained graders.
3 Chronological age in days.
4 The pH of the m. longissimus thoracis et lumborum recorded 24 h post-slaughter.
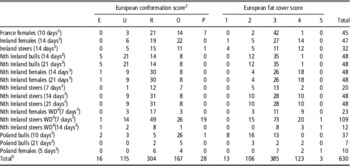
The number of carcasses for each European conformation and fat score by experimental groupFootnote 1

1 Experimental group is a concatenated term comprising of carcass source country, sex and postmortem ageing period.
2 A visual assessment of carcass muscling. Carcasses graded as ‘E’ have the most muscularity, and this decreases through to ‘P’ which have the least muscularity.
3 Days postmortem ageing before taste testing.
4 Samples cooked well-done.
5 The total number of carcasses here is greater than the total number in the study because some carcasses are represented in more than one ageing period.
Other measurements were graded by personnel trained in MSA (Meat Standards Australia) and USDA meat grading (USDA, 1997) according to standard MSA protocols for characteristics such as USA ossification (an estimate of maturity), USA marbling and ultimate pH. Ultimate pH was recorded at 24 h post-slaughter. All cattle were growth-promotant free as these are prohibited in the European Union.
There was a wide range in the carcass traits measured and the raw means and standard deviations are presented in Table 1. Due to the constraints of such an observational study, not all measurements were recorded for all carcasses. The wide ranges for ossification score and animal age reflect the very broad range of maturities represented in this data set. There is also a wide range in carcass weight and marbling score reflecting the different production systems both within and between the different countries. However, no information was collected on the individual farm management or production systems. A total of 30 carcasses had an ultimate pH >5.7. The majority of affected carcasses were from Poland (data not shown). All of the carcasses without records for ultimate pH were sourced from Northern Ireland or Ireland and there was no evidence during sampling that these carcasses were affected by high pH.
There were 45 French cattle, all females and all aged for 10 days except for the tenderloin (m. psoas major), which was aged for 5 days. In Ireland, there were 47 heifers and 32 steers that were sampled and had a single ageing period of 14 days. The Northern Irish cattle were split into two groups according to the degree of doneness (medium or well-done) for the statistical analysis and interpretation. All other samples in the study were prepared to a medium doneness for relevant cooking methods. Of the Northern Irish carcasses with samples prepared medium, there were 48 females and 48 bulls, aged for both 14 and 21 days and 66 steers aged for 7, 14 and/or 21 days. There were 21 females from Northern Ireland with samples cooked well-done, and there were 91 steers. Bulls from Poland were aged for either 10 or 21 days, and the females were aged for 10 days (Table 2). There was an uneven spread of carcasses within the European conformation and fat cover scores. The majority of carcasses had a European fat cover score of 3 and a European conformation score of either U, R or O (Table 2). This reflects the random nature of carcass selection and the distribution of carcasses found within Europe.
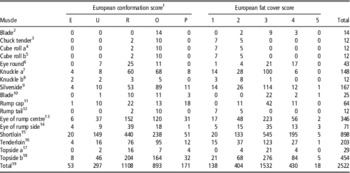
A total of 17 different muscles were represented in the 2530 different samples (Table 3); however, the number and type of muscles collected varied between carcasses. The muscles sampled were the: blade (m. triceps brachii caput laterale), chuck tender (m. supraspinatus), cube roll a (m. longissimus thoracis), cube roll b (m. spinalis dorsiI), eye of round (m. semitendinosus), knuckle a (m. rectus femoris), knuckle b (m. vastus lateralis), outside (m. biceps femoris), oyster blade (m. infraspinatus), rump cap (m. biceps femoris), rump tail (m. tensor fasciae latae), eye of rump centre (m. gluteus medius), eye of rump side (m. gluteus medius), striploin (m. longissimus thoracis et lumborum), tenderloin (m. psoas major), topside a (m. adductor femoris) and topside b (m. semimembranosus). These muscles represent a wide range of eating qualities and locations in the carcass. Six of the muscles, the silverside, eye of rump centre, eye of rump side, shortloin, tenderloin and the topside b were selected from carcasses across the full range of European conformation and fat scores.
The number of samples for each European conformation and fat score by muscle

1 A visual assessment of carcass muscling. Carcasses graded as ‘E’ have the most muscularity and this decreases through to ‘P’ which have the least muscularity.
2 m. triceps brachii caput laterale.
3 m. supraspinatus.
4 m. longissimus thoracis et lumborum.
5 m. spinalis dorsiI.
6 m. semitendinosus.
7 m. rectus femoris.
8 m. vastus lateralis.
9 m. biceps femoris.
10 m. infraspinatus.
11 m. biceps femoris.
12 m. tensor fasciae latae.
13 m. gluteus medius.
14 m. gluteus medius.
15 m. longissimus thoracis et lumborum.
16 m. psoas major.
17 m. adductor femoris.
18 m. semimembranosus.
19 The total number of muscles can be greater than the total number of carcasses per European conformation or fat score in Table 3 because muscles from both sides of the carcasses were tested in a subset of the data.
Meat preparation and consumer panels
Consumer assessment of eating quality was done according to protocols for MSA testing described by Watson et al. (Reference Watson, Polkinghorne and Thompson2008a). Each sample (muscle) was sectioned into five steaks of 25 mm in thickness. These steaks were halved after cooking making 10 portions available for tasting from each muscle. Each consumer received seven portions: the first portion (a link sample) was a steak derived from either a generic striploin or rump muscle and designed to be of average quality – the sensory scores for this steak were not part of the final statistical analysis. The remaining six steaks were derived from one of the muscles samples collected. Grilled steaks were cooked on a SILEX S-Tronic 163 GR Dual Contact grill with cast iron plates (Silex, Hamburg, Germany) set to 220°C to achieve an internal temperature of 60°C for a ‘medium’ cooking doneness, and 70°C for a well-done cooking doneness (Watson et al., Reference Watson, Polkinghorne and Thompson2008a).
In total, 960 French consumers (each scoring one link sample and three steaks from this study and three steaks sourced from Polish carcasses, the scores for which were not included in this analysis), 469 Irish consumers, 1552 Northern Irish consumers and 835 Polish consumers took part in the sensory testing. Consumers were sourced through both commercial consumer testing organisations and local clubs and charities. They were selected to reflect the general population of each country with the only requirement being that they considered meat an important part of their diet. Consumers only tested steaks from their own countries and scored them for tenderness, juiciness, flavour liking and overall liking, by making a mark on a 100 mm line scale, with the low end of the scale representing a negative response and the high end of the scale representing a positive response. For a more detailed description of the testing procedures see Anonymous (Reference Allais, Leveziel, Payet-Duprat, Hocquette, Lepetit, Rousset, Denoyelle, Bernard-Capel, Journaux, Bonnot and Renand2008). The consumers were expected to have only a small amount of variation between countries on the basis of previous work using the same consumer protocols (Thompson et al., Reference Thompson, Polkinghorne, Hwang, Gee, Cho, Park and Lee2008; Polkinghorne et al., Reference O’Quinn, Brooks, Polkinghorne, Garmyn, Johnson, Starkey, Rathmann and Miller2011; Legrand et al., Reference Legrand, Hocquette, Polkinghorne and Pethick2013).
Meat quality score (MQ4)
Each muscle from each carcass was assessed by 10 individual untrained consumers. There is a high correlation between all four sensory scores with a minimum partial correlation coefficient between any of the scores of 0.66 calculated on a subset of the data (Bonny et al., Reference Bonny, Gardner, Pethick, Legrand, Polkinghorne and Hocquette2015). The highest and lowest two scores for each muscle were removed, helping to eliminate extreme values and reducing the variability associated with using untrained consumers. The average was calculated for the remaining six scores. The combination of clipping and then averaging the remaining six scores acts to reduce the influence of any demographic effects in the database, allowing us to approximate a ‘general consumer’ response with the final value reached. In addition, these clipped mean values for tenderness, juiciness, flavour liking and overall liking were used to create a single MQ4 score. The weightings of the four sensory parameters (tenderness, juiciness, flavour liking and overall liking) to create the MQ4 score were 0.3×tenderness, 0.1×juiciness, 0.3×flavour liking and 0.3×overall liking. The weightings were calculated using a discriminant analysis, as performed by Watson et al. (Reference Watson, Gee, Polkinghorne and Porter2008b).
Statistical analysis
The sensory scores tenderness, juiciness, flavour liking, overall liking and the composite score MQ4 were analysed using a linear mixed effects model (SAS v9.1). Initially, a base model was established, using muscle and a concatenated term, experimental group, comprising of carcass source country, sex and postmortem ageing period. Animal identification number, within source country, and kill group (animals slaughtered on the same day at the same abattoir) as random terms. A term for carcass grader (either the human or video image analysis system measuring the European carcass grade, ossification score or marbling score) was not included in the model. Any variation in scores attributable to grader differences will have been captured by the random term kill group already present in the model as all the carcasses in the same kill group were measured by the same grader. The inclusion of animal identification number assumes that the correlation between eating quality scores in different muscles within the same animal are equal. This will result in the analysis being over sensitive in the case where the correlations of sensory scores between different muscles within the same animal are not equal, as could reasonably be expected. In order to account for this the significance level has been changed to P<0.01 for the term muscle type and all interactions with muscle type. The degrees of freedom were determined using the Kenward and Rodger technique. Consumers only scored meat samples from the same country, therefore any variation in consumers between countries will be encompassed by carcass source country in the analysis. The consumers were also not expected to have much variation between countries on the basis of previous work (Thompson et al., Reference Thompson, Polkinghorne, Hwang, Gee, Cho, Park and Lee2008; Polkinghorne et al., Reference O’Quinn, Brooks, Polkinghorne, Garmyn, Johnson, Starkey, Rathmann and Miller2011; Legrand et al., Reference Legrand, Hocquette, Polkinghorne and Pethick2013).
Separately, the European conformation score and European fat cover score were then incorporated into the base models as fixed effects, including all interactions, to assess their association with the sensory scores. In all cases, non-significant terms (P>0.05) were removed in a step-wise fashion. Where European conformation score or fat score was significant within individual muscles, an individual F-test was performed for the range of European conformation or fat score for each muscle. Where this F-test was significant (P<0.05) the predicted means were compared using the LSDs, generated using the Pdiff function in SAS (SAS v9.1). Following this the covariates USA ossification score, USA marbling score, ultimate pH, animal age and carcass weight were tested in the models to evaluate their effects on the relationship between the sensory scores and the European conformation and fat scores.
Results
European conformation score and sensory scores
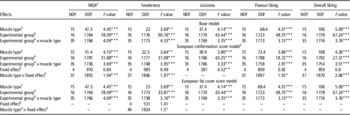
Outcomes for the core model are presented in Table 4. Muscle type and experimental group and the interaction between these two terms were significant for all sensory scores and MQ4. European conformation score had a significant interaction with muscle type for all attributes except juiciness, where it was significant as a main effect.
The F values for the base model, European conformation score model, the European fat cover score model predicting MQ4Footnote 5 and sensory score values

NDD=numerator degrees of freedom; DDF=denominator degrees of freedom.
1 A composite eating quality score out of 100 comprised of weighted (0.3, 0.1, 0.3, 0.3) untrained consumer scores for tenderness, juiciness, flavour liking and overall liking.
2 A visual assessment of carcass muscling. Carcasses graded as ‘E’ have the most muscularity and this decreases through to ‘P’ which have the least muscularity.
3 Muscle type: blade (m. triceps brachii caput laterale), chuck tender (m. supraspinatus), cube roll a (m. longissimus thoracis et lumborum), cube roll b (m. spinalis dorsiI), eye round (m. semitendinosus), knuckle a (m. rectus femoris), knuckle b (m. vastus lateralis), outside (m. biceps femoris), oyster blade (m. infraspinatus), rump cap (m. biceps femoris), rump (m. tensor fasciae latae), eye of rump centre (m. gluteus medius), eye of rump side (m. gluteus medius), striploin (m. longissimus thoracis et lumborum), tenderloin (m. psoas major) and topside (m. semimembranosus).
4 The experimental group refers to a concatenated term that comprises of carcass source country, carcass sex and postmortem ageing period of the muscle sample. There are a total of 16 different experimental groups.
5 The ‘fixed effect’ is either European conformation score of European fat cover score in the respective models.
*P<0.05; **P<0.01;***P<0.001.
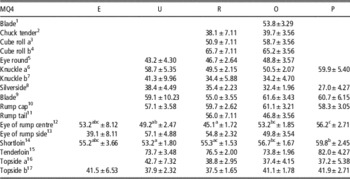
Only two muscles, the eye of rump centre and the shortloin, showed differences in MQ4 between the European conformation scores (Table 5). For the eye of rump centre, the MQ4 increased by ~7 points from score U (49.2±2.47) through to the lowest score P (56.2±2.71). For the shortloin the MQ4 increased by 6.5 points as the conformation score decreased from score U (53.2±1.80) to score P (59.8±2.45).
Predicted means (±SE) for the effects of European conformation score (five grades) on ^MQ4 for each muscle

^MQ4 is a weighted combination (0.3, 0.1, 0.3, 0.3) of four sensory scores, tenderness, juiciness, flavour liking and overall liking as scored by untrained consumers.
Blank spaces indicate cells without data.
1 m. triceps brachii caput laterale.
2 m. supraspinatus.
3 m. longissimus thoracis et lumborum.
4 m. spinalis dorsiI.
5 m. semitendinosus.
6 m. rectus femoris.
7 m. vastus lateralis.
8 m. biceps femoris.
9 m. infraspinatus.
10 m. biceps femoris.
11 m. tensor fasciae latae.
12 m. gluteus medius.
13 m. gluteus medius.
14 m. longissimus thoracis et lumborum.
15 m. psoas major.
16 m. adductor femoris.
17 m. semimembranosus.
a,b,cValues within a row with different superscripts differ significantly at P<0.05.
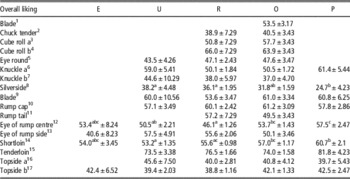
Similar to MQ4, overall liking also demonstrated a negative relationship with European conformation score for the eye of rump centre and the shortloin (Table 6). For the eye of rump centre, scores increased by seven points as the European conformation score decreased from U (50.5±2.21) to P (57.5±2.47). There was a similar pattern for the shortloin where overall liking scores increased by 7.5 points as the European conformation score decreased from U (53.2±1.35) to P (60.7±2.14).
Predicted means (±SE) for the effects of European conformation score (five grades) on overall liking for each muscle

Blank spaces indicate cells without data.
1 m. triceps brachii caput laterale.
2 m. supraspinatus.
3 m. longissimus thoracis et lumborum.
4 m. spinalis dorsiI.
5 m. semitendinosus.
6 m. rectus femoris.
7 m. vastus lateralis.
8 m. biceps femoris.
9 m. infraspinatus.
10 m. biceps femoris.
11 m. tensor fasciae latae.
12 m. gluteus medius.
13 m. gluteus medius.
14 m. longissimus thoracis et lumborum.
15 m. psoas major.
16 m. adductor femoris.
17 m. semimembranosus.
a,b,cValues within a row with different superscripts differ significantly at P<0.05.
Only the eye of rump centre increased in tenderness as European conformation decreased, with an increase of 8.6 as conformation score decreased from U (45.7±4.67) to P (54.3±4.89). This trend was also seen with score R (41.1±4.13) having a lower tenderness than scores O (50.1±4.21) and P (54.3±4.89). The predicted mean tenderness score for conformation score E (55.5±10.69) was not different to the scores for any other conformation class. No other muscles showed differences in tenderness between the European conformation scores.
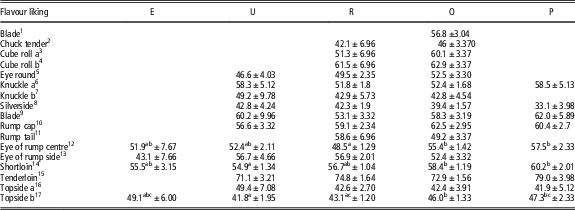
Three muscles demonstrated a difference in flavour liking between European conformation scores, the eye of rump centre, the shortloin and the topside b (Table 7). For all three muscles the trend was for flavour scores to increase as European conformation scores decreased from U through to P. Flavour liking for the eye of rump centre increased by nine points as conformation score decreased from R to P. The shortloin and the topside flavour liking scores increased by five points between conformation scores U and P.
Predicted means (±SE) for the effects of European conformation score (five grades) on flavour liking for each muscle

Blank spaces indicate cells without data.
1 m. triceps brachii caput laterale.
2 m. supraspinatus.
3 m. longissimus thoracis et lumborum.
4 m. spinalis dorsiI.
5 m. semitendinosus.
6 m. rectus femoris.
7 m. vastus lateralis.
8 m. biceps femoris.
9 m. infraspinatus.
10 m. biceps femoris.
11 m. tensor fasciae latae.
12 m. gluteus medius.
13 m. gluteus medius.
14 m. longissimus thoracis et lumborum.
15 m. psoas major.
16 m. adductor femoris.
17 m. semimembranosus.
a,b,cValues within a row with different superscripts differ significantly at P<0.05.
The effect of European conformation score on juiciness scores were consistent for all muscles tested. Juiciness score for European conformation scores U (49.7±2.19) and R (50.9±2.02) were different to O (53.4±2.10) and P (56.0±2.50) with a decrease in juiciness scores of four points across the range. Carcasses with score E (49.8±3.81) did not differ from any other conformation class.
When ossification score, animal age, marbling score, carcass weight or ultimate pH were added to the models there was no change. In contrast, when USA marbling score was included in the model predicting juiciness, European conformation score was no longer significant.
European fat score and sensory scores
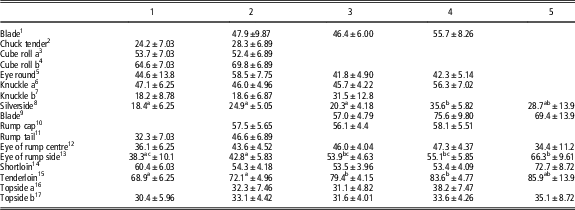
European fat score interacted with muscle type for tenderness. It was not significant when predicting flavour liking or any other attribute (Table 4). There was a general trend for tenderness score to increase as the European fat score increased for the three muscles, the silverside, eye of rump side and the tenderloin (Table 8). The addition of USA marbling score, another measure of carcass adiposity, eliminated the relationship between tenderness and European fat score. No other covariates had an effect.
Predicted means (±SE) for the effects of European fat score (five grades) on tenderness for each muscle

Blank spaces indicate cells without data.
1 m. triceps brachii caput laterale.
2 m. supraspinatus.
3 m. longissimus thoracis et lumborum.
4 m. spinalis dorsiI.
5 m. semitendinosus.
6 m. rectus femoris.
7 m. vastus lateralis.
8 m. biceps femoris.
9 m. infraspinatus.
10 m. biceps femoris.
11 m. tensor fasciae latae.
12 m. gluteus medius.
13 m. gluteus medius.
14 m. longissimus thoracis et lumborum.
15 m. psoas major.
16 m. adductor femoris.
17 m. semimembranosus.
a,b,cValues within a row with different superscripts differ significantly at P<0.05.
Discussion
European conformation score and sensory scores
The hypothesis that there would be no relationship between the European conformation score and untrained consumer sensory scores was almost completely supported by our results. For the vast majority of muscles there were no relationships between European conformation score and eating quality attributes. These results expand on the findings of both Guzek et al. (Reference Guzek, Glabska, Pogorzelski, Kozan, Pietras, Konarska, Sakowska, Glabski, Pogorzelska, Barszczewski and Wierzbicka2013) and Guzek et al. (Reference Guzek, Głąbska, Lange and Głąbski2014) who also found no relationship between a limited range of European conformation scores and intramuscular fat, collagen and tenderness.
Where there was a relationship between eating quality and European conformation score it was negative. However, when marbling score was included in the statistical model predicting juiciness, European conformation score was no longer significant. This suggests that the negative relationship between juiciness and European conformation is a result of the positive relationship between marbling score and juiciness (Thompson, Reference Thompson2004) and the negative relationship between marbling score and European conformation score (Conroy et al., Reference Conroy, Drennan, Kenny and McGee2009). This relationship between marbling score, conformation score and quality was not present for the other sensory scores. This is unexpected given the high correlation between the sensory scores (Bonny et al., Reference Bonny, Gardner, Pethick, Legrand, Polkinghorne and Hocquette2015) and the relationship between marbling and tenderness, flavour and overall liking of beef (Thompson, Reference Thompson2004; O’Quinn et al., 2012). Given the small number of significant results we cannot discount the possibility that these few differences found in the sensory scores other than juiciness, are simply due to the oversensitivity of the covariance structure. Furthermore, the likelihood of detecting random relationships, particularly within individual muscle groups, would be increased by the relatively small and unbalanced nature of this data set. This includes uneven representations of sex, animal source countries, production systems and breed, which are also known to influence both muscling score and eating quality (Field, 1971; De Roest, Reference De Roest2015; Soji et al., Reference Soji, Mabusela and Muchenje2015).
However, if it is proven that these relationships are not random and were repeatable, the relatively small magnitude of these effects, within a small number of muscles, would make it difficult for an eating quality grading system based on the European conformation score to be accurate and simple enough to be embraced by industry (Strydom, Reference Strydom2011). This is particularly true given that the international beef trade is now dominated by chilled primal cuts rather than whole carcasses (Polkinghorne and Thompson, Reference Polkinghorne and Thompson2010).
European fat score and sensory scores
The hypothesis that European fat score would have a positive relationship with sensory scores was very minimally supported by our results. Only three of the 17 muscles showed a positive relationship between European fat score and tenderness. Where the relationship between tenderness and European fat score was present, it was completely explained by marbling score. This indicates that, for those three muscles, European fat score was explaining a proportion of the variance in eating quality through its relationship with carcass fatness and marbling score (Indurain et al., Reference Indurain, Carr, Goni, Insausti and Beriain2009; Conroy et al., Reference Conroy, Drennan, McGee, Keane, Kenny and Berry2010 and Reference Conroy, Drennan, Kenny and McGee2009). All other muscles and sensory scores demonstrated no relationships. This is unexpected given the high correlation between the sensory scores (Bonny et al., Reference Bonny, Gardner, Pethick, Legrand, Polkinghorne and Hocquette2015), the relationship between European fat score and carcass fatness and marbling (Indurain et al., Reference Indurain, Carr, Goni, Insausti and Beriain2009; Conroy et al., Reference Conroy, Drennan, McGee, Keane, Kenny and Berry2010 and Reference Conroy, Drennan, Kenny and McGee2009), and the relationship between marbling and tenderness, flavour and overall liking of beef (Thompson, Reference Thompson2004; O’Quinn et al., 2012). This discrepancy between the results and the hypothesis may be due to the poor spread of data across the range of European fat scores, particularly at the fat score extremes effectively truncating the range of this study. In addition, the subsets of the data include uneven representations of sex, animal source countries, production systems and breed, all of which are also known to influence both fatness and eating quality (Field, 1971; De Roest, Reference De Roest2015; Soji et al., Reference Soji, Mabusela and Muchenje2015). However, these factors represent the standard production systems within the countries sampled, with therefore a large proportion of effect of production system and the distributions of sex and breed on both eating quality and European fat score being absorbed by including animal source country in the analysis. A meat grading system needs to be simple, easy to apply and accurate in order to facilitate market uptake (Strydom, Reference Strydom2011). Therefore, if a relationship between European fat score and eating quality exists outside of the distribution and range of sex, breed and fat scores found in this study, it would be of limited usefulness in a commercial eating quality grading system.
Conclusion
The lack of any strong clear relationship between sensory scores and the European conformation and fat scores in this study indicates that the European beef industry cannot rely on these carcass grades alone to incorporate eating quality in the determination of carcass value. Alternative measures must be investigated to enable the inclusion of eating quality into the European meat grading system and the subsequent delivery of consistent, quality beef to the consumer.
Acknowledgements
This research was supported by Meat and Livestock Australia and Murdoch University. Data were obtained through the financial contributions of the European research project ProSafeBeef (Contract No. FOOD-CT-2006-36241), the Polish ProOptiBeef Farm to Fork project funded by the EU Innovative (POIG.01.03.01-00-204/09), the French ‘Direction Générale de l’Alimentation’ and FranceAgriMer, the Irish Department of Agriculture Food and The Marine under the FIRM programme, and the Northern Ireland Department of Agriculture and Rural Development ‘Vision’ programme. Furthermore, this project would not have been possible without the practical support of the Association Institut du Charolais, the Syndicat de Défense et du promotion de la Viande de Boeuf de Charolles and the gourmet restaurants ‘Jean Denaud’ and representatives of the beef industry across Europe. The international travel required for this project has been funded by ‘Egide/Fast’ funds from the French and Australian governments, respectively (project no. FR090054), and by ‘Egide/Polonium’ funds from the French and Polish governments, respectively. The assistance and participation of the Beef CRC and Janine Lau (MLA, Australia), Alan Gee (Cosign, Australia), Ray Watson (Melbourne University, Australia) and John Thompson (UNE) are also gratefully acknowledged.