Introduction
Cardiovascular diseases (CVDs), are the leading cause of disease burden worldwide in recent years, especially in low- and middle-income countries.Reference Ibrahim and Damasceno 1 For example, about 75% of hypertensive patients live in developing countries, where health resources are limited and the awareness of disease control is low.Reference Chow, Teo and Rangarajan 2 A series of studies find an increasing prevalence of hypertension in developing countries, possibly caused by urbanization, aging of population, changes to dietary habits and social stress.Reference Ibrahim and Damasceno 1 A large number of complex factors coupled with genetic predisposition play an important role on increasing prevalence of CVDs.Reference Bhargava, Sachdev and Fall 3 There is no doubt that genetic factors play an irreplaceable role at all stages of ontogeny. Phenotypic expression, however, is regulated by many factors, especially the nutritional and hormonal environment.Reference Neunlist and Schemann 4 The nutritional and hormonal environment is not fixed, but is constantly changing at different stages of growth.
Three major stages of growth have been identified by Karlberg,Reference Karlberg, Jalil, Lam, Low and Yeung 5 namely fetal–infant, childhood and puberty. With the theory of Developmental Origins of Health and Disease originating in the past two decades, there was plenty of evidence showing that fetal–infant malnutrition was associated with low birth weight and adult chronic diseases.Reference Barker 6 – Reference Wang, Li, Yang, Zou and Ma 9 However, there are few reports about the relationship between nutritional status from childhood to puberty and adult chronic diseases.
Over the past three decades, with the economic development of China, the Chinese population was experiencing a rapid nutrition transition from undernutrition to overnutrition. Nowadays, most of Chinese people older than 45 years were born and raised in very poor eras, and are experiencing Chinese rapid economic development and living a rich life in the recent 20 years, meanwhile, they have higher prevalence of some chronic diseases compared with the >45 years 10 years ago, and the prevalence of hypertension, diabetes, dyslipidemia and obesity were 29.3, 4.3, 22.9, 10.2 and 29.3% in 2002.Reference Li, Rao and Kong 10 In the latest survey in 2011–2012, it was reported that the prevalence of hypertension, diabetes, dyslipidemia and overweight/obesity were 39.9, 18.7, 62.6 and 32.6%, respectively, among Chinese middle-aged and elderly population who had undergone the nutrition transition.Reference Yang, Qian and Hu 11 Through recalling the food consumed in childhood and youth, we aimed to examine the association of undernutrition during the growth period with dietary behaviors and cardiovascular risk factors in a middle-aged Chinese population.
Materials and methods
Participants
The study was a cross-sectional survey conducted in Hefei City, the capital of Anhui Province in the east of China from December 2011 to June 2012. We chose two residential villages/communities from every county/area randomly, and all people aged 45–60, who lived in the selected villages/communities, according to resident health records, were included in the study. Total 1756 subjects were invited to the Medical Center for Physical Examination, the Armed Police Hospital of Anhui, where the subjects were interviewed face to face by a trained interviewer. We excluded 62 individuals with missing or incomplete dietary information in their questionnaires. Thus, 1694 subjects were included in the final analysis.
Data collection
Extensive data were collected using a structured self-report questionnaire supervised by trained interviewers. Detailed data were collected, including age, race, education, economic status, family history of chronic diseases, smoking, alcohol consumption, current diet and anthropometric measures. Eating behaviors were also recorded by self-compiled questions.
The information of early nutritional status was assessed by asking ‘How about the living condition in your family? When you were about 10 years old or in your adolescence?’ There were two options: (1) poor, eating animal food rarely (less than once a week), and the staple food being mainly coarse grains; (2) rich, eating animal food at least once a week, and the staple food being mainly refined grains. Subjects were categorized into three groups according to their diet in the growth period. Group 1 included those subjects, who always lived a poor life and consumed animal food rarely from birth to 18 years old, representing the undernutrition group. Group 2 included those subjects, who lived a poor life before 12 years old and improved in their adolescence, representing the nutritional improvement group. Group 3 included those subjects who always lived a relative rich life and intake animal food at least once a week from birth to 18 years old, representing the good nutrition group.
Height and weight were measured twice and averaged when subjects were barefoot and dressed in light indoor clothing. Body mass index was calculated by dividing the body mass (kg) by the square of the height (m2). By using an inelastic plastic tape, waist circumference (WC) was measured at a level midway between the lowest rib and the iliac crestReference Wang, Thornton and Bari 12 and hip circumstance at the most prominent part of the horizontal position of the hip.Reference Berg, Lappas and Strandhagen 13 Waist–hip rate was calculated by divided waist measurement (cm) by hip measurement (cm). All data were measured to the nearest 0.1 cm or 0.1 kg.
An interviewer-administered questionnaire was used to assess physical activity of the past month including the level of physical activity at work, transportation, exercise, sitting, sleeping and household activities. The average time and frequency of each item were asked patiently and recorded in writing. According to the physical activity assessment methods in the United States,Reference Ainsworth, Haskell and Whitt 14 physical activity levels were measured as metabolic equivalent in hours per week (MET-h/week) in which different MET levels were ranged on a scale from sleeping (0.9 METs) to high-intensity physical activities (>6 METs).
Blood pressure was measured twice by a trained nurse using a mercury sphygmomanometer. As a rule, measurements were taken with subjects in a sitting position after a minimum 10-min rest. Thereafter, the mean of two measurements was identified as the blood pressure of the subject.
Fasting overnight (12 h), blood samples were collected between 7 am and 9 pm and then allowed to clot for 1–3 h at room temperature. Serum samples were separated by centrifuging at 3000 rpm for 15 min at room temperature. Measurements of routine health check-up items including fasting blood glucose (FG), serum triglycerides (TG), total cholesterol (TC), high-density lipoprotein and low-density lipoprotein (LDL)-cholesterol were conducted through the Hitachi 7180 auto-analyzer (Hitachi, Tokyo, Japan) in the Medical Center for Physical Examination, the Armed Police Hospital of Anhui.
Definition of other variables
Hypertension was defined as systolic blood pressure level of ⩾130 mmHg or/and diastolic blood pressure level of ⩾80 mmHgReference Whelton, Carey and Aronow 15 or being medically treated now. The TG level of ⩾2.26 mmol/l was identified as hypertriglyceridemia, and hypercholesterolemia was serum TC level of ⩾6.22 mg/dl. 16 Diabetes was determined as FG level of ⩾7.0 mmol/lReference Vijan 17 or self-report of physician diagnosis and currently receiving antidiabetic medication. The excessive alcohol use was classified as alcohol consumption of >25 g/day in men and 15 g/day in women.
Statistical analysis
Data were presented as the mean±s.d. for continuous variables and as sum (proportions) for categorical variables. Differences between groups were analyzed by using the one-way ANOVA for continuous variables and χ 2 test for categorical variables. The comparison of the amount of food intake was achieved by multivariable variance analysis, and adjusted for monthly income. Group 3 as a reference, adjusting for age, education, smoking status and other confounding factors, multivariable logistic regression analysis was used to analyze the association between different groups of nutritional status and cardiovascular risk factors. All statistical analyses were performed by using SPSS (version 16.0; SPSS Inc., Chicago, IL, USA) and P<0.05 was considered statistically significant. It was stated that the significance levels quoted were two-sided.
Results
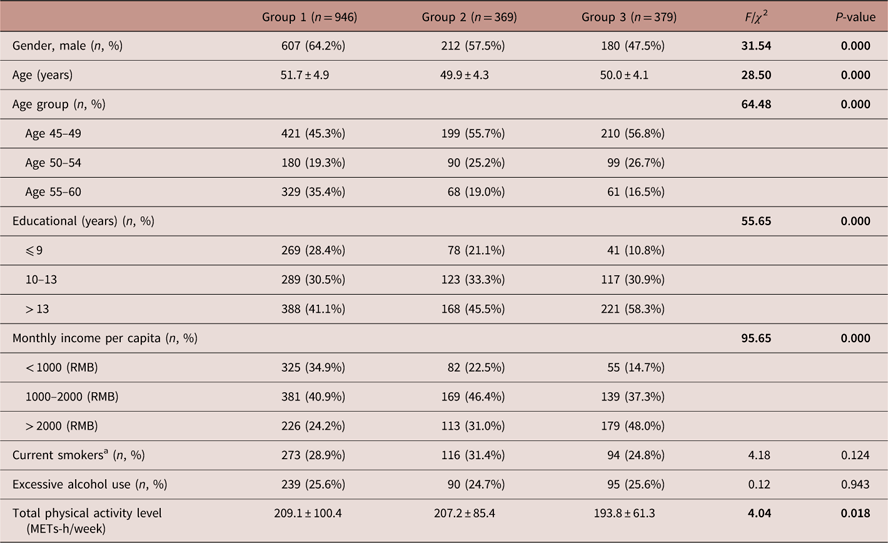
In our study, there were 1694 middle-aged subjects, among which Group 1 (the undernutrition group), Group 2 (the nutritional improvement group) and Group 3 (the good nutrition group) accounted for 55.8, 21.8 and 22.4%, respectively. The average age was 50.97±4.69. The subjects in Group 1 were older than Group 2 and Group 3 (P<0.001). The subjects in Group 3 had a higher education level and a higher household income per capita than the other two groups (P<0.001). Compared with the Group 1, the subjects in Group 2 and Group 3 had lower total physical activity level (P=0.018). No significant differences were found in smoking and alcohol use among three groups (P>0.1) (data are shown in Table 1).
General characteristic of the participants compared among three groups

a All individuals who smoked in the last 30 days qualified as current smokers.
Values in bold indicate significant P values.
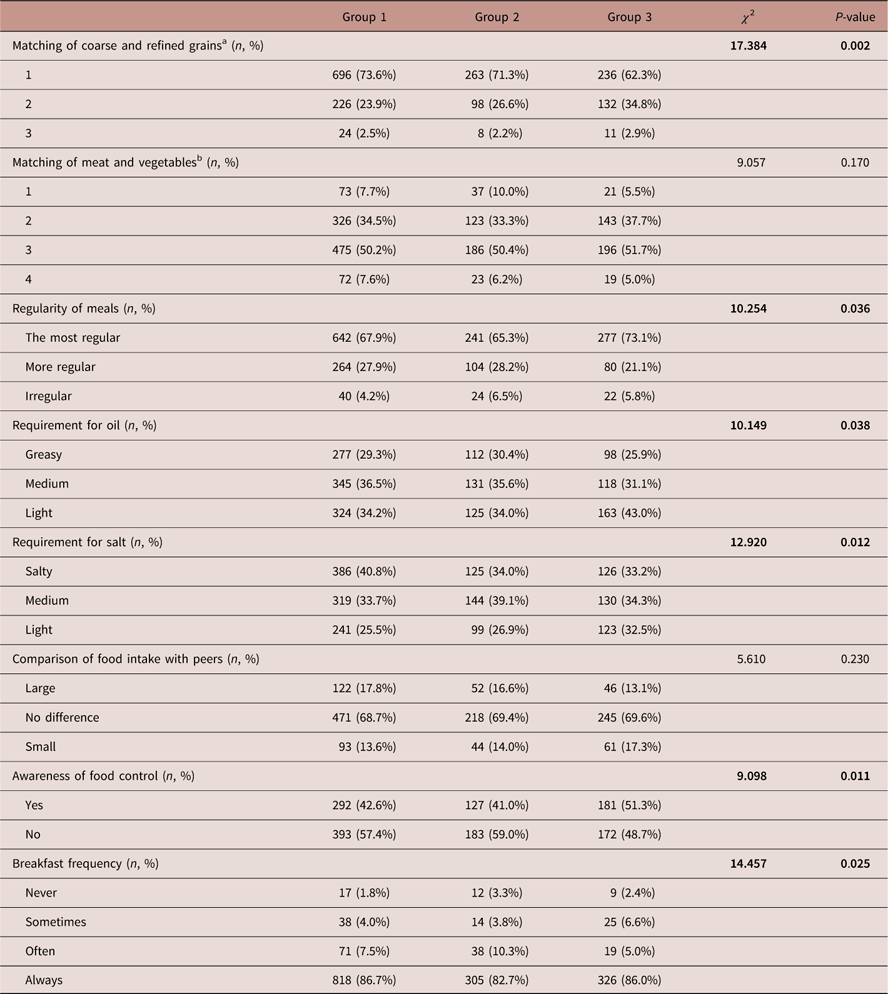
Table 2 indicated the difference of dietary behaviors and food intake of the subjects among three groups in their middle age. Compared with Group 1 and Group 2, the subjects in Group 3 had a more healthy grain matching (P<0.001), with a more reasonable and regular meal habits (P=0.036), and they had a lighter taste for oil and salt (P<0.05), meanwhile they were more conscious to control their food intake (P=0.011).
Dietary behaviors of subjects compared among three groups in the middle age

a 1 – refined grains based; 2 – coarse grains and refined grain half; 3 – coarse grains based.
b 1 – meat-based; 2 – meat and vegetables half; 3 – vegetables-based and some meat; 4 – vegetables-based and less meat.
Values in bold indicate significant P values.
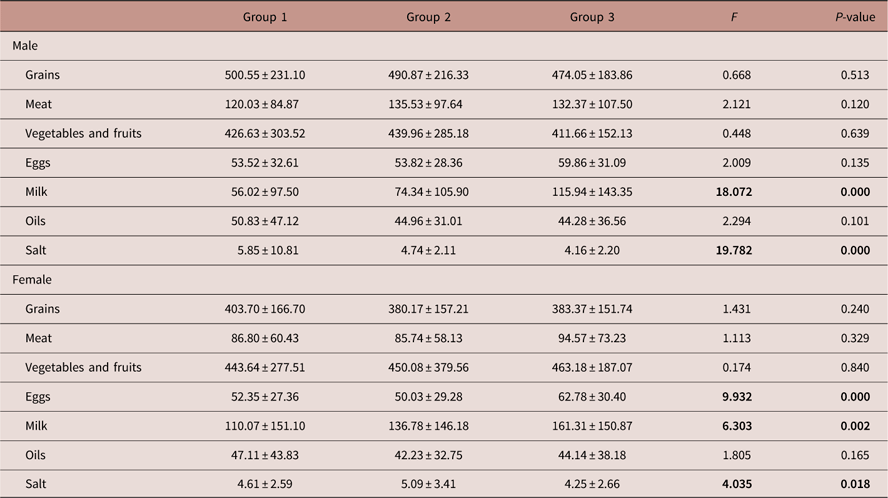
Male subjects in Group 3 had more milk and less salt intake than Group 1 and Group 2. In terms of grains, meat, eggs, oils, vegetables and fruits, there was no significant difference among the three groups. Female subjects in Group 3 had more eggs and milk and less salt intake. In terms of grains, meat, oils, vegetables and fruits, there was no significant difference among the three groups (data are shown in Table 3).
Food intakes of subjects compared among three groups in the middle age

Adjusted for monthly income per capita.
Values in bold indicate significant P values.
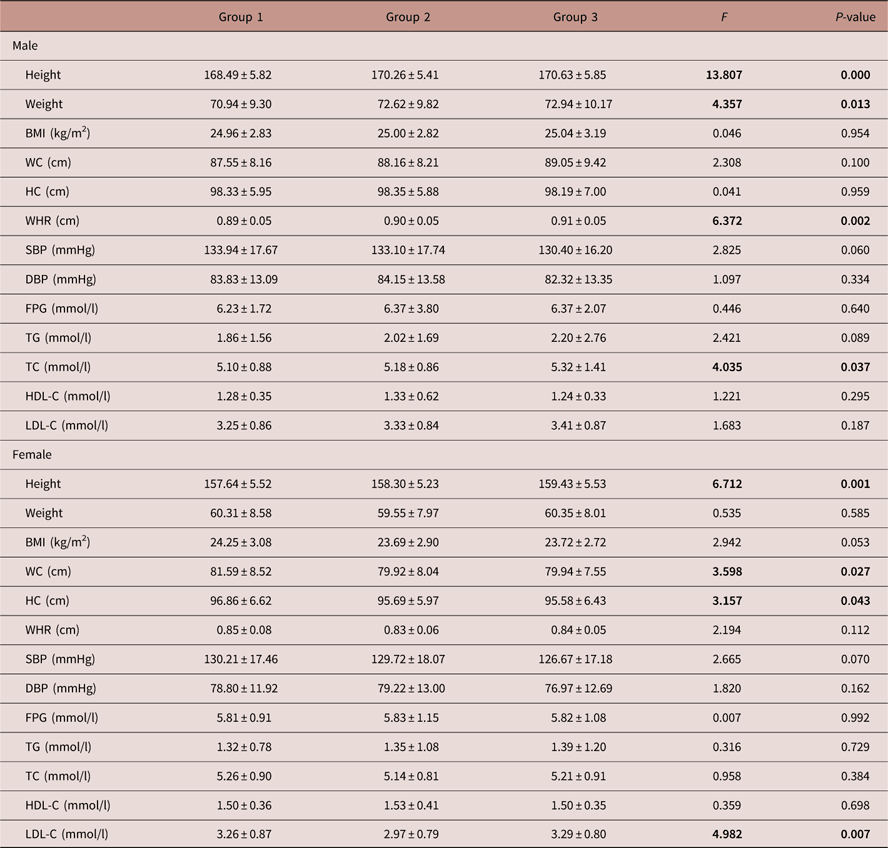
Among the male participants, the subjects in Group 3 had significantly higher height (P<0.001), weight (P=0.013), waist-to-hip ratio (P=0.002) and total cholesterol (P=0.037) than those in Group 1 and Group 2 in their middle age, and there was no significant difference in other indexes. Among the female participants, the subjects in Group 3 had significantly higher height (P=0.001) and higher level of LDL-C (P=0.007) than those in Group 1 and Group 2, and the subjects in Group 1 had higher WC than those in Group 2 and Group 3, and no significant difference was found in other indexes (data are shown in Table 4).
Related metabolic indexes of subjects compared among three groups in the middle age

BMI, body mass index; WC, waist circumference; HC, hip circumference; WHR, waist-to-hip ratio; SBP, systolic blood pressure; DBP, diastolic blood pressure; FPG, fasting plasma glucose; TG, triglyceride; TC, total cholesterol; HDL-C, high-density lipoprotein cholesterol; LDL, low-density lipoprotein cholesterol.
Values in bold indicate significant P values.
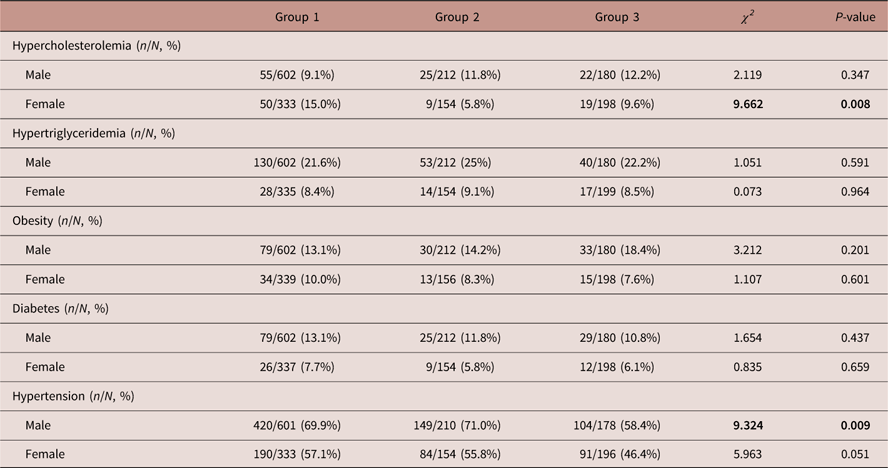
In the male population, the subjects in Group 1 (69.9%) and Group 2 (71.0%) had higher prevalence of hypertension than those in Group 3 (58.4%), and the difference was statistically significant (P=0.009). The female subjects in Group 1 (15.0%) had a higher prevalence of hypertriglyceridemia than those in Group 2 (5.8%) and Group 3 (9.6%) (P=0.008). For diabetes, obesity and hypercholesterolemia, our study found no differences between the three groups both in men and women (data are shown in Table 5).
The prevalence of cardiovascular risk factors compared among three groups in the middle age

Values in bold indicate significant P values.
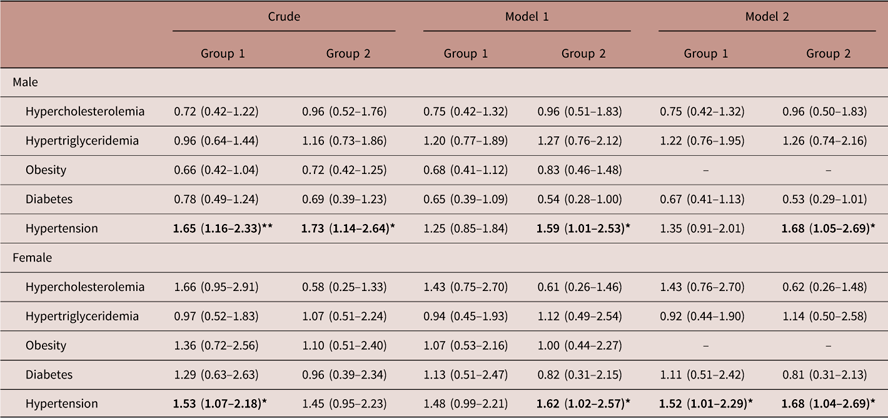
After adjusting for age, education, smoking status and other confounding factors, male participants who experienced nutritional improvement before age 18 had higher risk of hypertension [odds ratio (OR)=1.68; 95% confidence intervals (CI): 1.05, 2.69] than those with good nutrition, and female participants with undernutrition (OR=1.52; 95% CI: 1.01, 2.29) and nutritional improvement (OR=1.68; 95% CI: 1.04, 2.69) before age 18 had a higher risk of hypertension than those with good nutrition. For diabetes, obesity, hypercholesterolemia and hypertriglyceridemia, our results did not found difference between the three groups both in male and female (data are shown in Table 6).
Multivariable-adjusted odds ratios (95% confidence interval) for cardiovascular risk factors in subjects

Group 3 was identified as reference.
Model 1: adjusted for age, education, smoking status, alcohol drinking, salt intake.
Model 2: model 1+obesity.
*P<0.05; **P<0.01.
Values in bold indicate significant P values.
Discussion
To our knowledge, this study demonstrated for the first time, by using self-reported data, that undernutrition during childhood was associated with later dietary behaviors and cardiovascular risk factors in a middle-aged Chinese population. Our findings showed nutritional deficiency in childhood was related with bad dietary behaviors and an increased risk of hypertension, even after adjusting for known confounding factors. For diabetes, obesity, hypercholesterolemia or hypertriglyceridemia, our results did not found difference between the three groups both in male and female. Before further discussion, some aspects of our study require consideration. First, previous analysis has indicated that the accuracy of memory of food consumed does not necessarily decline over time, especially for foods rarely eaten and those eaten every day may be reported accurately.Reference Dwyer and Coleman 18 Second, due to Chinese low economic level and the shortage of food supply from 1940s to 1980s, the consumption of animal foods could basically reflect people’s overall nutritional status and living conditions. According to the frequency of weekly intake of animal foods during their growing period, we divided the subjects into three groups (undernutrition group, nutritional improvement group and good nutrition group).
We found undernutrition in childhood was associated with bad dietary behaviors in the middle age. Evidence from Hunger Episodes in Post-War Germany showed that an adverse life event during childhood affected people’s behaviors at older ages and thus presumably over the whole life-cycle. In particular, ages 4–10 seem to be a sensitive period during childhood.Reference Kesternich, Siflinger, Smith and Winter 19 Ainuki T et al.Reference Ainuki, Akamatsu, Hayashi and Takemi 20 reported that enjoyable eating experiences at home during childhood appeared to promote healthy eating habits and the development of a positive diet-related quality of life in the future. These studies had confirmed that the dietary experiences in childhood would affect the eating behaviors after adulthood. Our results suggested that people experiencing undernutrition in childhood had an unreasonable dietary composition and irregular eating habits. Compared with their peers, they lacked control of food intake and had more demand for oil and salt. It was reported that individuals suffering from lack of food intake in childhood as a long-term stress, showed progressively greater output of cortisol, which would increase their appetite.Reference Miller, Chen and Parker 21 The other explanation for the significant differences in dietary behaviors for malnourished people was that these subjects precaution against the risk of new hunger episodes.Reference Kesternich, Siflinger, Smith and Winter 19 Because of the previous hunger experience, they might consciously ingest more food, especially the insufficient food before the improvement of living conditions. With the passage of time, these performances gradually developed into their own unique dietary behaviors, and eventually keep them. In addition to exploring the relationship between undernutrition and dietary behaviors, we also focused the effects of undernutrition in childhood on cardiovascular risk factors. Our findings indicated that undernutrition in childhood was significantly associated with an increased risk of later hypertension, after adjusting for related confounding factors, which suggested that undernutrition during childhood had a permanent effect on later health. Many studies have shown that intrauterine or infant growth restriction is a major risk factor for some chronic diseases in later life.Reference Beyerlein, Thiering and Pflueger 22 , Reference Eriksson 23 Fewer studies have investigated the association between nutritional status in childhood and later cardiovascular risk factors. In this study, the subjects in undernutrition group and nutritional improvement group had undergone nutritional deficiencies for at least 10 years during their childhood. Due to the stimulation of the early nutritional deficiency, the body produces adaptive response, resulting in a permanent change in the number or proportion of tissue cells.Reference Sattar, McConnachie and O’Reilly 24 Early undernutrition could cause adverse changes in the structure and function of the major organs, including the brain, liver, adipose tissue, muscle and pancreas.Reference Eriksson 23 Growth restriction was the most consistent clinical surrogate for a low nephron number and was associated with increased risk of hypertension in later life.Reference Luyckx, Bertram and Brenner 25 Meanwhile, adiponectin that was related with nutritional status may regulate blood pressure via brain-mediated and endothelium-mediated mechanisms.Reference Lee, Cho and Kim 26 – Reference Ambroszkiewicz, Klemarczyk and Rowicka 28
In this study, although the subjects in nutritional improvement group experienced nutritional improvement in adolescence, this increased risk of hypertension was still there and not easily reversed. It was reported that the first 2 years after birth might be the best period for body recovery, and later catch-up growth was positively associated with CVDs.Reference Huxley, Shiell and Law 29 The adaptation of the body to undernutrition in the early stages of life could be permanently programmed, and may be susceptible for metabolic disorders, leading to increased risk of later CVDs in adulthood.Reference Vaiserman 30 , Reference Stanner, Bulmer and Andres 31 Rapid weight gain in childhood or adolescence further compounded this risk.Reference Wang, Li, Yang, Zou and Ma 9 For diabetes, obesity, hypercholesterolemia or hypertriglyceridemia, our results did not found difference between the three groups both in male and female, and the results needed further studies to be ascertained.
In this study, we showed that undernutrition during childhood affected not only adult health outcomes but also individuals’ dietary behaviors at older ages. While the numerous reports are focused on the impact of body damage on the late health, our findings will undoubtedly add a new way of thinking. We think individual behavior as a complementary pathway between childhood undernutrition and adult health outcomes. Obviously, subjects who experienced nutritional deficiency in childhood in our study had a more salt/oil intake and a less milk/egg intake, which might increase the risk of later hypertension. Numerous studies had demonstrated that taking actions to reduce salt intake in the whole population would have major beneficial effects on health along with major cost savings.Reference He and MacGregor 32 , Reference Hoyer 33 Compared with other disease risk factors, bad dietary behaviors have cumulative effects on the development of some diseases. Therefore, good nutrition is important in childhood, because growth and maturation are taking place and future dietary behaviors are being established.
Our study had some strength. It was the first study to investigate the effects of undernutrition during the whole growth period on dietary behaviors and cardiovascular risk factors in a middle-aged Chinese population. Reliability of data was guaranteed by a face-to-face interview and potential confounders were adjusted. This study involved as many covariates as possible ranging from socio-demographic factors to physical activity and diet. Nevertheless, some limits also needed to be considered. First, the present study was a cross-sectional investigation, and causality was difficult to be identified in a cross-sectional study. Thus, our results still needed be confirmed in a prospective cohort study. Second, the Group 1 and 2 indicates that both groups may have mothers who were undernutrition, and their intrauterine lives were hard to begin with, however, we did not investigate the participants’ nutritional status in fetal period and infancy, which might confound the influence of undernutrition in childhood on later health.
Conclusion
Our findings indicated that nutritional deficiency in childhood could be associated with bad dietary behaviors and a significantly increased risk of hypertension. In childhood, growth and maturation are taking place and future dietary behaviors are being established. Therefore, early adequate nutrition is very important for the prevention of non-communicable diseases later. However, for diabetes, obesity, hypercholesterolemia or hypertriglyceridemia, our results did not found difference between the three groups both in male and female, this could require us to invest more work in exploring their associations.
Financial Support
This work was supported by the National Natural Science Foundation of China (81102125).
Conflicts of Interest
None.
Ethical Standards
This study was conducted according to the guidelines laid down in the Declaration of Helsinki and all procedures involving human subjects were approved by the Ethics Committee of Anhui Medical University. Written informed consent was obtained from all subjects.
Acknowledgments
The authors thank all participants and teaching staff from School of Public Health, Anhui Medical University for their assistance and support. The authors also sincerely acknowledge the Medical Center for Physical Examination, Anhui Province Hospital of Armed Police Forces for their important contributions during data collection period.