1 Introduction
The control of transitional or fully developed turbulent boundary layers is intended to reduce the energy carried by streamwise oriented structures that appear in the form of high- and low-velocity streaks and develop in the near-wall region, known to be the starting points of the bursting sequences. Boundary layer streaks over flat plates or wings develop when the height of the upstream roughness elements exceeds a certain critical value or the amplitude of the free-stream disturbances is greater than a given threshold. Elongated streaks in the form of streamwise (Görtler) vortices also appear inside a boundary layer flow along a concave surface due to imbalance between radial pressure gradients posed by the wall and centrifugal forces. From a practical standpoint, Görtler vortices are important in a number of engineering applications, such as the flow around wings or turbomachinery blades, and the flow in the proximity to the walls of wind tunnels or turbofan engine intakes. The transition from laminar to turbulent boundary layers due to Görtler instabilities on the walls of supersonic and hypersonic wind tunnels has been recognized recently as a significant source of noise, which interferes drastically with the measurements in the test section (Schneider Reference Schneider2001), inevitably making the comparison between wind tunnel measurements and real flight conditions a challenging problem. Owing to their technological significance, it is desirable to reduce the energy associated with Görtler vortices, in an attempt to delay early nonlinear breakdown and the transition to turbulence. Since it is the transient part of the disturbance that dominates the growth of streaks or other three-dimensional disturbances that lead to breakdown, any effective method of control of these streaks must focus on restricting the development of the transient modes. Without claiming to be exhaustive, the next subsections will review some of the most important and relevant studies in boundary layer control via wall effects.
1.1 Control based on wall transpiration
The control of boundary layers based on wall transpiration can be applied via localized suction regions below low-velocity streaks and blowing regions below high-velocity streaks. The net result is a decrease in the spanwise variation of the streamwise velocity and, therefore, a commensurate reduction in the number and strength of the bursting events.
An alternative approach is active wall control, which has been used in the context of turbulent channel flow (see Choi, Moin & Kim Reference Choi, Moin and Kim1994) as a means to reduce skin-friction drag. Choi et al. (Reference Choi, Moin and Kim1994) carried out direct numerical simulations with active wall control based on wall transpiration, by placing sensors in a sectional plane parallel to the wall; a frictional drag reduction of approximately 25 % was achieved. From a practical point of view, it is difficult (or even impossible) to place sensors in the flow primarily because they may interfere with the disturbances themselves. Therefore, in the same study, Choi et al. (Reference Choi, Moin and Kim1994) investigated the same control algorithm but with sensors placed at the wall with information based on the leading term in the Taylor series expansion of the vertical component of velocity near the wall; this approach provided a reduction of only 6 % however. A similar feedback control algorithm was employed by Koumoutsakos (Reference Koumoutsakos1997, Reference Koumoutsakos1999), in which the control is informed again by flow quantities at the wall. A more significant skin-friction reduction (approximately 40 %) was obtained by using the vorticity flux components as inputs to the control algorithm.
Lee, Kim & Choi (Reference Lee, Kim and Choi1998) derived new suboptimal feedback control laws based on blowing and suction to manipulate the flow structures in the proximity to the wall, using surface pressure or shear stress distribution (the reduction in the frictional drag was in the range of 16–20 %). Observing that the opposition control technique is more effective in low Reynolds number turbulent wall flows, Pamies et al. (Reference Pamies, Garnier, Merlen and Sagaut2007) proposed the utilization of the blowing only at high Reynolds numbers, and by doing so they obtained significant reduction in the skin-friction drag for these flows. Recently, Stroh et al. (Reference Stroh, Frohnapfel, Schlatter and Hasegawa2015) conducted a comparison between the opposition control applied in the framework of turbulent channel flow and a spatially developing turbulent boundary layer. They found that the rates of frictional drag reduction are approximately similar in both cases. An overview of the issues and limitations associated with the opposition control type is given in the review article of Kim (Reference Kim2003).
Högberg, Bewley & Henningson (Reference Högberg, Bewley and Henningson2003) reported the first successful relaminarization of a
 $Re_{\unicode[STIX]{x1D70F}}=100$
turbulent channel flow by applying zero mass flux blowing and suction at the wall in the framework of linear full state optimal control theory. They showed that the information available in the linearized equations may be sufficient to construct linear controllers able to relaminarize a wall turbulent flow, but this may be limited to low Reynolds number flows.
A number of experiments aiming to control disturbances in laminar or turbulent boundary layers by blowing and suction have been conducted over the years. Several of them are briefly mentioned here. Gad-el-Hak & Blackwelder (Reference Gad-el-Hak and Blackwelder1989) used continuous or intermittent suction to eliminate artificially generated disturbances in a flat-plate boundary layer. The same idea was used in the experiments conducted by Myose & Blackwelder (Reference Myose and Blackwelder1995) to delay the breakdown of Görtler vortices. Jacobson & Reynolds (Reference Jacobson and Reynolds1998) developed a new type of actuation based on a vortex generator to control disturbances generated by a cylinder with the axis normal to the wall, and unsteady boundary layer streaks generated by pulsed suction. Regarding the latter, the actuation was able to significantly reduce the spanwise gradients of the streamwise velocity, which are known to be an important driving force of secondary instabilities (see Swearingen & Blackwelder Reference Swearingen and Blackwelder1987). In the experiments of Lundell & Alfredsson (Reference Lundell and Alfredsson2003), streamwise velocity streaks in a channel flow were controlled by localized regions of suction in the downstream, which are found to be effective in delaying secondary instabilities and consequently the transition onset.
1.2 Control based on wall deformation and motion
Boundary layer control based on active wall deformations aimed at counteracting streaks in wall turbulence has been successfully applied to reduce the frictional drag, although the reduction was not as high as in the case of opposition control. For this reason, there are not as many studies as there are in the case of blowing and suction. Nevertheless, this type of control has been applied mostly in the framework of turbulent channel flows or turbulent boundary layers, and less in the framework of pre-transitional or transitional boundary layers.
In one of the earliest studies, performed by Carlson & Lumley (Reference Carlson and Lumley1996), the effect of wall deformation on turbulent structures at the wall was considered; an actuator was used to control one pair of coherent structures near the wall. It was observed that raising the actuator underneath a low-speed streak increases skin-friction drag by allowing the adjacent high-speed region to expand, and vice versa. Another example is the work of Endo, Kasagi & Suzuki (Reference Endo, Kasagi and Suzuki2000), reporting direct numerical simulation studies of feedback control of deformable walls to reduce the skin friction in a turbulent channel flow. The control scheme was based on physical arguments relating to the near-wall coherent structures and a 10 % friction drag reduction was obtained. Endo et al. (Reference Endo, Kasagi and Suzuki2000) also pointed out that the energy input required to deform the wall is much smaller than the pumping power required for suction/blowing. Kang & Choi (Reference Kang and Choi2000) investigated the potential of reducing the skin-friction drag in a turbulent channel flow via active wall motions. They noticed that the instantaneous wall surface shape also took the form of elongated streaks as in laminar boundary layers. A reduction of the friction drag of the order of 13–17 % was realized by their approach. Mani, Lagoudas & Rediniotis (Reference Mani, Lagoudas and Rediniotis2008) utilized a deformable skin actuated by active materials for turbulent boundary layer control, claiming a large reduction in skin-friction drag. It was based on a generalized actuation principle that is capable of generating a travelling sine wave on the surface of an active skin.
From the experimental standpoint, Breuer, Haritonidis & Landahl (Reference Breuer, Haritonidis and Landahl1989) showed that the energy of nonlinear, non-wave-like disturbances in a boundary layer can be delayed by using a travelling bump at the wall. Segawa et al. (Reference Segawa, Kawaguchi, Kikushima and Yoshida2002) devised an actuator array to generate wall-normal oscillations, and were able to decrease the regularity of streaky structures (drag reduction was not reported). Itoh et al. (Reference Itoh, Tamano, Yokota and Taniguchi2006) excited a flexible polythene sheet to generate a transverse travelling wave, which interacted with boundary layer streaks, and achieved 7.5 % drag reduction. Another experimental example is the dissertation research of Koberg (Reference Koberg2007), where an approach for reducing skin friction in a turbulent boundary layer via active wall deformation was investigated. He attempted to match the velocity sensed away from the wall by imposing a velocity of opposite direction at the wall; the control provided a skin-friction reduction of 15 %. Patzold et al. (Reference Patzold, Peltzer, Nitche, Goldin, King, Haller and Woias2013), more recently, developed experimentally an actively driven compliant wall to delay the transition in a boundary layer initiated by Tollmien–Schlichting waves. They used various configurations of piezo-actuators combined with an array of sensitive surface sensors, and were able to shift the transition onset forward by 100 mm.
Another relevant control mechanism is the one based on wall oscillations along the streamwise or spanwise direction. A good portion of the body of research performed in this area is reviewed in Karniadakis & Choi (Reference Karniadakis and Choi2003), and in Quadrio (Reference Quadrio2011). As an example, Galionis & Hall (Reference Galionis and Hall2005) studied the growth of Görtler vortices above a spanwise oscillating surface that is concave in the streamwise direction, and found a significant reduction in the growth rate associated with secondary instabilities. Another example is the work of Hack & Zaki (Reference Hack and Zaki2014), where direct numerical simulations were carried out to study the effect of a spanwise oscillating flat plate on the bypass breakdown to turbulence; they found that the transition onset can be delayed and the transition region can be significantly extended. Spanwise wall oscillations have also been shown to attenuate effectively the turbulence intensity in wall-bounded flows, thereby producing a sustained reduction of turbulent wall friction. Experimental (Laadhari, Skandaji & Morel Reference Laadhari, Skandaji and Morel2014), numerical (Quadrio & Ricco Reference Quadrio and Ricco2003) and modelling (Dhanak & Si Reference Dhanak and Si1999) research studies have appeared since the pioneering study of Jung, Mangiavachchi & Akhavan (Reference Jung, Mangiavachchi and Akhavan1992). As an example of early studies, Choi, De Bisschop & Clayton (Reference Choi, De Bisschop and Clayton1998) performed an experimental investigation of the effect of spanwise wall oscillation on the skin-friction drag to confirm previous results from numerical simulations. They obtained an as high as 45 % drag reduction as a result of some optimizations, and attributed this to the mean velocity gradient reduction due to the spanwise vorticity generated by the Stokes layer. Other studies in this area include Quadrio & Ricco (Reference Quadrio and Ricco2004), Quadrio, Ricco & Viotti (Reference Quadrio, Ricco and Viotti2009), Ricco (Reference Ricco2011), Skote (Reference Skote2011), Moarref & Jovanovic (Reference Moarref and Jovanovic2012), Touber & Leschziner (Reference Touber and Leschziner2012), Agostini, Touber & Leschziner (Reference Agostini, Touber and Leschziner2014), Yakeno, Hasegawa & Kasagi (Reference Yakeno, Hasegawa and Kasagi2014) or Hicks & Ricco (Reference Hicks and Ricco2015).
Passive wall deformations in the form of riblets (e.g. Walsh Reference Walsh1983; Choi, Moin & Kim Reference Choi, Moin and Kim1993; Bechert et al. Reference Bechert, Bruse, Hage, Van Der Hoeven and Hoppe1997; Lee & Lee Reference Lee and Lee2001; Garcia-Mayoral & Jimenez Reference Garcia-Mayoral and Jimenez2011; Duan & Choudhari Reference Duan and Choudhari2012; Sasamori et al. Reference Sasamori, Mamori, Iwamoto and Murata2014; or Hou, Hokmabad & Ghaemi Reference Hou, Hokmabad and Ghaemi2017), compliant surfaces (e.g. Lee, Fisher & Schwarz Reference Lee, Fisher and Schwarz1993; Larose & Grotberg Reference Larose and Grotberg1996; Davies & Carpenter Reference Davies and Carpenter1997; Carpenter Reference Carpenter1998; Reutov & Rybushkina Reference Reutov and Rybushkina1998; Gad-el Hak Reference Gad-el Hak2002), dimples (e.g. Ligrani et al. Reference Ligrani, Harrison, Mahmood and Hill2001; Wang, Yeo & Khoo Reference Wang, Yeo and Khoo2006; Lienhart, Breuer & Koksoy Reference Lienhart, Breuer and Koksoy2008; or Tay, Khoo & Chew Reference Tay, Khoo and Chew2015), surface waviness (e.g. Du & Karniadakis Reference Du and Karniadakis2000; Karniadakis & Choi Reference Karniadakis and Choi2003; Zverkov, Zanin & Kozlov Reference Zverkov, Zanin and Kozlov2008; Hoepffner & Fukagata Reference Hoepffner and Fukagata2009; Tomiyama & Fukagata Reference Tomiyama and Fukagata2013; or Meysonnat et al. Reference Meysonnat, Roggenkamp, Li, Roidl and Schroder2016) or two-dimensional roughness elements (e.g. Holloway & Sterrett Reference Holloway and Sterrett1964; Fong, Wang & Zhong Reference Fong, Wang and Zhong2014; Duan, Wang & Zhong Reference Duan, Wang and Zhong2013; or Park & Park Reference Park and Park2016) have been applied in a number of studies to delay transition in boundary layers or to reduce the skin-friction drag in wall turbulence (these lists of references are far from being comprehensive).
1.3 Optimal control approach
Optimal control in the framework of laminar or turbulent boundary layers has been utilized in a number of studies. There are numerous studies pertaining the application of optimal control of shear flows (see the review of Gunzburger (Reference Gunzburger2000) or a more recent review of Luchini & Bottaro (Reference Luchini and Bottaro2014), although the latter is in a slightly different context). The following studies have targeted the control of disturbances evolving in laminar or turbulent boundary layers (e.g. Bewley & Moin Reference Bewley and Moin1994; Joslin et al. Reference Joslin, Gunzburger, Nicolaides, Erlebacher and Hussaini1997; Cathalifaud & Luchini Reference Cathalifaud and Luchini2000; Corbett & Bottaro Reference Corbett and Bottaro2001; Högberg et al. Reference Högberg, Bewley and Henningson2003; Zuccher, Luchini & Bottaro Reference Zuccher, Luchini and Bottaro2004; Cherubini, Robinet & De Palma Reference Cherubini, Robinet and De Palma2013; Lu et al. Reference Lu, Agostini, Ricco and Papadakis2014).
A relevant work in the present context is that of Joslin et al. (Reference Joslin, Gunzburger, Nicolaides, Erlebacher and Hussaini1997), where a mathematical framework for optimal control of disturbances in three-dimensional boundary layers based on Lagrange multipliers was introduced; the analysis included in this work is largely based on their derivation. Optimal control of turbulent channel flows by blowing and suction was employed previously by Bewley & Moin (Reference Bewley and Moin1994), who claimed a 17 % frictional drag reduction as a result of this scheme. Blowing and suction-based optimal control was also applied by Cathalifaud & Luchini (Reference Cathalifaud and Luchini2000) to reduce the energy of disturbances in a flat-plate and a concave boundary layer. In the study of Zuccher et al. (Reference Zuccher, Luchini and Bottaro2004), an optimal and robust control strategy was discussed and tested in the framework of steady three-dimensional disturbances (in the form of streaks) that form in a flat-plate boundary layer. It was based on an adjoint-based optimization technique to first find the optimal state for given initial conditions, and then to determine what the worst initial conditions for the optimal control are. Lu et al. (Reference Lu, Agostini, Ricco and Papadakis2014) derived an optimal control scheme within the linearized unsteady boundary region equations which are the asymptotic reduction of the Navier–Stokes equations under the assumption of low frequency and low streamwise wavelength. Their study aimed at controlling both streaks developing in flat-plate boundary layers and Görtler vortices evolving along concave surfaces. Cherubini et al. (Reference Cherubini, Robinet and De Palma2013) applied a nonlinear optimal control strategy with blowing and suction, starting with the full Navier–Stokes equations, and using the method of Lagrange multipliers to determine the largest decrease of the disturbance energy.
A closed-loop optimal control technique based on wall transpiration was derived and tested by Papadakis, Lu & Ricco (Reference Papadakis, Lu and Ricco2016), in the framework of a flat-plate laminar boundary layer excited by free-stream disturbances. The optimal control was split into two sequences that can be obtained by marching the corresponding equations in forward and backward directions, and it was found that the feedback sequence is more important than the feed-forward sequence. The study of Xiao & Papadakis (Reference Xiao and Papadakis2017) employs an optimal control algorithm based on Lagrange multipliers, aimed at delaying transition in a flat-plate boundary layer excited by free-stream vortical disturbances, is based on blowing and suction, and is derived in the framework of the full Navier–Stokes equations.
1.4 Objectives of this work
Our aim in this study is to develop an optimal control algorithm that is capable of reducing the streamwise development of Görtler vortices initiated by a row of roughness elements near the leading edge. We show that flow control based on wall deformation or transpiration can significantly reduce the energy of pre-transitional Görtler instabilities, which can ultimately delay transition and consequently reduce the skin-friction drag. It is shown that the control can be implemented, self-consistently, using the high Reynolds number asymptotic framework for a laminar boundary layer developing along a concave wall, in which the flow is governed by the so-called boundary region equations (BRE) in the nonlinear regime. Since these equations are parabolic in the streamwise direction, a marching procedure can be utilized to determine the solution based on a given initial/upstream condition. Local changes in the surface geometry are introduced into these equations through a Prandtl transformation (Yao Reference Yao1988) of both dependent and independent variables that does not alter the parabolic character of the boundary value problem and therefore allows the solution to be determined by the same numerical marching technique. The variations in local surface shape then allow for a relatively straightforward control strategy to be implemented to the transformed set of equations in order to determine the optimum wall deformation or transpiration that reduces the energy of the vortices.
The vortices are initiated by perturbing the upstream flow with a periodic array of roughness elements placed near the leading edge using a previously derived asymptotic solution (Goldstein et al. Reference Goldstein, Sescu, Duck and Choudhari2010, Reference Goldstein, Sescu, Duck and Choudhari2011) in which the appropriate upstream boundary condition was derived. The vortex energy is controlled via an optimal control algorithm based on Lagrange multipliers, where the wall displacement or the wall transpiration velocity serve as control variables. The cost functional is defined in terms of the wall shear stress. In our analysis, local wall deformations appear to resemble elongated surface shapes that we optimize to control the Görtler vortex energy. These surface deformations inject/extract momentum into/from the flow in the vertical direction, according to inputs provided by the wall shear stress (the same mechanism is at play when wall transpiration is considered). A similar approach, based on wall deformations, was undertaken in Sescu, Taoudi & Afsar (Reference Sescu, Taoudi and Afsar2017), where a proportional controller was applied to reduce the energy of Görtler vortices. Here, we formulate the problem using the method of Lagrange multipliers, and derive the adjoint BRE equations for control based on both wall deformation and transpiration, and show that significantly more reduction in the Görtler vortex energy or wall shear stress can be achieved. It is also shown that the control based on wall deformations is more effective in reducing the streak energy than the control scheme based on wall transpiration, and a potential mechanism behind this difference is discussed.
In § 2, the Görtler problem is introduced and discussed in the framework of nonlinear boundary region equations, including the basic scalings, associated initial and boundary conditions and the Prandtl transform utilized to account for wall deformations. Section 3 introduces the general framework of optimal control, its application to our specific problem and the derivation of the adjoint equations and optimality conditions (derivation details are given in appendices A–C). In § 4, various results are presented and discussed for different flow or geometrical conditions, and in § 5 the physical mechanisms behind both control strategies are discussed. The last § 6 is reserved for summary and final concluding remarks.
2 Görtler vortices – basic scalings and governing equations
We consider an incompressible boundary layer flow over a concave surface, with upstream perturbations provided by a spanwise periodic array of roughness elements at some downstream streamwise location,
 $x^{\ast }=x_{0}^{\ast }$
(hereafter all dimensional quantities have a star). The boundary layer flow configuration is the same as that considered in Sescu & Thompson (Reference Sescu and Thompson2015) or Sescu et al. (Reference Sescu, Taoudi and Afsar2017) (see figure 1 in Sescu & Thompson Reference Sescu and Thompson2015). The effect of the roughness elements is not directly modelled here, but taken into account as initial condition from an asymptotic solution derived previously in Goldstein et al. (Reference Goldstein, Sescu, Duck and Choudhari2010). The spanwise length scale of the roughness row,
 $\unicode[STIX]{x1D6EC}^{\ast }$
, is of the same order of magnitude as the local boundary layer thickness
 $\unicode[STIX]{x1D6FF}^{\ast }\equiv x_{0}^{\ast }/\sqrt{R}=x_{0}^{\ast }\unicode[STIX]{x1D6FF}$
at the roughness location
 $x_{0}^{\ast }$
, where
 $R=x_{0}^{\ast }U_{\infty }^{\ast }/\unicode[STIX]{x1D708}^{\ast }$
is the Reynolds number based on
 $x_{0}^{\ast }$
and
 $U_{\infty }^{\ast }$
is the free-stream velocity, with
 $\unicode[STIX]{x1D708}^{\ast }$
being the kinematic viscosity, and
 $\unicode[STIX]{x1D6FF}\equiv R^{-1/2}$
being the boundary layer thickness scaled by the (fixed)
 $O(1)$
length scale,
 $\unicode[STIX]{x1D6EC}^{\ast }$
. The spatial coordinates are normalized by the spanwise length scale,
 $\unicode[STIX]{x1D6EC}^{\ast }$
, as
 $(x,y,z)=(x^{\ast },y^{\ast },z^{\ast })/\unicode[STIX]{x1D6EC}^{\ast }$
, and the velocity and pressure are normalized as
 $$\begin{eqnarray}\displaystyle \tilde{u} =\frac{u^{\ast }}{U_{\infty }^{\ast }},\quad \tilde{v}=R_{\unicode[STIX]{x1D6EC}}\frac{v^{\ast }}{U_{\infty }^{\ast }},\quad \tilde{w}=R_{\unicode[STIX]{x1D6EC}}\frac{w^{\ast }}{U_{\infty }^{\ast }},\quad \tilde{p}=R_{\unicode[STIX]{x1D6EC}}^{2}\frac{p^{\ast }}{\unicode[STIX]{x1D70C}^{\ast }U_{\infty }^{\ast 2}}, & & \displaystyle\end{eqnarray}$$
where
 $(u^{\ast },v^{\ast },w^{\ast })$
is the dimensional velocity vector,
 $\unicode[STIX]{x1D70C}^{\ast }$
is the density and
 $R_{\unicode[STIX]{x1D6EC}}=U_{\infty }^{\ast }\unicode[STIX]{x1D6EC}^{\ast }/\unicode[STIX]{x1D708}^{\ast }$
is the Reynolds number based on
 $\unicode[STIX]{x1D6EC}^{\ast }$
. Görtler vortices are expected to develop when
 $x\sim 2\unicode[STIX]{x03C0}/k_{1}\sim \unicode[STIX]{x1D6EC}^{\ast }R_{\unicode[STIX]{x1D6EC}}$
(Wu, Zhao & Luo Reference Wu, Zhao and Luo2011), which is fixed at
 $O(1)$
(
 $k_{1}$
is the streamwise wavenumber); this suggests the introduction of the slow streamwise variable
 $X=x/R_{\unicode[STIX]{x1D6EC}}^{\ast }$
. For a body-fitted coordinate system, the original Navier–Stokes equations are transformed according to the Lamé coefficients,
 $h_{1}=(R_{0}-y)/R_{0},h_{2}=1$
, where the radius of curvature is much larger than the spanwise separation of the roughness elements; i.e.
 $R_{0}\gg O(1)$
. The origin of the coordinate system is located at the leading edge, with the streamwise
 $x$
-axis aligned with the wall surface,
 $y$
-axis perpendicular to the wall surface and
 $z$
-axis aligned with the spanwise direction. The velocity field
 $\{\tilde{u} ,\tilde{v},\tilde{w}\}$
and the pressure
 $\tilde{p}$
are expanded like
 $$\begin{eqnarray}\displaystyle \{\tilde{u} ,\tilde{v},\tilde{w},\tilde{p}\}=\{u(X,y,z),\unicode[STIX]{x1D700}v(X,y,z),\unicode[STIX]{x1D700}w(X,y,z),\unicode[STIX]{x1D700}^{2}p(X,y,z)\}+\cdots \,, & & \displaystyle\end{eqnarray}$$
where the small parameter
 $\unicode[STIX]{x1D700}=1/R_{\unicode[STIX]{x1D6EC}}$
.
Upon substituting the dimensionless independent and dependent variables into the Navier–Stokes equations, with retaining only the first-order terms in the asymptotic expansion (2.2), the boundary region equations (BRE) are derived in the form
 $$\begin{eqnarray}\displaystyle & \displaystyle \frac{\unicode[STIX]{x2202}u}{\unicode[STIX]{x2202}X}+\frac{\unicode[STIX]{x2202}v}{\unicode[STIX]{x2202}y}+\frac{\unicode[STIX]{x2202}w}{\unicode[STIX]{x2202}z}=0, & \displaystyle\end{eqnarray}$$
 $$\begin{eqnarray}\displaystyle & \displaystyle u\frac{\unicode[STIX]{x2202}u}{\unicode[STIX]{x2202}X}+v\frac{\unicode[STIX]{x2202}u}{\unicode[STIX]{x2202}y}+w\frac{\unicode[STIX]{x2202}u}{\unicode[STIX]{x2202}z}=\frac{\unicode[STIX]{x2202}^{2}u}{\unicode[STIX]{x2202}y^{2}}+\frac{\unicode[STIX]{x2202}^{2}u}{\unicode[STIX]{x2202}z^{2}} & \displaystyle\end{eqnarray}$$
 $$\begin{eqnarray}\displaystyle & \displaystyle u\frac{\unicode[STIX]{x2202}v}{\unicode[STIX]{x2202}X}+v\frac{\unicode[STIX]{x2202}v}{\unicode[STIX]{x2202}y}+w\frac{\unicode[STIX]{x2202}v}{\unicode[STIX]{x2202}z}+G_{\unicode[STIX]{x1D6EC}}u^{2}=-\frac{\unicode[STIX]{x2202}p}{\unicode[STIX]{x2202}y}+\frac{\unicode[STIX]{x2202}^{2}v}{\unicode[STIX]{x2202}y^{2}}+\frac{\unicode[STIX]{x2202}^{2}v}{\unicode[STIX]{x2202}z^{2}}, & \displaystyle\end{eqnarray}$$
 $$\begin{eqnarray}\displaystyle & \displaystyle u\frac{\unicode[STIX]{x2202}w}{\unicode[STIX]{x2202}X}+v\frac{\unicode[STIX]{x2202}w}{\unicode[STIX]{x2202}y}+w\frac{\unicode[STIX]{x2202}w}{\unicode[STIX]{x2202}z}=-\frac{\unicode[STIX]{x2202}p}{\unicode[STIX]{x2202}z}+\frac{\unicode[STIX]{x2202}^{2}w}{\unicode[STIX]{x2202}y^{2}}+\frac{\unicode[STIX]{x2202}^{2}w}{\unicode[STIX]{x2202}z^{2}}, & \displaystyle\end{eqnarray}$$
where the effect of the wall curvature is contained in the term involving the global Görtler number
 $G_{\unicode[STIX]{x1D6EC}}=R_{\unicode[STIX]{x1D6EC}}^{2}/R_{0}$
(Wu et al.
Reference Wu, Zhao and Luo2011). As discussed in the introduction, the absence of streamwise second-order derivatives in the BRE indicates that they are parabolic in the streamwise direction and can be solved numerically using a space-marching technique. We will discuss the appropriate boundary conditions below. Prandtl transformation (or Prandtl transposition theorem, Yao Reference Yao1988) is applied to these equations in order to incorporate local changes in wall surface geometry, or wall deformations defined through the function
 ${\mathcal{F}}(X,y)$
. This is easily done with a new wall-normal variable and velocity as follows
 $$\begin{eqnarray}\displaystyle Y=y-{\mathcal{F}},\quad \hat{v}=v-\left(u\frac{\unicode[STIX]{x2202}{\mathcal{F}}}{\unicode[STIX]{x2202}X}+w\frac{\unicode[STIX]{x2202}{\mathcal{F}}}{\unicode[STIX]{x2202}z}\right). & & \displaystyle\end{eqnarray}$$
Inserting the chain rule,
 $$\begin{eqnarray}\displaystyle \frac{\unicode[STIX]{x2202}}{\unicode[STIX]{x2202}X_{i}}=\left\{\begin{array}{@{}ll@{}}\displaystyle \frac{\unicode[STIX]{x2202}}{\unicode[STIX]{x2202}X_{i}}-\frac{\unicode[STIX]{x2202}{\mathcal{F}}}{\unicode[STIX]{x2202}X_{i}}\frac{\unicode[STIX]{x2202}}{\unicode[STIX]{x2202}Y},\quad & i=(1,3),\\ \displaystyle \frac{\unicode[STIX]{x2202}}{\unicode[STIX]{x2202}Y},\quad & i=2,\end{array}\right. & & \displaystyle\end{eqnarray}$$
where
 $\unicode[STIX]{x2202}/\unicode[STIX]{x2202}X_{i}=(\unicode[STIX]{x2202}/\unicode[STIX]{x2202}X,\unicode[STIX]{x2202}/\unicode[STIX]{x2202}y,\unicode[STIX]{x2202}/\unicode[STIX]{x2202}z)$
and
 $\unicode[STIX]{x2202}{\mathcal{F}}/\unicode[STIX]{x2202}X_{i}$
is the derivative of the surface function with
 $X_{i}=(X,z)$
when
 $i=(1,3)$
, into (2.3)–(2.6) gives the transformed BREs:
 $$\begin{eqnarray}\displaystyle & \displaystyle \frac{\unicode[STIX]{x2202}u}{\unicode[STIX]{x2202}X}+\frac{\unicode[STIX]{x2202}\hat{v}}{\unicode[STIX]{x2202}Y}+\frac{\unicode[STIX]{x2202}w}{\unicode[STIX]{x2202}z}=0, & \displaystyle\end{eqnarray}$$
 $$\begin{eqnarray}\displaystyle & \displaystyle u\frac{\unicode[STIX]{x2202}u}{\unicode[STIX]{x2202}X}+\hat{v}\frac{\unicode[STIX]{x2202}u}{\unicode[STIX]{x2202}Y}+w\frac{\unicode[STIX]{x2202}u}{\unicode[STIX]{x2202}z}=\frac{\unicode[STIX]{x2202}^{2}u}{\unicode[STIX]{x2202}Y^{2}}+{\mathcal{D}}^{2}u-\frac{\unicode[STIX]{x2202}^{2}{\mathcal{F}}}{\unicode[STIX]{x2202}z^{2}}\frac{\unicode[STIX]{x2202}u}{\unicode[STIX]{x2202}Y}, & \displaystyle\end{eqnarray}$$
 $$\begin{eqnarray}\displaystyle & \displaystyle u\frac{\unicode[STIX]{x2202}v}{\unicode[STIX]{x2202}X}+\hat{v}\frac{\unicode[STIX]{x2202}v}{\unicode[STIX]{x2202}Y}+w\frac{\unicode[STIX]{x2202}v}{\unicode[STIX]{x2202}z}+G_{\unicode[STIX]{x1D6EC}}u^{2}=-\frac{\unicode[STIX]{x2202}p}{\unicode[STIX]{x2202}Y}+\frac{\unicode[STIX]{x2202}^{2}v}{\unicode[STIX]{x2202}Y^{2}}+{\mathcal{D}}^{2}v-\frac{\unicode[STIX]{x2202}^{2}{\mathcal{F}}}{\unicode[STIX]{x2202}z^{2}}v_{Y}, & \displaystyle\end{eqnarray}$$
 $$\begin{eqnarray}\displaystyle & \displaystyle u\frac{\unicode[STIX]{x2202}w}{\unicode[STIX]{x2202}X}+\hat{v}\frac{\unicode[STIX]{x2202}w}{\unicode[STIX]{x2202}Y}+w\frac{\unicode[STIX]{x2202}w}{\unicode[STIX]{x2202}z}=-{\mathcal{D}}p+\frac{\unicode[STIX]{x2202}^{2}w}{\unicode[STIX]{x2202}Y^{2}}+{\mathcal{D}}^{2}w-\frac{\unicode[STIX]{x2202}^{2}{\mathcal{F}}}{\unicode[STIX]{x2202}z^{2}}w_{Y}, & \displaystyle\end{eqnarray}$$
where the operator
 $$\begin{eqnarray}\displaystyle {\mathcal{D}}=\left(\frac{\unicode[STIX]{x2202}}{\unicode[STIX]{x2202}z}-\frac{\unicode[STIX]{x2202}{\mathcal{F}}}{\unicode[STIX]{x2202}z}\frac{\unicode[STIX]{x2202}}{\unicode[STIX]{x2202}Y}\right) & & \displaystyle\end{eqnarray}$$
was introduced for brevity. These equations obviously retain their parabolic character and are, therefore, solved by the same marching technique discussed in Goldstein et al. (Reference Goldstein, Sescu, Duck and Choudhari2010) or Sescu & Thompson (Reference Sescu and Thompson2015). The
 $v$
variable in (2.10) is treated as an implicit function of
 $\hat{v}$
via
 $\hat{v}=v-(u\unicode[STIX]{x2202}{\mathcal{F}}/\unicode[STIX]{x2202}X+w\unicode[STIX]{x2202}{\mathcal{F}}/\unicode[STIX]{x2202}z)$
to avoid higher derivatives of
 ${\mathcal{F}}$
that might potentially be difficult to resolve if the wall deformation is a rapidly varying function of
 $X$
or
 $z$
(which is not the case in this particular analysis because the flow variables are assumed to be slowly varying functions of
 $X$
). In this particular study,
 ${\mathcal{F}}$
is a continuous and smooth function that will be obtained at discrete points
 $(X,z)$
within the control algorithm, where
 ${\mathcal{F}}=0$
corresponds to the original undeformed surface. The wall displacement and the height of the roughness elements are assumed to be of the order of magnitude of, or smaller than, the boundary layer displacement thickness; otherwise, the theory will fail to provide accurate results.
The wall boundary condition for the control based on wall deformation (as described in the next section) is the no-slip condition
 $$\begin{eqnarray}\displaystyle u(X,Y,z)=v(X,Y,z)=w(X,Y,z)=0, & & \displaystyle\end{eqnarray}$$
where the shape of the wall is embedded in the transformed wall-normal variable
 $Y$
, that now represents level surfaces where
 $y(X,z)={\mathcal{F}}(X,z)=\text{const}$
. The wall boundary condition for the control based on wall transpiration is
 $$\begin{eqnarray}\displaystyle u(X,Y,z)=w(X,Y,z)=0,\quad v(X,Y,z)=v_{w}(X,z), & & \displaystyle\end{eqnarray}$$
where
 $v_{w}(X,z)$
is the transpiration velocity.
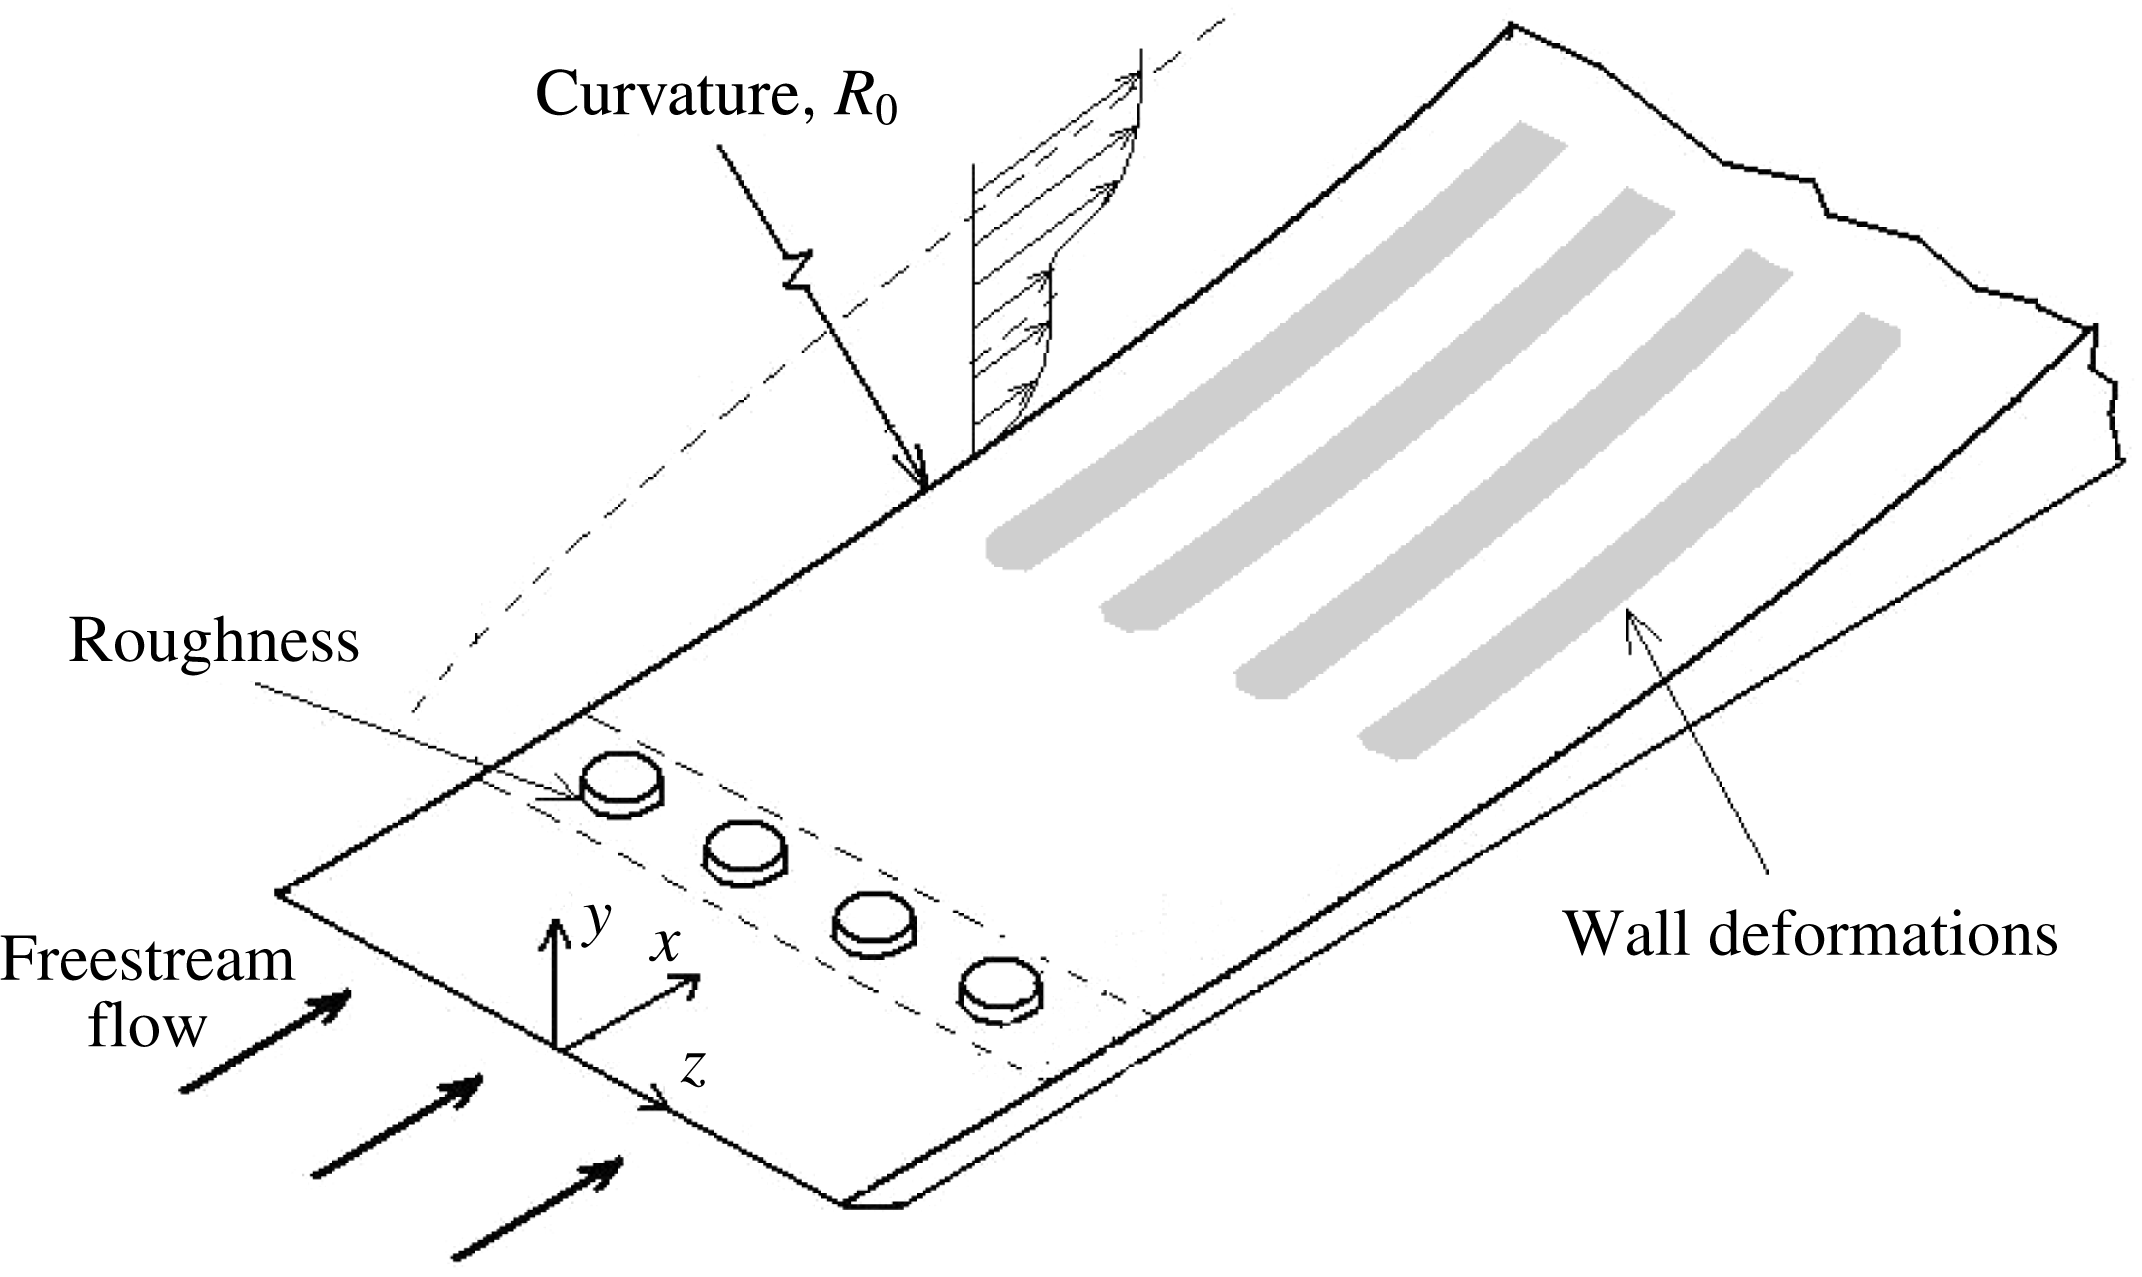
The vortices are initiated by roughness elements placed close to the leading edge in which the local surface is geometrically flat owing to the requirement that
 $R_{0}\gg O(1)$
(see figure 1). Hence the initial conditions for the transformed BREs are given by the flat-plate case solution as derived in Goldstein et al. (Reference Goldstein, Sescu, Duck and Choudhari2010) (see also the appendix of Sescu & Thompson Reference Sescu and Thompson2015). Equations (2.9)–(2.12) and the associated initial and boundary conditions are marched in the streamwise direction since they are parabolic. To avoid decoupling between the pressure and velocity, a staggered grid is employed in the wall-normal direction, and second-order accurate difference schemes are employed along both
 $y$
and
 $z$
directions. The convergence was achieved by a relaxation method, similar to the one employed in Sescu & Thompson (Reference Sescu and Thompson2015).
Flow configuration sketch.
3 Optimal control problem in the nonlinear regime
While it is common for an optimal flow control problem to be formulated in the framework of a dynamical system (usually, described by a set of equations that are parabolic in time), here we replace the time direction by the
 $X$
-direction owing to the parabolic character of the BRE in the streamwise direction, which necessitates streamwise marching to obtain a solution. To fix ideas, we first write equations (2.9)–(2.12) in the generic and more compact form
 $$\begin{eqnarray}\displaystyle {\mathcal{G}}(\boldsymbol{q},\unicode[STIX]{x1D713})=0, & & \displaystyle\end{eqnarray}$$
for brevity, with initial and boundary conditions
 $$\begin{eqnarray}\displaystyle \boldsymbol{q}(0,Y,z)=\boldsymbol{q}_{0}(Y,z) & & \displaystyle\end{eqnarray}$$
 $$\begin{eqnarray}\displaystyle \boldsymbol{q}(X,0,z)=\unicode[STIX]{x1D719},\quad \lim _{Y\rightarrow \infty }\boldsymbol{q}(X,Y,z)=\boldsymbol{q}_{B}(X,z), & & \displaystyle\end{eqnarray}$$
along the wall-normal direction, and periodic or symmetry boundary conditions in the spanwise direction,
 $z$
. In (3.1),
 ${\mathcal{G}}()$
is the nonlinear BRE differential operator in abstract notation,
 $\boldsymbol{q}=(u,v,w,p)$
is the vector of state variables,
 $\unicode[STIX]{x1D713}$
is the control variable or design parameter that is part of the state equations (in the present case it represents the functional
 ${\mathcal{F}}(X,z)$
describing the wall deformation),
 $\unicode[STIX]{x1D719}$
is the control variable associated with the boundary conditions (e.g. the transpiration velocity at the wall,
 $v_{w}$
),
 $\boldsymbol{q}_{0}(Y,z)$
represents the upstream or initial condition in
 $X=0$
and
 $\boldsymbol{q}_{B}$
is a given function that specifies the boundary condition at infinity. We define an objective (or cost) functional as
 $$\begin{eqnarray}\displaystyle {\mathcal{J}}(\boldsymbol{q},\unicode[STIX]{x1D713},\unicode[STIX]{x1D719})={\mathcal{E}}(\boldsymbol{q})+\unicode[STIX]{x1D70E}_{1}(\Vert \unicode[STIX]{x1D713}_{X}\Vert ^{\unicode[STIX]{x1D6FD}_{1}}+\Vert \unicode[STIX]{x1D713}\Vert ^{\unicode[STIX]{x1D6FD}_{1}})+\unicode[STIX]{x1D70E}_{2}(\Vert \unicode[STIX]{x1D719}_{X}\Vert ^{\unicode[STIX]{x1D6FD}_{2}}+\Vert \unicode[STIX]{x1D719}\Vert ^{\unicode[STIX]{x1D6FD}_{2}}), & & \displaystyle\end{eqnarray}$$
where
 ${\mathcal{E}}(\boldsymbol{q})$
is a specified target function to be minimized (e.g. the energy of the disturbance, or the wall shear stress; the latter is considered in this study), the second and the third terms on the right-hand side of (3.4) are penalization terms depending on the norm of the control variable (usually, these quantities place constraints on the magnitude of the admissible control variables, since they cannot increase or decrease indefinitely),
 $\unicode[STIX]{x1D70E}_{i}$
and
 $\unicode[STIX]{x1D6FD}_{i}$
,
 $i=1,2$
, are given constants and subscript
 $X$
denotes derivative with respect to
 $X$
. The norm
 $\Vert ~\Vert$
in (3.4) is associated with an appropriate inner product of two complex functions,
 $f$
and
 $g$
, defined as
 $$\begin{eqnarray}\displaystyle \langle f,g\rangle =\int _{0}^{X_{t}}f^{\ast }g\,\text{d}X & & \displaystyle\end{eqnarray}$$
in the space
 $[0,X_{t}]$
, with
 $X_{t}$
being the terminal streamwise location (the star in (3.5) denotes complex conjugate).
A common approach to transform a (nonlinear) constrained optimization problem into an unconstrained problem is by using the method of Lagrange multipliers (see, for example, Joslin et al. Reference Joslin, Gunzburger, Nicolaides, Erlebacher and Hussaini1997; Gunzburger Reference Gunzburger2000; Zuccher et al. Reference Zuccher, Luchini and Bottaro2004). To this end, we consider the Lagrangian
 $$\begin{eqnarray}\displaystyle {\mathcal{L}}(\boldsymbol{q},\unicode[STIX]{x1D713},\unicode[STIX]{x1D719},\boldsymbol{q}^{a})={\mathcal{J}}(\boldsymbol{q},\unicode[STIX]{x1D713},\unicode[STIX]{x1D719})-\langle {\mathcal{G}}(\boldsymbol{q},\unicode[STIX]{x1D713}),\boldsymbol{q}^{a}\rangle , & & \displaystyle\end{eqnarray}$$
where
 $\boldsymbol{q}^{a}$
is the vector of Lagrange multipliers
 $(u^{a},v^{a},w^{a},p^{a})$
, also known as the adjoint vector. In other words, the Lagrange multipliers are introduced in order to transform the minimization of
 ${\mathcal{J}}(\boldsymbol{q},\unicode[STIX]{x1D713},\unicode[STIX]{x1D719})$
under the constraint
 ${\mathcal{G}}(\boldsymbol{q},\unicode[STIX]{x1D713})=0$
into the unconstrained minimization of
 ${\mathcal{L}}(\boldsymbol{q},\unicode[STIX]{x1D713},\unicode[STIX]{x1D719},\boldsymbol{q}^{a})$
. The unconstrained optimization problem can be formulated as:
Find the control variables
 $\unicode[STIX]{x1D713}$
and
 $\unicode[STIX]{x1D719}$
, the state variables
 $\boldsymbol{q}$
and the adjoint variables
 $\boldsymbol{q}^{a}$
such that the Lagrangian
 ${\mathcal{L}}(\boldsymbol{q},\unicode[STIX]{x1D713},\unicode[STIX]{x1D719},\boldsymbol{q}^{a})$
is a stationary function, that is
 $$\begin{eqnarray}\displaystyle \unicode[STIX]{x1D6FF}{\mathcal{L}}=\frac{\unicode[STIX]{x2202}{\mathcal{L}}}{\unicode[STIX]{x2202}\boldsymbol{q}}\unicode[STIX]{x1D6FF}\boldsymbol{q}+\frac{\unicode[STIX]{x2202}{\mathcal{L}}}{\unicode[STIX]{x2202}\unicode[STIX]{x1D713}}\unicode[STIX]{x1D6FF}\unicode[STIX]{x1D713}+\frac{\unicode[STIX]{x2202}{\mathcal{L}}}{\unicode[STIX]{x2202}\unicode[STIX]{x1D719}}\unicode[STIX]{x1D6FF}\unicode[STIX]{x1D719}+\frac{\unicode[STIX]{x2202}{\mathcal{L}}}{\unicode[STIX]{x2202}\boldsymbol{q}^{a}}\unicode[STIX]{x1D6FF}\boldsymbol{q}^{a}=0, & & \displaystyle\end{eqnarray}$$
where
 $$\begin{eqnarray}\displaystyle \frac{\unicode[STIX]{x2202}{\mathcal{L}}}{\unicode[STIX]{x2202}a}\unicode[STIX]{x1D6FF}a=\frac{{\mathcal{L}}(a+\unicode[STIX]{x1D716}\unicode[STIX]{x1D6FF}a)-{\mathcal{L}}(a)}{\unicode[STIX]{x1D716}} & & \displaystyle\end{eqnarray}$$
represents directional differentiation in the generic direction
 $\unicode[STIX]{x1D6FF}a$
. All directional derivatives in (3.7) must vanish, providing different sets of equations:
(i) Adjoint BRE equations are obtained by taking the derivative with respect to
 $\boldsymbol{q}$
, (3.9)$$\begin{eqnarray}\displaystyle \frac{\unicode[STIX]{x2202}{\mathcal{L}}}{\unicode[STIX]{x2202}\boldsymbol{q}}=0\quad \Rightarrow \quad {\mathcal{G}}^{a}(\boldsymbol{q}^{a},\unicode[STIX]{x1D713})=0. & & \displaystyle\end{eqnarray}$$
(ii) Optimality conditions are obtained by taking the derivatives with respect to
$\unicode[STIX]{x1D713}$
or
$\unicode[STIX]{x1D719}$
, (3.10a,b )$$\begin{eqnarray}\displaystyle \frac{\unicode[STIX]{x2202}{\mathcal{L}}}{\unicode[STIX]{x2202}\unicode[STIX]{x1D713}}=0,\quad \frac{\unicode[STIX]{x2202}{\mathcal{L}}}{\unicode[STIX]{x2202}\unicode[STIX]{x1D719}}=0\quad \Rightarrow \quad O(\boldsymbol{q}^{a},\boldsymbol{q},\unicode[STIX]{x1D713},\unicode[STIX]{x1D719})=0. & & \displaystyle\end{eqnarray}$$
(iii) The original BRE equations are obtained by taking the derivative with respect to
$\boldsymbol{q}^{a}$
, (3.11)$$\begin{eqnarray}\displaystyle \frac{\unicode[STIX]{x2202}{\mathcal{L}}}{\unicode[STIX]{x2202}\boldsymbol{q}_{a}}=0\quad \Rightarrow \quad {\mathcal{G}}(\boldsymbol{q},\unicode[STIX]{x1D713})=0. & & \displaystyle\end{eqnarray}$$


Equations (3.9)–(3.11) form the optimal control system that can be utilized to determine the optimal states and the control variables. One can note that the stationarity of the Lagrangian with respect to the adjoint variables
 $\boldsymbol{q}^{a}=(u^{a},v^{a},w^{a},p^{a})$
essentially yields the original state equations, while the stationarity with respect to the state variables
 $\boldsymbol{q}=(u,v,w,p)$
yields the adjoint equations that depend on the state variables. The relationship between the state variables and the adjoint variables can be expressed by the adjoint identity,
 $$\begin{eqnarray}\displaystyle \langle {\mathcal{G}}(\boldsymbol{q},\unicode[STIX]{x1D713}),\boldsymbol{q}^{a}\rangle =\langle \boldsymbol{q},{\mathcal{G}}^{a}(\boldsymbol{q}^{a},\unicode[STIX]{x1D713})\rangle +{\mathcal{B}}(\unicode[STIX]{x1D719}), & & \displaystyle\end{eqnarray}$$
where the last term,
 ${\mathcal{B}}$
, represents a residual from the boundary conditions.
The adjoint BRE equations (see derivation in appendix A) are
 $$\begin{eqnarray}\displaystyle \frac{\unicode[STIX]{x2202}v^{a}}{\unicode[STIX]{x2202}Y}+{\mathcal{D}}w^{a}=0, & & \displaystyle\end{eqnarray}$$
 $$\begin{eqnarray}\displaystyle & & \displaystyle -u\frac{\unicode[STIX]{x2202}u^{a}}{\unicode[STIX]{x2202}X}-\hat{v}\frac{\unicode[STIX]{x2202}u^{a}}{\unicode[STIX]{x2202}Y}-w\frac{\unicode[STIX]{x2202}u^{a}}{\unicode[STIX]{x2202}z}+u^{a}\frac{\unicode[STIX]{x2202}u}{\unicode[STIX]{x2202}X}+v^{a}\frac{\unicode[STIX]{x2202}v}{\unicode[STIX]{x2202}X}+w^{a}\frac{\unicode[STIX]{x2202}w}{\unicode[STIX]{x2202}X}-\frac{\unicode[STIX]{x2202}{\mathcal{F}}}{\unicode[STIX]{x2202}X}\left(u^{a}\frac{\unicode[STIX]{x2202}u}{\unicode[STIX]{x2202}Y}+v^{a}\frac{\unicode[STIX]{x2202}v}{\unicode[STIX]{x2202}Y}+w^{a}\frac{\unicode[STIX]{x2202}w}{\unicode[STIX]{x2202}Y}\right)\nonumber\\ \displaystyle & & \displaystyle \quad +\,2G_{\unicode[STIX]{x1D6EC}}uv^{a}-\frac{\unicode[STIX]{x2202}p^{a}}{\unicode[STIX]{x2202}X}+\frac{\unicode[STIX]{x2202}{\mathcal{F}}}{\unicode[STIX]{x2202}X}\frac{\unicode[STIX]{x2202}p^{a}}{\unicode[STIX]{x2202}Y}-\frac{\unicode[STIX]{x2202}^{2}u^{a}}{\unicode[STIX]{x2202}Y^{2}}-{\mathcal{D}}^{2}u^{a}-\frac{\unicode[STIX]{x2202}^{2}{\mathcal{F}}}{\unicode[STIX]{x2202}z^{2}}\frac{\unicode[STIX]{x2202}u^{a}}{\unicode[STIX]{x2202}Y}=0,\end{eqnarray}$$
 $$\begin{eqnarray}\displaystyle & & \displaystyle -u\frac{\unicode[STIX]{x2202}v^{a}}{\unicode[STIX]{x2202}X}-\hat{v}\frac{\unicode[STIX]{x2202}v^{a}}{\unicode[STIX]{x2202}Y}-w\frac{\unicode[STIX]{x2202}v^{a}}{\unicode[STIX]{x2202}z}+u^{a}\frac{\unicode[STIX]{x2202}u}{\unicode[STIX]{x2202}Y}+v^{a}\frac{\unicode[STIX]{x2202}v}{\unicode[STIX]{x2202}Y}+w^{a}\frac{\unicode[STIX]{x2202}w}{\unicode[STIX]{x2202}Y}-\frac{\unicode[STIX]{x2202}p^{a}}{\unicode[STIX]{x2202}Y}-\frac{\unicode[STIX]{x2202}^{2}v^{a}}{\unicode[STIX]{x2202}Y^{2}}\nonumber\\ \displaystyle & & \displaystyle \quad -\,{\mathcal{D}}^{2}v^{a}-\frac{\unicode[STIX]{x2202}^{2}{\mathcal{F}}}{\unicode[STIX]{x2202}z^{2}}\frac{\unicode[STIX]{x2202}v^{a}}{\unicode[STIX]{x2202}Y}=0,\end{eqnarray}$$
 $$\begin{eqnarray}\displaystyle & & \displaystyle -u\frac{\unicode[STIX]{x2202}w^{a}}{\unicode[STIX]{x2202}X}-\hat{v}\frac{\unicode[STIX]{x2202}w^{a}}{\unicode[STIX]{x2202}Y}-w\frac{\unicode[STIX]{x2202}w^{a}}{\unicode[STIX]{x2202}z}+u^{a}\frac{\unicode[STIX]{x2202}u}{\unicode[STIX]{x2202}z}+v^{a}\frac{\unicode[STIX]{x2202}v}{\unicode[STIX]{x2202}z}+w^{a}\frac{\unicode[STIX]{x2202}w}{\unicode[STIX]{x2202}z}-\frac{\unicode[STIX]{x2202}{\mathcal{F}}}{\unicode[STIX]{x2202}z}\left(u^{a}\frac{\unicode[STIX]{x2202}u}{\unicode[STIX]{x2202}Y}+v^{a}\frac{\unicode[STIX]{x2202}v}{\unicode[STIX]{x2202}Y}+w^{a}\frac{\unicode[STIX]{x2202}w}{\unicode[STIX]{x2202}Y}\right)\nonumber\\ \displaystyle & & \displaystyle \quad -\,{\mathcal{D}}p^{a}-\frac{\unicode[STIX]{x2202}^{2}w^{a}}{\unicode[STIX]{x2202}Y^{2}}-{\mathcal{D}}^{2}w^{a}-\frac{\unicode[STIX]{x2202}^{2}{\mathcal{F}}}{\unicode[STIX]{x2202}z^{2}}\frac{\unicode[STIX]{x2202}w^{a}}{\unicode[STIX]{x2202}Y}=0,\end{eqnarray}$$
satisfying the initial and boundary conditions
 $$\begin{eqnarray}\displaystyle & \displaystyle (u^{a},v^{a},w^{a},p^{a})|_{X=X_{t}}=(0,0,0,0)\quad \text{in}~\unicode[STIX]{x1D6FA}, & \displaystyle\end{eqnarray}$$
 $$\begin{eqnarray}\displaystyle & \displaystyle (u^{a},v^{a},w^{a})|_{\unicode[STIX]{x1D6E4}}=\left\{\begin{array}{@{}ll@{}}(\unicode[STIX]{x1D6FC}(\unicode[STIX]{x1D70F}_{w}-\unicode[STIX]{x1D70F}_{0}),0,0)\quad & \text{for}~X\in [X_{s0},X_{s1}]\\ (0,0,0)\quad & \text{otherwise}\end{array}\right. & \displaystyle\end{eqnarray}$$
and
 $$\begin{eqnarray}\displaystyle (u^{a},v^{a},w^{a},p^{a})|_{Y\rightarrow \infty }=(0,0,0,0), & & \displaystyle\end{eqnarray}$$
where
 $\unicode[STIX]{x1D6FC}$
is a constant pre-factor that controls the penalization of the wall shear stress. With the state variables
 $(u,v,w,p)$
determined from equations (2.9)–(2.12), the adjoint equations (3.13)–(3.16) are linear and parabolic, and can be solved via a marching procedure in the backward direction, starting from the terminal streamwise location,
 $X_{t}$
, towards the initial streamwise location
 $X_{0}$
.
The optimality equation for control based on wall transpiration is obtained in the form (see derivation in appendix B)
 $$\begin{eqnarray}\displaystyle \frac{\unicode[STIX]{x2202}^{2}v_{w}}{\unicode[STIX]{x2202}X^{2}}-v_{w}=\frac{1}{\unicode[STIX]{x1D70E}_{2}}\left(p^{a}+\frac{\unicode[STIX]{x2202}v^{a}}{\unicode[STIX]{x2202}Y}\right), & & \displaystyle\end{eqnarray}$$
satisfying the boundary conditions
 $$\begin{eqnarray}\displaystyle \frac{\unicode[STIX]{x2202}v_{w}}{\unicode[STIX]{x2202}X}(X_{0})=0,\quad \frac{\unicode[STIX]{x2202}v_{w}}{\unicode[STIX]{x2202}X}(X_{1})=0. & & \displaystyle\end{eqnarray}$$
Given
 $p^{a}$
and
 $v^{a}$
from the adjoint equations, equation (3.20) represents a two-point boundary value problem for
 $X$
inside the interval
 $[X_{0},X_{1}]$
. The optimality equation for control based on wall deformation is given as (see derivation in appendix C)
 $$\begin{eqnarray}\displaystyle \unicode[STIX]{x1D70E}_{1}\frac{\unicode[STIX]{x2202}^{2}{\mathcal{F}}}{\unicode[STIX]{x2202}X^{2}}-2\frac{\unicode[STIX]{x2202}u^{a}}{\unicode[STIX]{x2202}z}\frac{\unicode[STIX]{x2202}^{2}u}{\unicode[STIX]{x2202}Y^{2}}\frac{\unicode[STIX]{x2202}{\mathcal{F}}}{\unicode[STIX]{x2202}z}-\unicode[STIX]{x1D70E}_{1}{\mathcal{F}}=\frac{\unicode[STIX]{x2202}^{2}u^{a}}{\unicode[STIX]{x2202}z^{2}}\frac{\unicode[STIX]{x2202}u}{\unicode[STIX]{x2202}Y}-2\frac{\unicode[STIX]{x2202}u^{a}}{\unicode[STIX]{x2202}z}\frac{\unicode[STIX]{x2202}^{2}u}{\unicode[STIX]{x2202}Y\unicode[STIX]{x2202}z}-\frac{\unicode[STIX]{x2202}p^{a}}{\unicode[STIX]{x2202}X}\frac{\unicode[STIX]{x2202}u}{\unicode[STIX]{x2202}Y}-\frac{\unicode[STIX]{x2202}p^{a}}{\unicode[STIX]{x2202}z}\frac{\unicode[STIX]{x2202}w}{\unicode[STIX]{x2202}Y}, & & \displaystyle\end{eqnarray}$$
subject to the boundary conditions
 $$\begin{eqnarray}\displaystyle \frac{\unicode[STIX]{x2202}{\mathcal{F}}}{\unicode[STIX]{x2202}X}(X_{0})=0,\quad \frac{\unicode[STIX]{x2202}{\mathcal{F}}}{\unicode[STIX]{x2202}X}(X_{1})=0. & & \displaystyle\end{eqnarray}$$
Again, equation (3.22) represents a two-point boundary value problem for
 $X$
inside the interval
 $[X_{0},X_{1}]$
, but unlike the optimality condition associated with the wall transpiration that depends only on adjoint variables, this equation also depends on state variables,
 $u$
and
 $w$
, and their derivatives. The constant pre-factors
 $\unicode[STIX]{x1D70E}_{1}$
and
 $\unicode[STIX]{x1D70E}_{2}$
are used to control the importance of the terms they multiply in (A 1).
Alternatively, the optimality condition (3.20) or (3.22) can be replaced by a gradient method or steepest descent method, wherein the objective function is updated according to
 $$\begin{eqnarray}\displaystyle {\mathcal{F}}^{(n+1)}={\mathcal{F}}^{(n)}-\unicode[STIX]{x1D6FC}\frac{\text{d}{\mathcal{J}}^{(n)}}{\text{d}{\mathcal{F}}^{(n)}} & & \displaystyle\end{eqnarray}$$
for control based on wall deformations, or
 $$\begin{eqnarray}\displaystyle v_{w}^{(n+1)}=v_{w}^{(n)}-\unicode[STIX]{x1D6FC}\frac{\text{d}{\mathcal{J}}^{(n)}}{\text{d}v_{w}^{(n)}} & & \displaystyle\end{eqnarray}$$
for control based on wall transpiration, where
 $n$
represent the iteration index, and
 $\unicode[STIX]{x1D6FC}$
in this case is the descent parameter (note that the results in this study are obtained based on solving the optimality equations (3.20) and (3.22)).
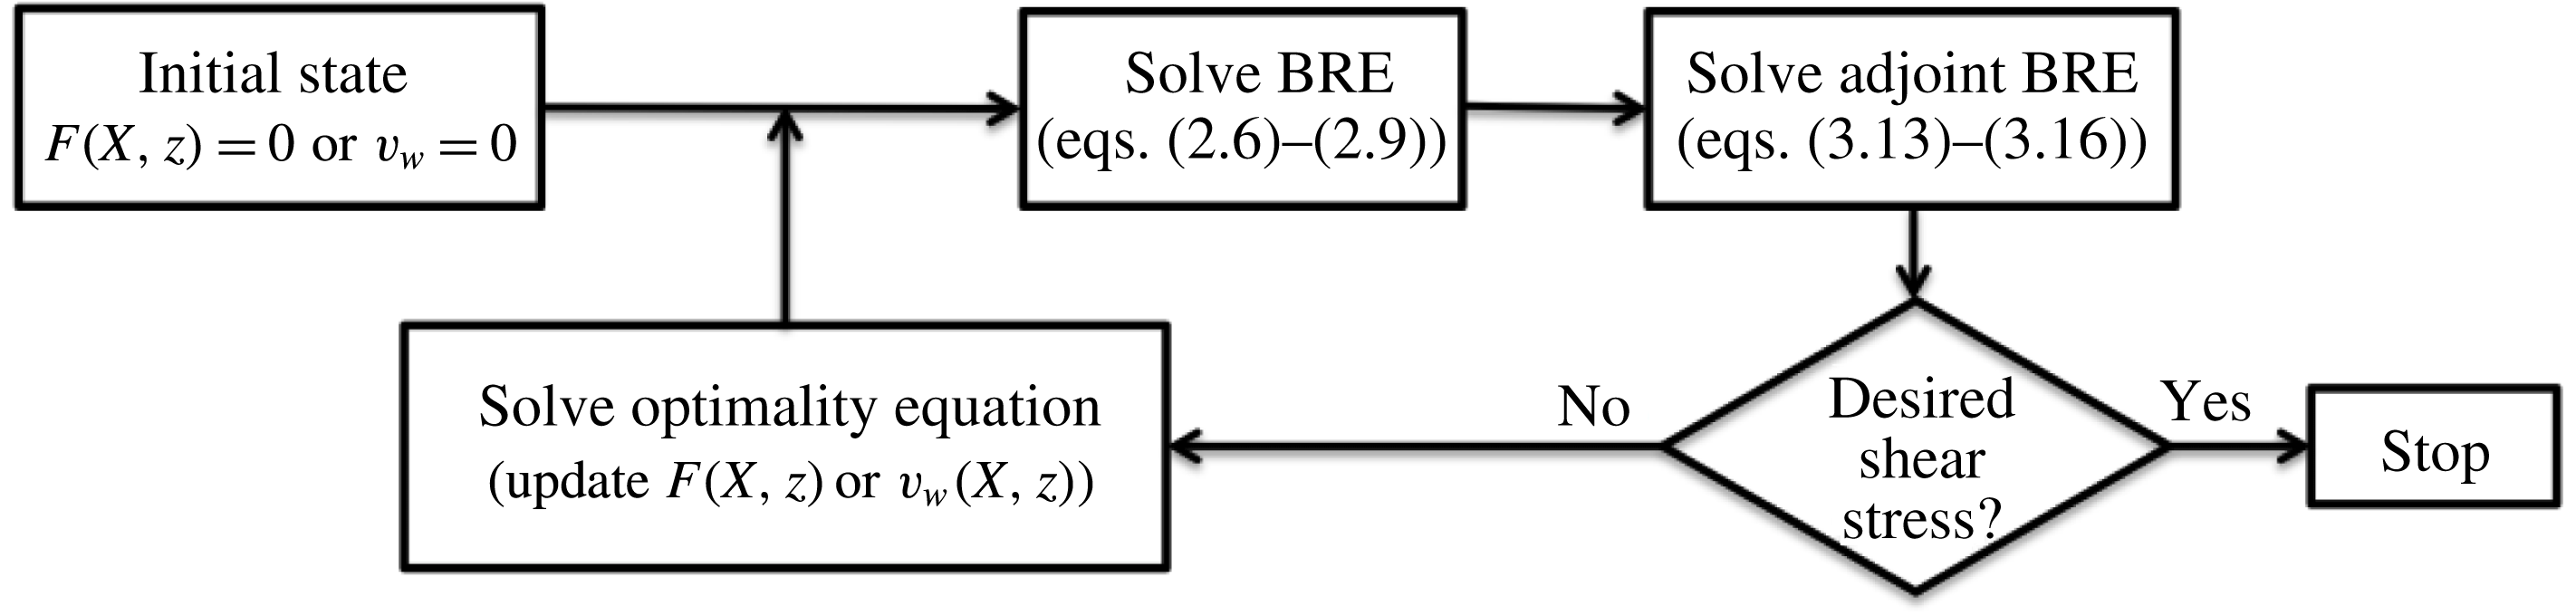
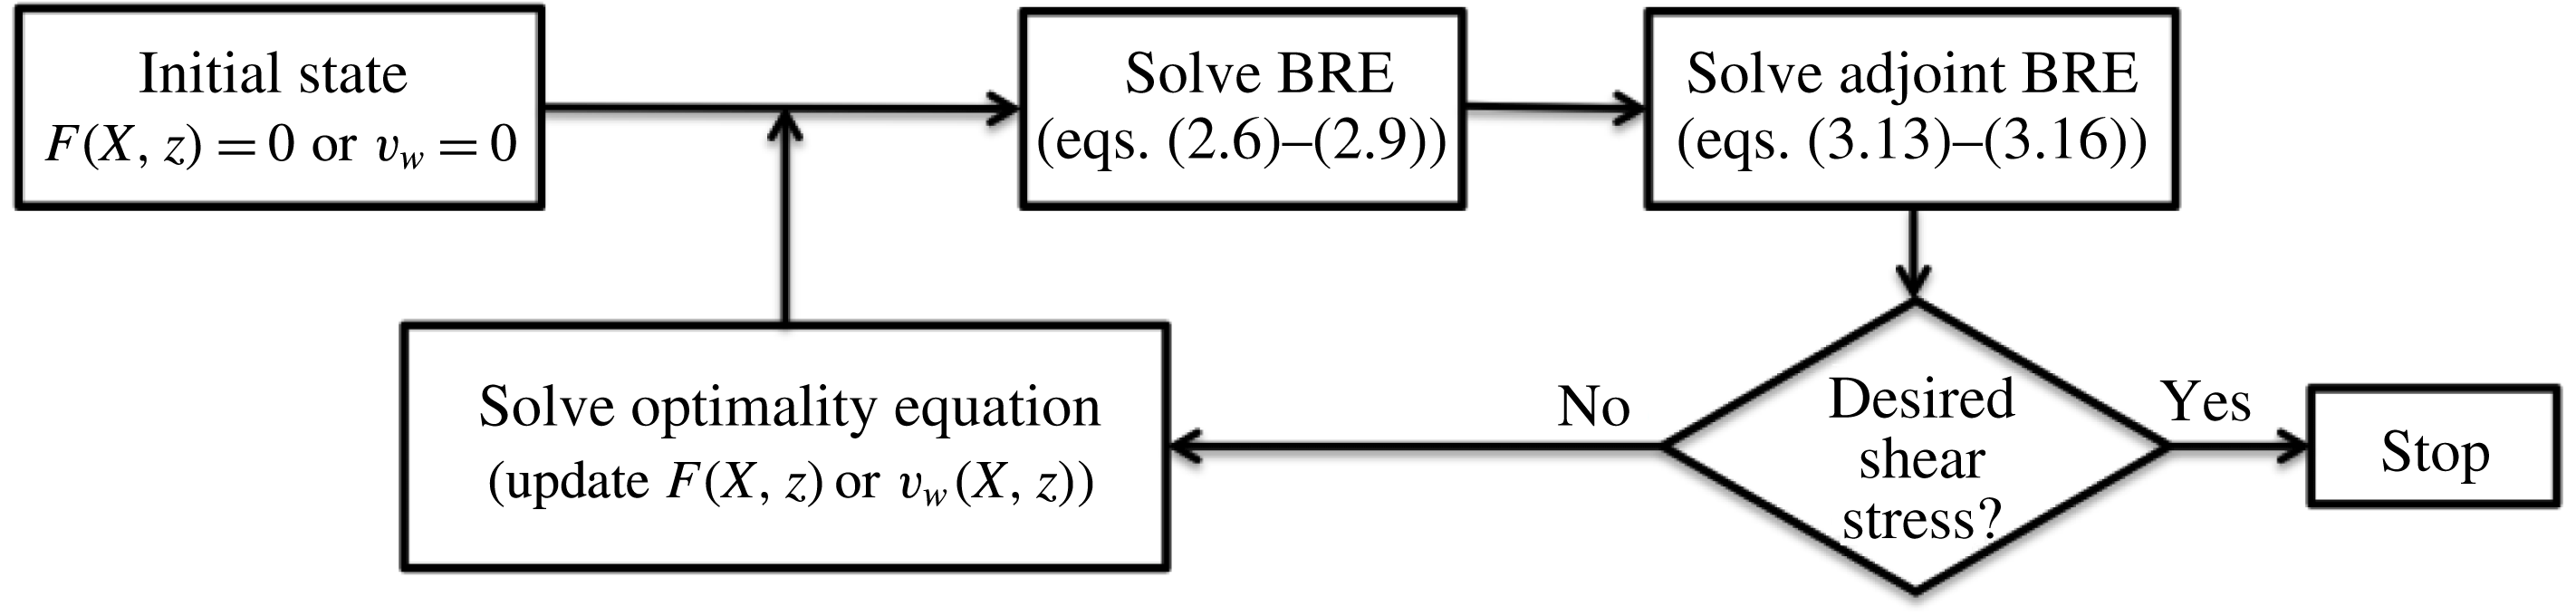
The optimal control procedure based on wall transpiration or deformation is shown schematically in figure 2. The control algorithm starts with the solution to BRE for the uncontrolled boundary layer, followed by the solution to the adjoint BRE (note that the adjoint BRE depends on the solution to the BRE). The difference between the wall shear stress and the Blasius wall shear stress is then compared to a desired value; if the difference is larger than a given threshold then the optimality condition equation is solved to determine the new wall shape
 ${\mathcal{F}}$
, or the new wall transpiration velocity
 $v_{w}$
. Once these are determined, the loop is repeated, and the calculation finishes when the difference between the wall shear stress and the desired value is less than the threshold.
Schematic of the control algorithm steps.
Adjoint equations (3.13)–(3.16) and the associated initial and boundary conditions (3.17)–(3.19) are solved numerically on the same grid as the original BRE state equations (2.9)–(2.12), and utilizing the same numerical algorithm (as for the BRE equations), except that the marching is preformed backwards, starting from the terminal streamwise location. The optimality equations (3.20) and (3.22) and the associated boundary conditions (3.21) and (3.23) respectively, are solved via a Jacobi relaxation method.
4 Results and discussion
4.1 Preliminaries
A row of roughness elements located at a fixed distance of 0.5 m from the leading edge (see figure 1) is considered for the spanwise separation distances
 $\unicode[STIX]{x1D6EC}^{\ast }=0.8$
, 1.2 and 1.6 cm. The effect of roughness elements on the boundary layer is not directly modelled, but taken into account by imposing initial conditions derived in Goldstein et al. (Reference Goldstein, Sescu, Duck and Choudhari2010) through asymptotic analysis under the assumption that the roughness height is asymptotically small and the Reynolds number is large. The Görtler number based on spanwise separation is
 $G_{\unicode[STIX]{x1D6EC}}=318\,887$
(corresponding to a Görtler number based on the momentum displacement thickness of 6.428). The functional form describing the roughness element is given by the localized function
 $\exp [-(x^{2}+z^{2})/(D/2)^{2}]$
, where
 $D$
represents the diameter of the roughness element. The kinetic energy associated with the Görtler vortex is calculated according to
 $$\begin{eqnarray}\displaystyle E(X)=\int _{z_{1}}^{z_{2}}\int _{0}^{\infty }[|v-v_{m}(X,y)|^{2}+|w-w_{m}(X,y)|^{2}+|u-u_{m}(X,y)|^{2}]\,\text{d}z\,\text{d}y, & & \displaystyle\end{eqnarray}$$
where
 $u_{m}(X,y)$
,
 $v_{m}(X,y)$
and
 $w_{m}(X,y)$
are the spanwise mean components of velocity, and
 $z_{1}$
and
 $z_{2}$
are the boundary limits in the spanwise direction, while the spanwise averaged wall shear stress given by
 $$\begin{eqnarray}\displaystyle \unicode[STIX]{x1D70F}_{w}(X)=\frac{1}{(z_{2}-z_{1})}\int _{z_{1}}^{z_{2}}\frac{\unicode[STIX]{x2202}u}{\unicode[STIX]{x2202}Y}(X,0,z)\,\text{d}z, & & \displaystyle\end{eqnarray}$$
where, as mentioned earlier, the shape of the wall is taken into account implicitly through the partial derivative with respect to
 $Y$
.
In the results that follow, control is applied using either wall deformation or wall transpiration by an iterative procedure as described in the previous section. In the case of wall transpiration, the cumulative blowing or suction at the wall is realized such that a zero mass flow rate is maintained to avoid injecting or absorbing mass into/from the flow. The efficiency of the control is quantified through results consisting of streamwise velocity contours, streamwise distribution of the energy of the disturbances and of the spanwise averaged wall shear stress.
Energy (a) and the spanwise averaged wall shear stress (b) calculated using four different grids (
 $\unicode[STIX]{x1D6EC}^{\ast }=1.2$
cm).

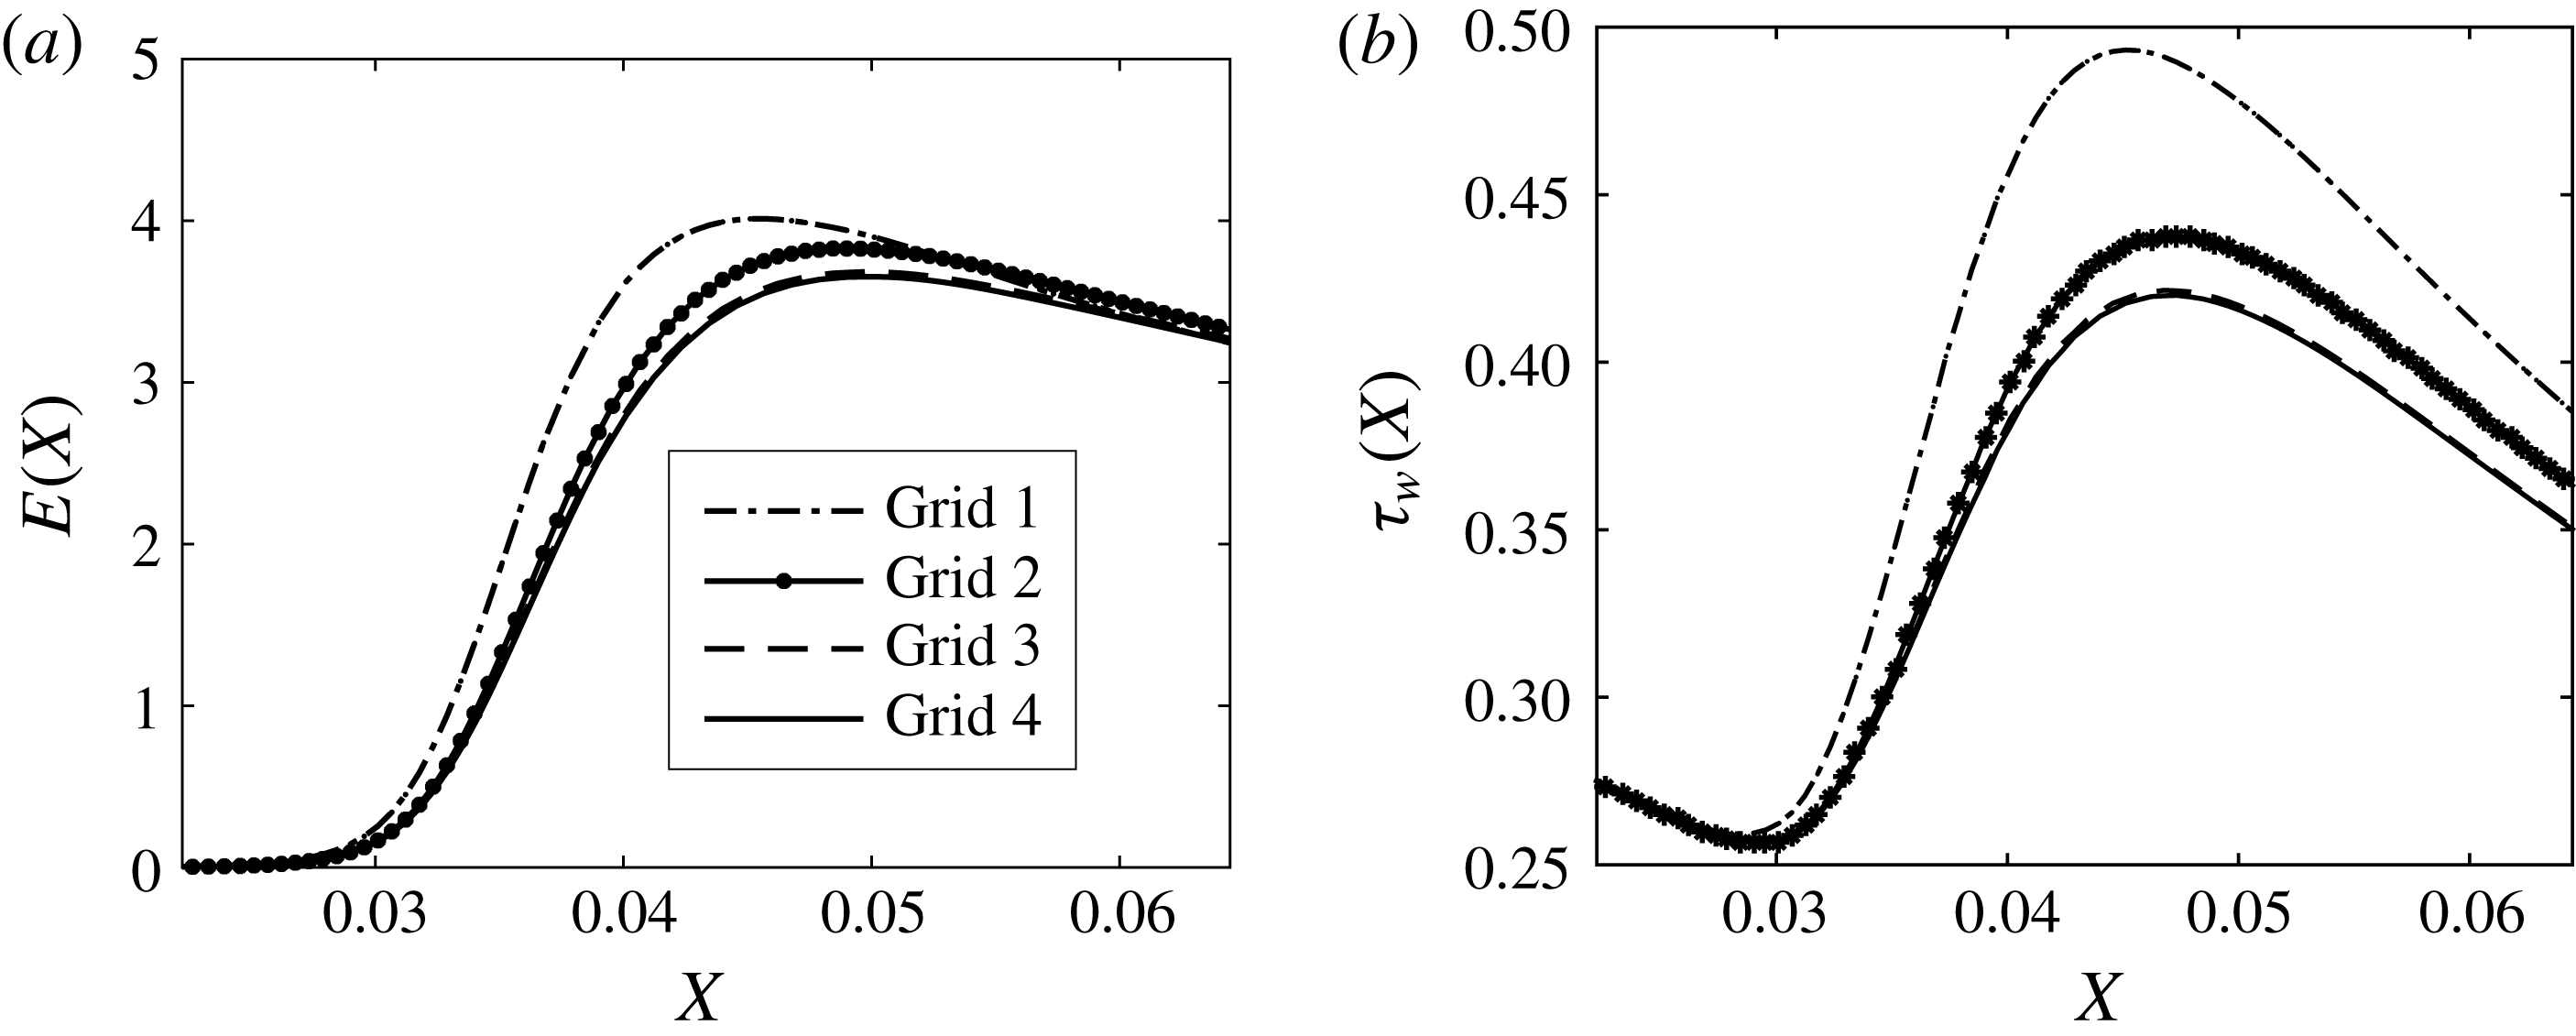
To ensure that the numerical results are accurate, a grid study is performed to determine the appropriate number of grid points along the wall-normal and spanwise directions. To this end, we consider four grid resolutions, consisting of 21, 31, 41 and 51 points in the spanwise direction, and 141, 161, 181 and 201 points in the wall-normal direction, while the number of grid points in the streamwise direction was fixed at 300, corresponding to a spatial step of
 $\unicode[STIX]{x0394}X=2.222\times 10^{-4}$
. To reduce the computational cost, the domain size in the spanwise direction has been reduced to half the distance between two roughness elements, with symmetry conditions – instead of periodic conditions – applied at the right and left boundaries. Results in terms of energy of the disturbance and spanwise averaged shear stress distributions in the streamwise direction are plotted in figure 3 for all four grids. The solution converges to a final state as the number of grid points is increased (the convergence is measured by the relative energy error between two iterations, which was set at
 $10^{-3}$
). As a result of the grid study, the resolution associated with ‘grid 3’, consisting of
 $41\times 181$
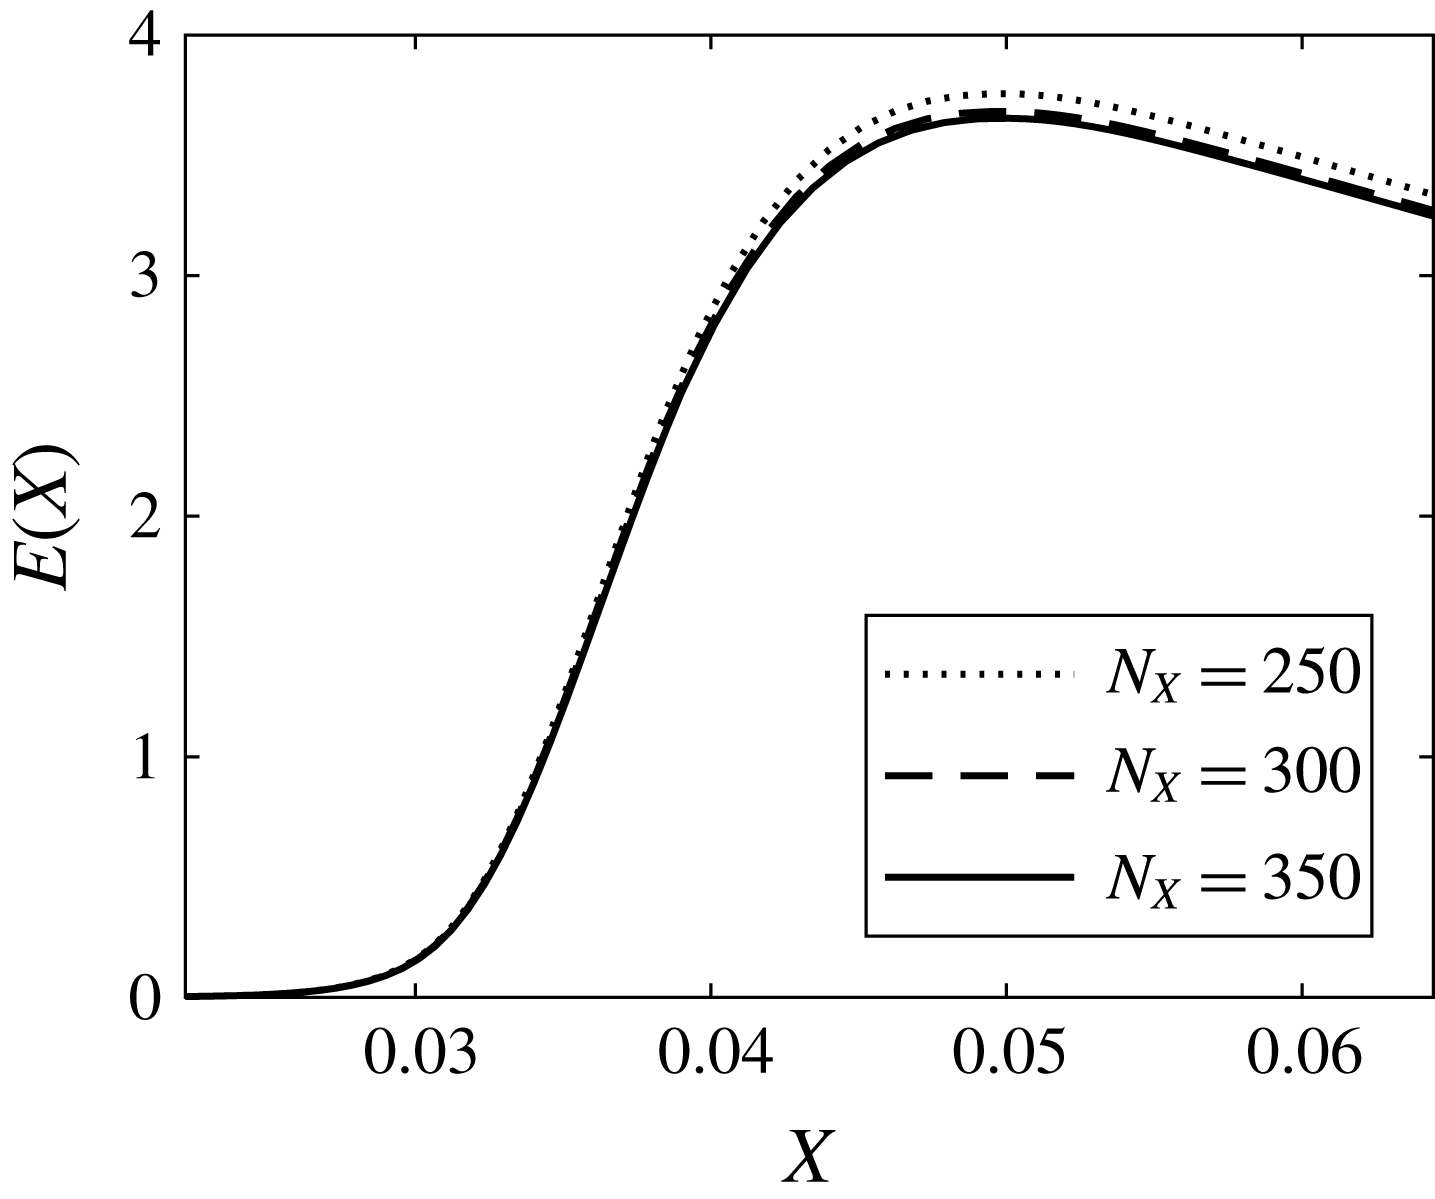
points in the spanwise and wall-normal directions respectively, was chosen for subsequent calculations. The numerical solution was found to be less sensitive to the resolution in the streamwise direction because a sufficiently large number of grid points was chosen (appendix D shows a comparison between three resolutions).
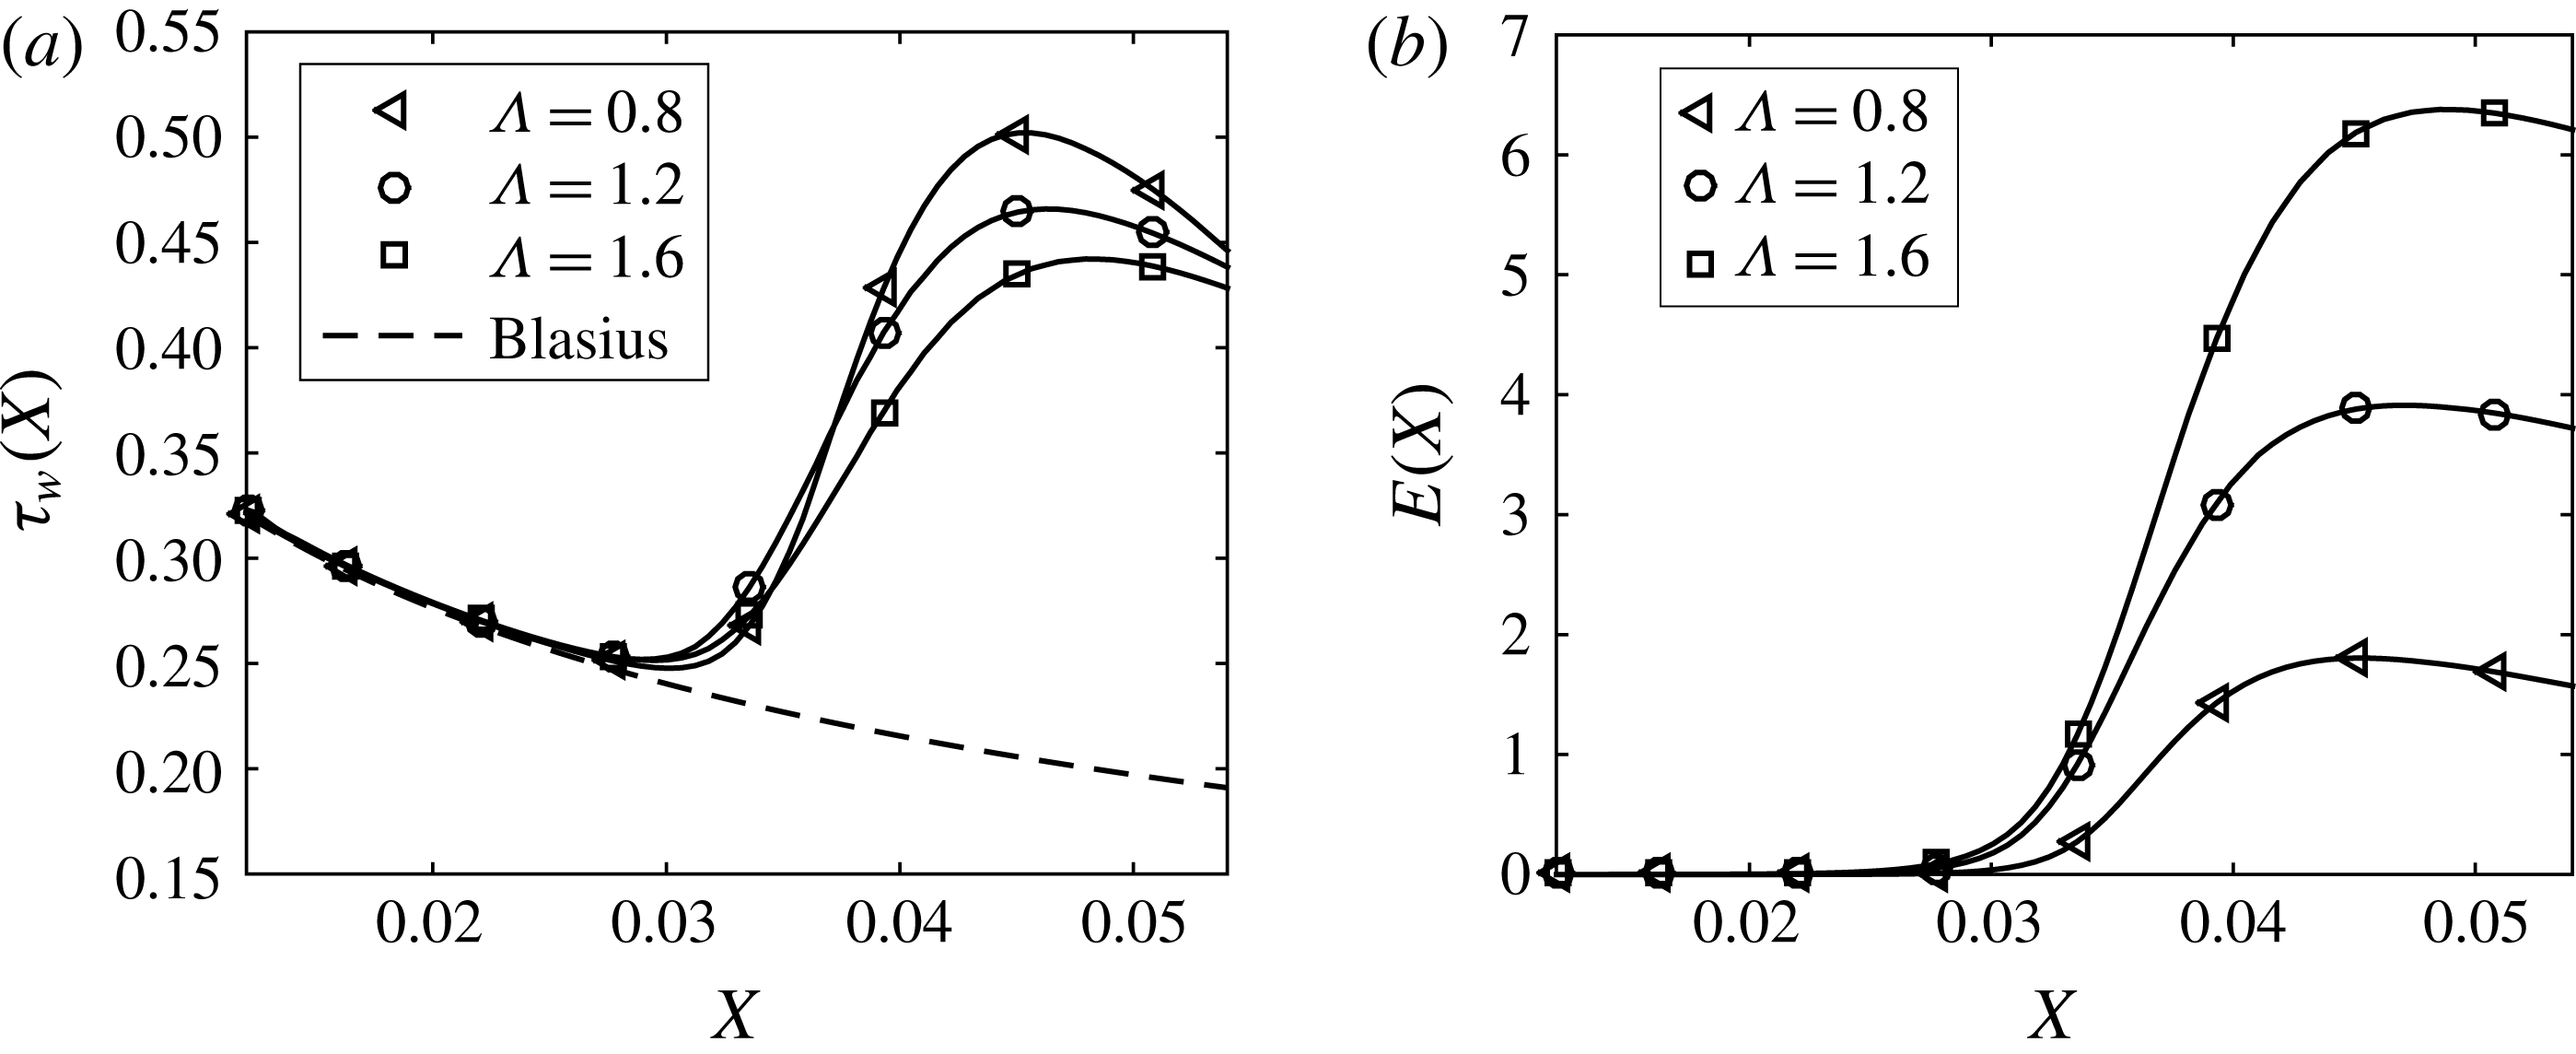
Before presenting results from the control schemes, in figure 4, we show the effect of varying the spanwise separation on the vortex energy growth (a) and on the spanwise averaged wall shear stress (b) for the uncontrolled boundary layer. It is seen that while the wall shear stress is not substantially affected, the energy of the disturbance seems to show a significant variation.
Spanwise averaged wall shear stress (a) and energy (b) as a function of the streamwise direction and for different roughness spanwise separations (
 $\unicode[STIX]{x1D6EC}^{\ast }=1.2$
cm).

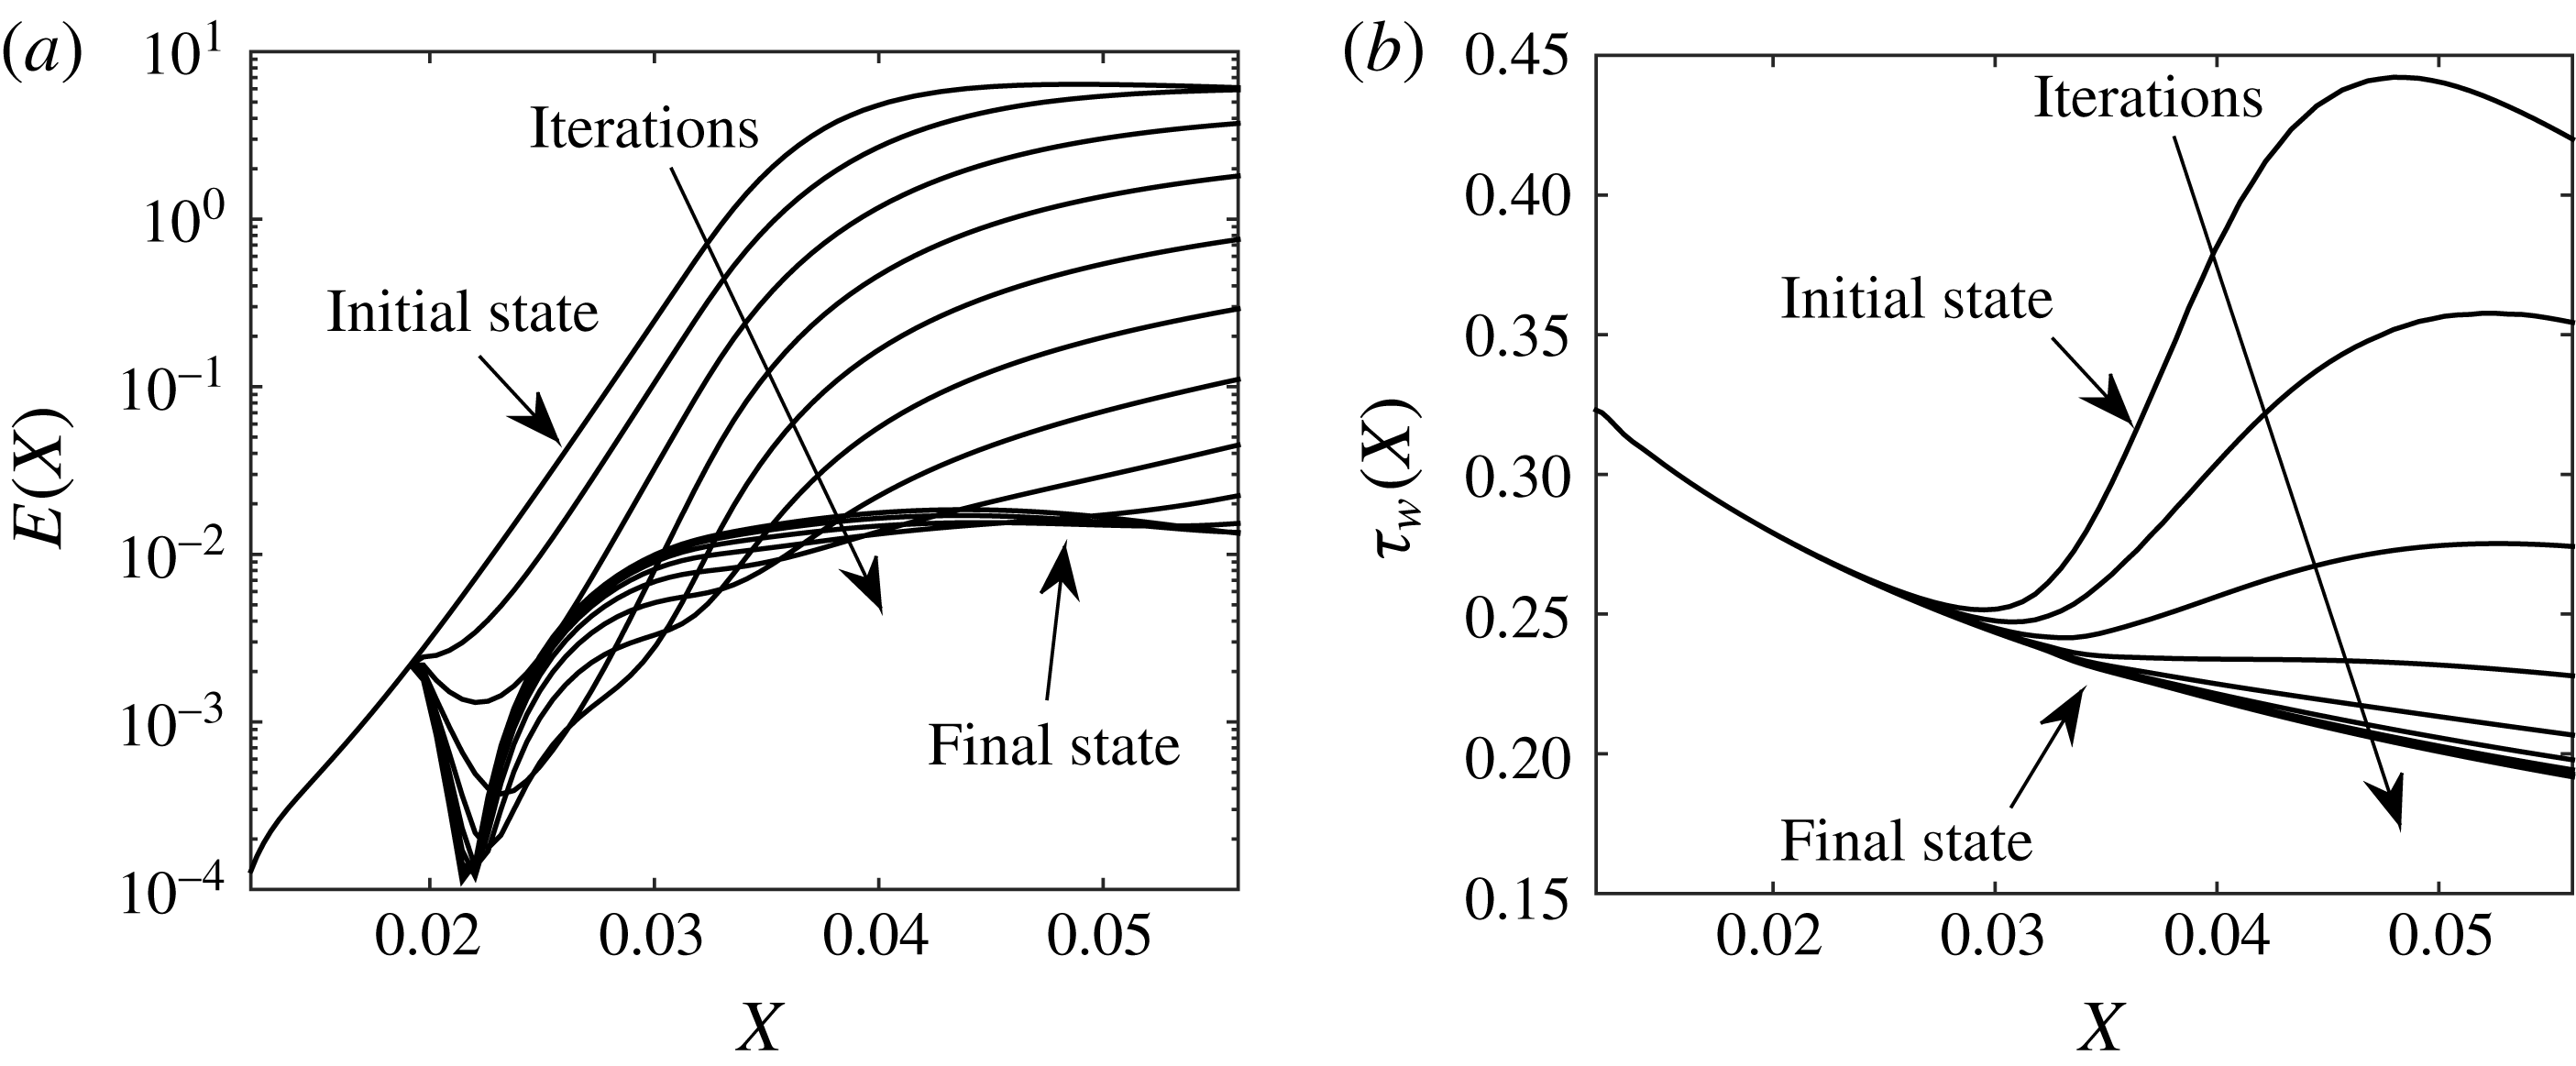
Typical convergence of the control algorithm: (a) energy; (b) spanwise averaged wall shear stress (
 $\unicode[STIX]{x1D6EC}^{\ast }=1.2$
cm).
In the following subsections, the interval where the control is applied,
 $[X_{0},X_{1}]$
, and the interval where the cost function is defined,
 $[X_{s0},X_{s1}]$
, are the same; the downstream boundary of both intervals coincides with the terminal location
 $X_{t}$
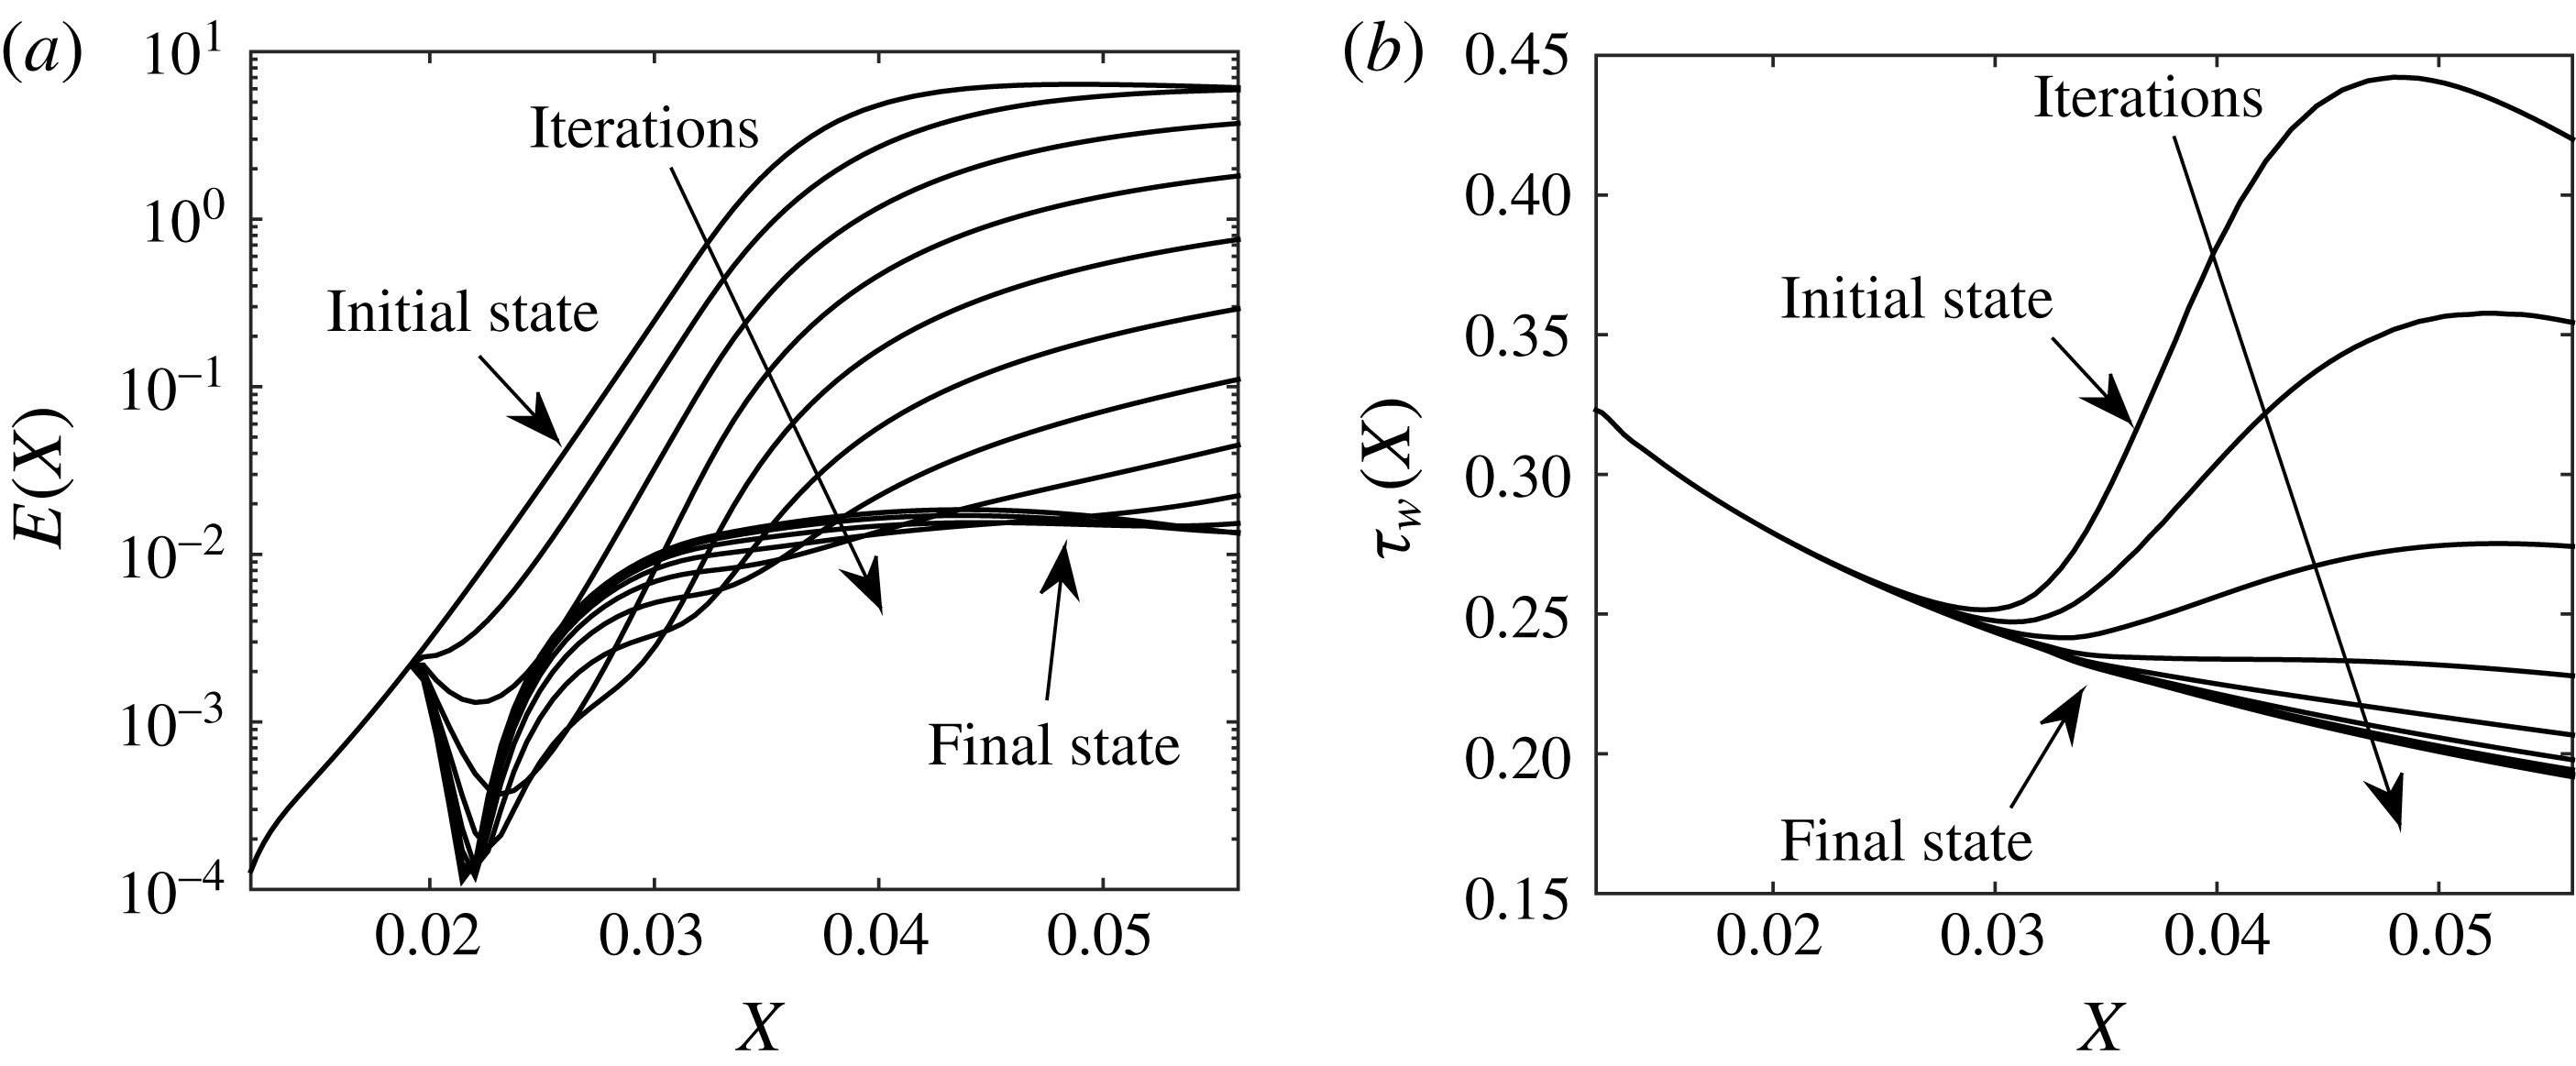
. To illustrate the control iterations and its convergence, figure 5 shows the energy of the disturbance (a) and the spanwise averaged wall shear stress (b) for a control algorithm based on wall deformations; for this particular case, approximately 12 iterations were necessary to obtained the optimum wall deformation that provides the lowest wall shear stress (the total number of iterations depends on the parameters
 $\unicode[STIX]{x1D70E}_{1}$
and
 $\unicode[STIX]{x1D70E}_{2}$
in (3.4)). The boundary layer was excited by a row of periodic roughness elements (the roughness elements are located in
 $x^{\ast }=0.5$
m from the leading edge, the spanwise separation is 1.2 cm and
 $X_{0}=0.015$
). The initial state curve in figure 5 corresponds to the energy associated with the uncontrolled Görtler vortices, while the final state curve represents the optimum wall deformation. More than three orders of magnitude reduction in the energy was attained for this particular case. An exponential convergence for the first several steps can be observed in figure 5(a), where the energy increment in the logarithmic scale from one iteration to the next seems to be constant. The shear stress plot on the right (panel b) shows that in 5–6 iterations the level of the frictional drag can be reduced considerably (the final state is remarkably very close to the shear stress corresponding to the original Blasius solution, as will be shown in the subsequent figures).
4.2 Sensitivity to control location,
$X_{0}$

In this section, we show results for the optimal control applied to three different values of
 $X_{0}$
, which corresponds to the location where the control is initiated. Both types of control, wall deformation and transpiration, are analysed here, and results for spanwise separation of
 $\unicode[STIX]{x1D6EC}^{\ast }=1.2$
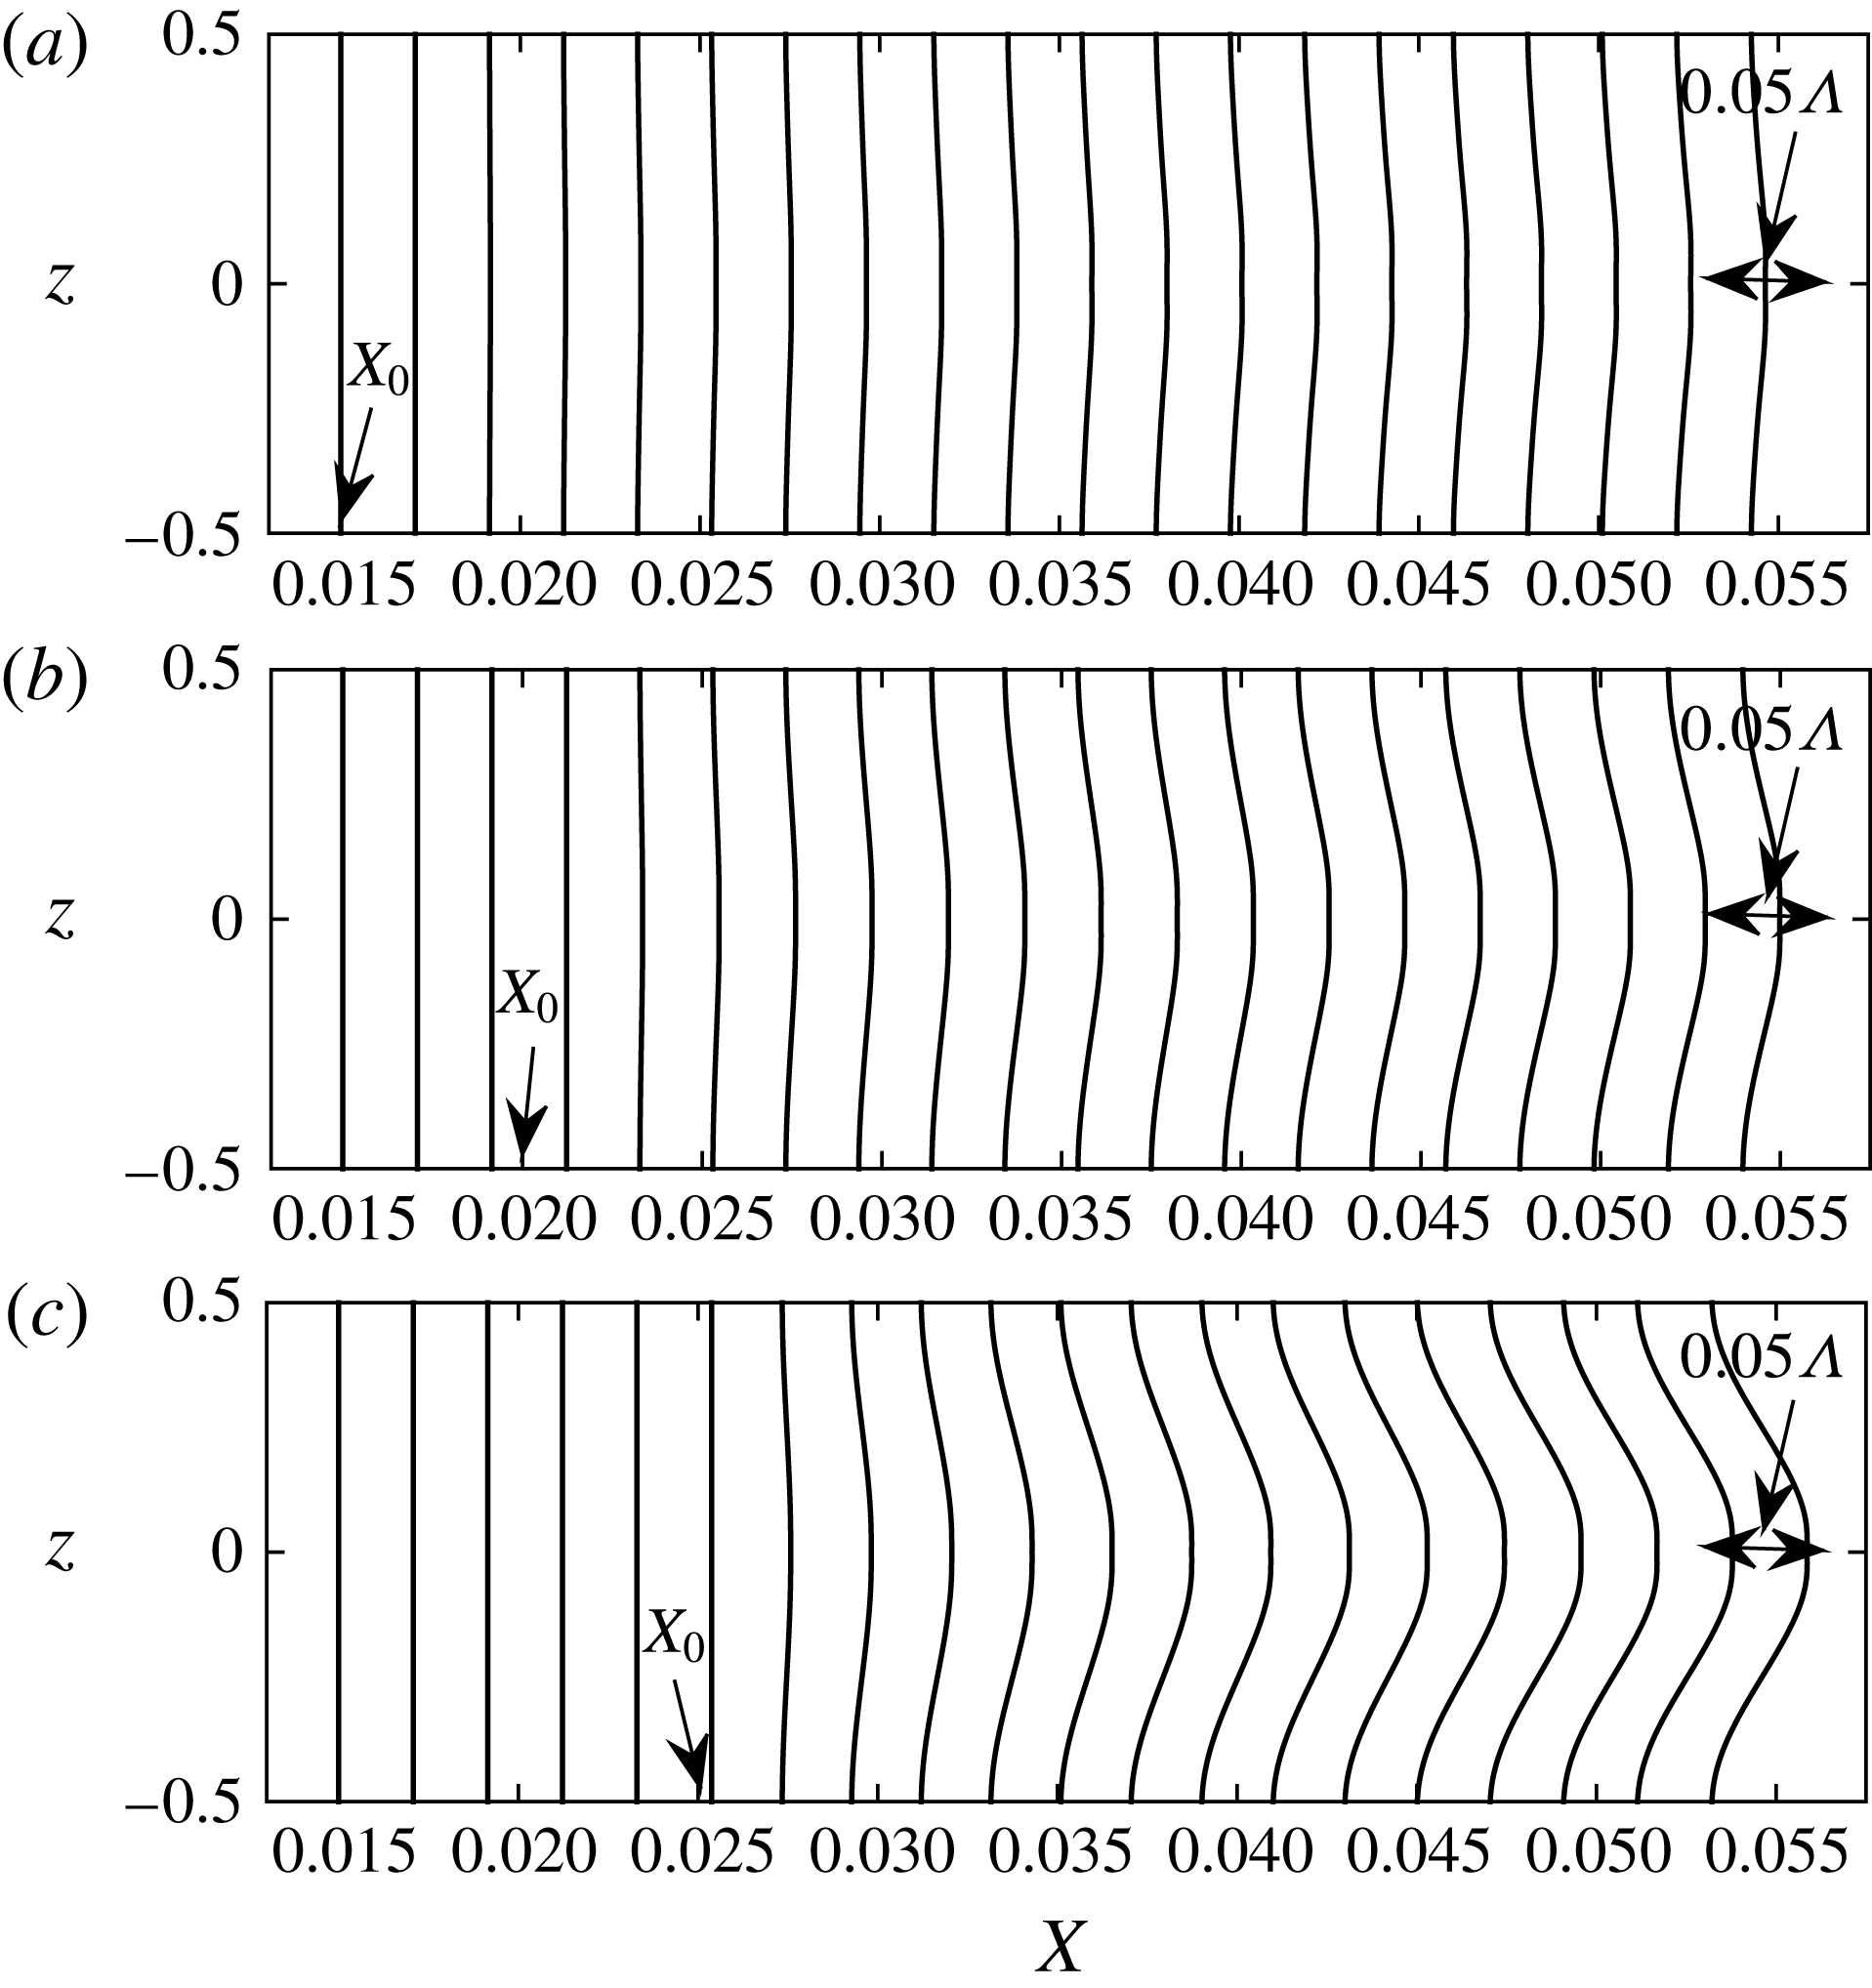
cm are presented and discussed. The wall displacement as a consequence of the control based on wall deformations is plotted in figure 6 at different streamwise locations, and for all three values of
 $X_{0}$
. They represent distributions of the wall displacement along the spanwise direction at equal streamwise increments starting from
 $X=0.015$
to
 $X=0.055$
. It appears that the amplitude of the wall displacement is highly dependent on
 $X_{0}$
, and that the displacement is a small percentage of the boundary layer thickness (the maximum is approximately 5 %, which corresponds to the largest value of
 $X_{0}$
). For the smallest value of
 $X_{0}$
, the maximum wall displacement is below 1 %, which can be considered negligible in the calculation of the integrated frictional drag (i.e. there is no considerable increase in the surface area due to the wall displacement). These results suggest that as the energy of the Görtler vortex increases with the streamwise coordinate it becomes more difficult to control the flow using wall deformations.
The displacement of the wall represented by profiles in the
 $z$
-direction, for the spanwise separation
 $\unicode[STIX]{x1D6EC}^{\ast }=1.2$
cm and different control initiation locations: (a)
 $X_{0}=0.015$
; (b)
 $X_{0}=0.02$
; (c)
 $X_{0}=0.025$
.
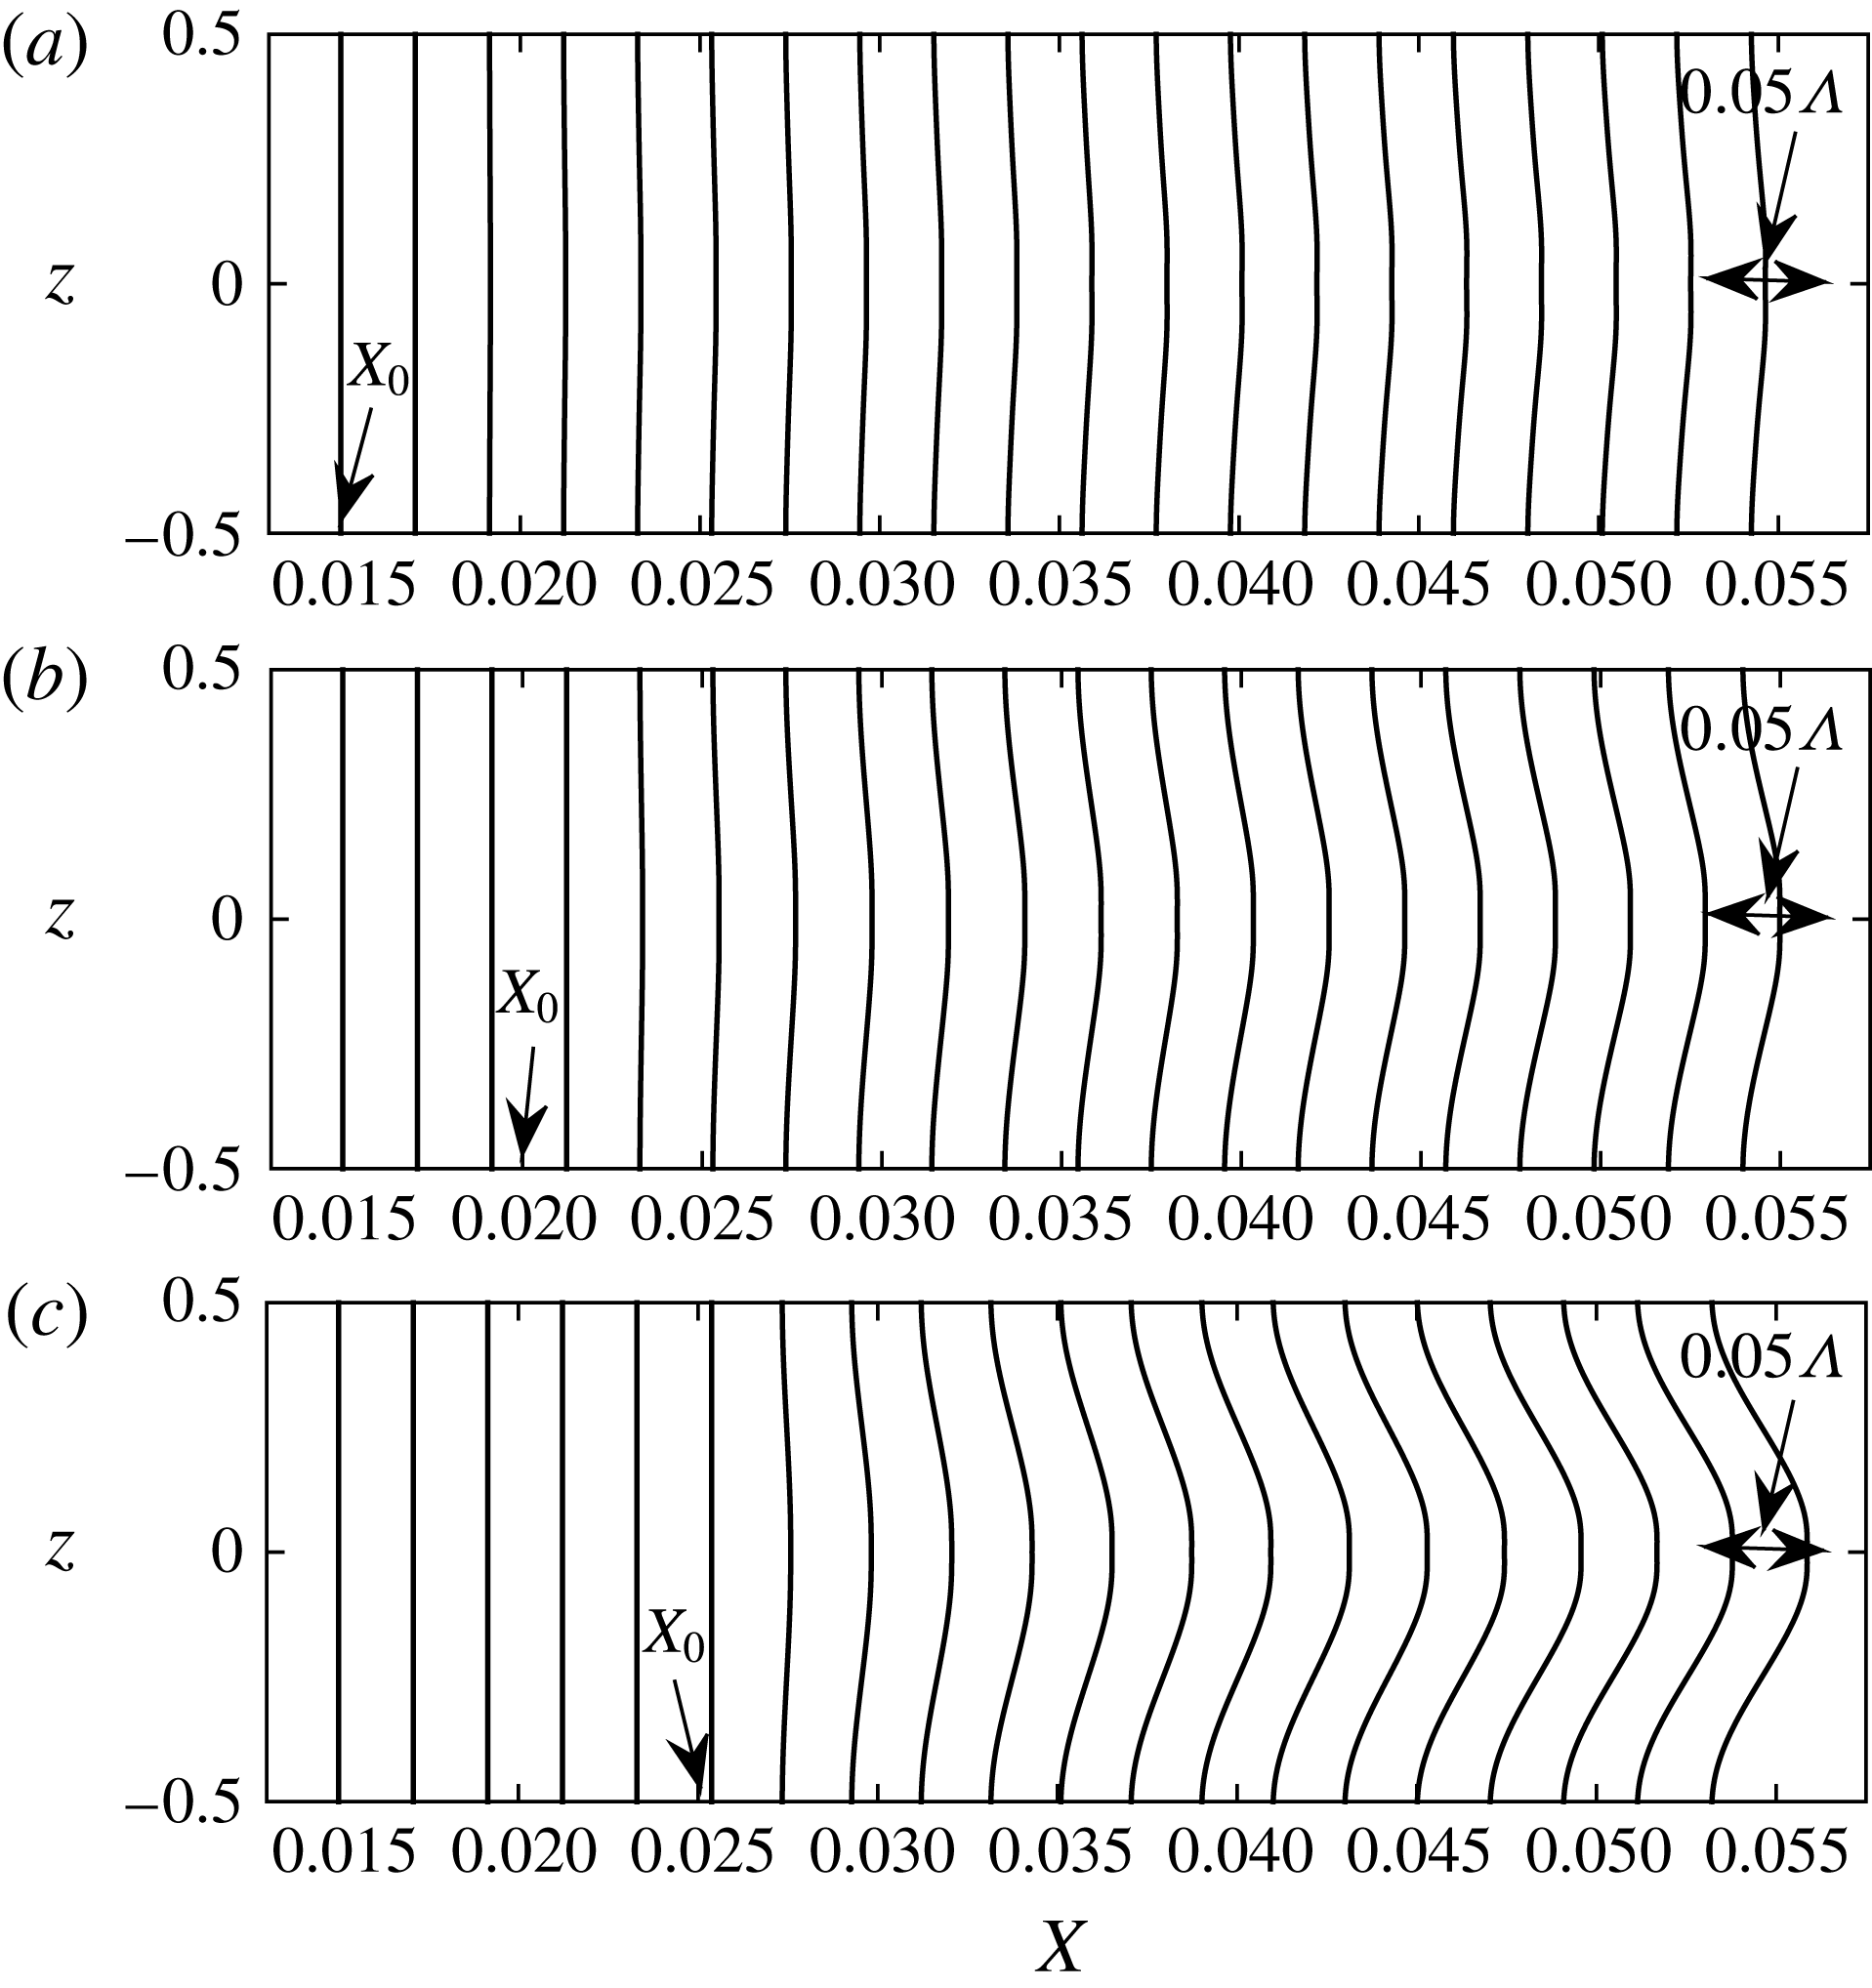
Similar distribution of curves for different values of
 $X_{0}$
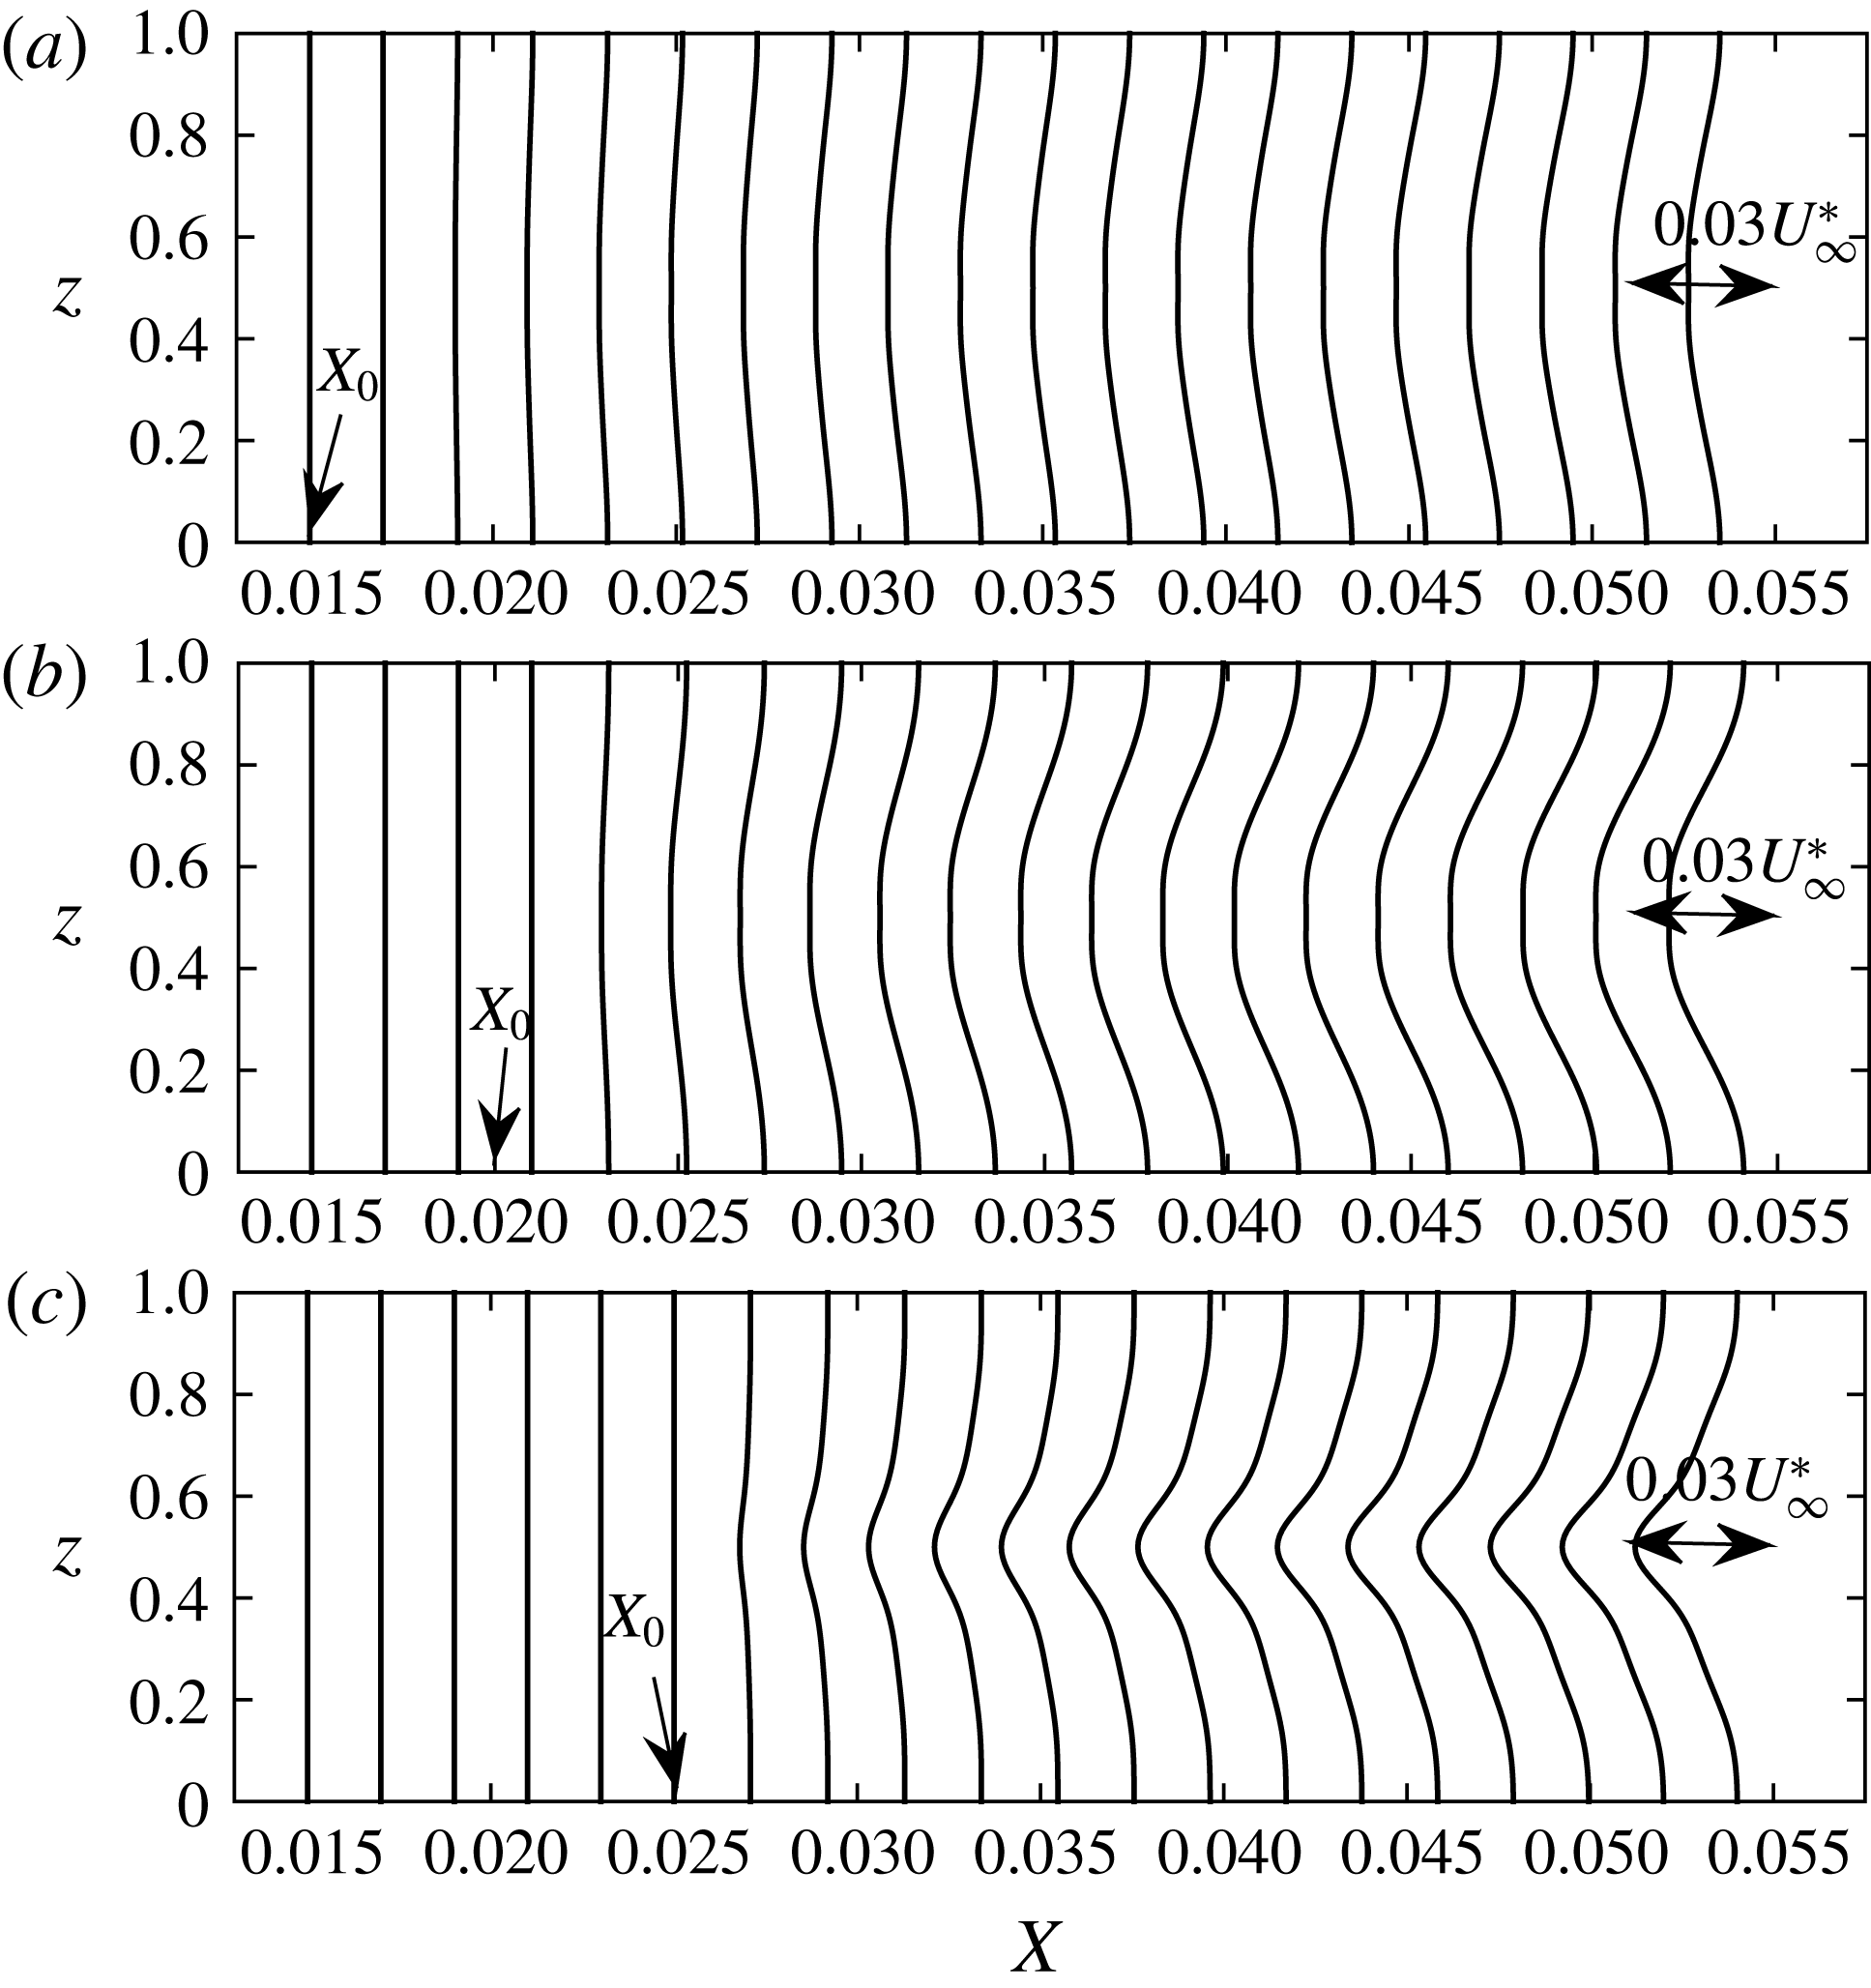
are included in figure 7, except the wall transpiration velocity is plotted along the spanwise direction. As the control initiation location is moved downstream, the magnitude of the transpiration velocity is increased, which is to be expected because the streak strength (defined as the difference between the high speed and the low speed in the streaks) increases in the streamwise direction, demanding more momentum injection or suction from the wall. It will be shown in the next contour plots that moving the initiation location in the downstream is not as effective in reducing the energy of the vortices as the control based on wall deformations. The maximum transpiration velocity attained in the downstream for
 $X_{0}=0.025$
is a small percentage from the free-stream velocity (3 %); it is a much smaller percentage for
 $X_{0}=0.015$
(less than 1 %).
The distribution of transpiration velocity,
 $v_{w}/V_{\infty }$
, at the wall represented by profiles in the spanwise
 $z$
-direction, for the spanwise separation
 $\unicode[STIX]{x1D6EC}^{\ast }=1.2$
cm and different control initiation locations: (a)
 $X_{0}=0.015$
; (b)
 $X_{0}=0.02$
; (c)
 $X_{0}=0.025$
.
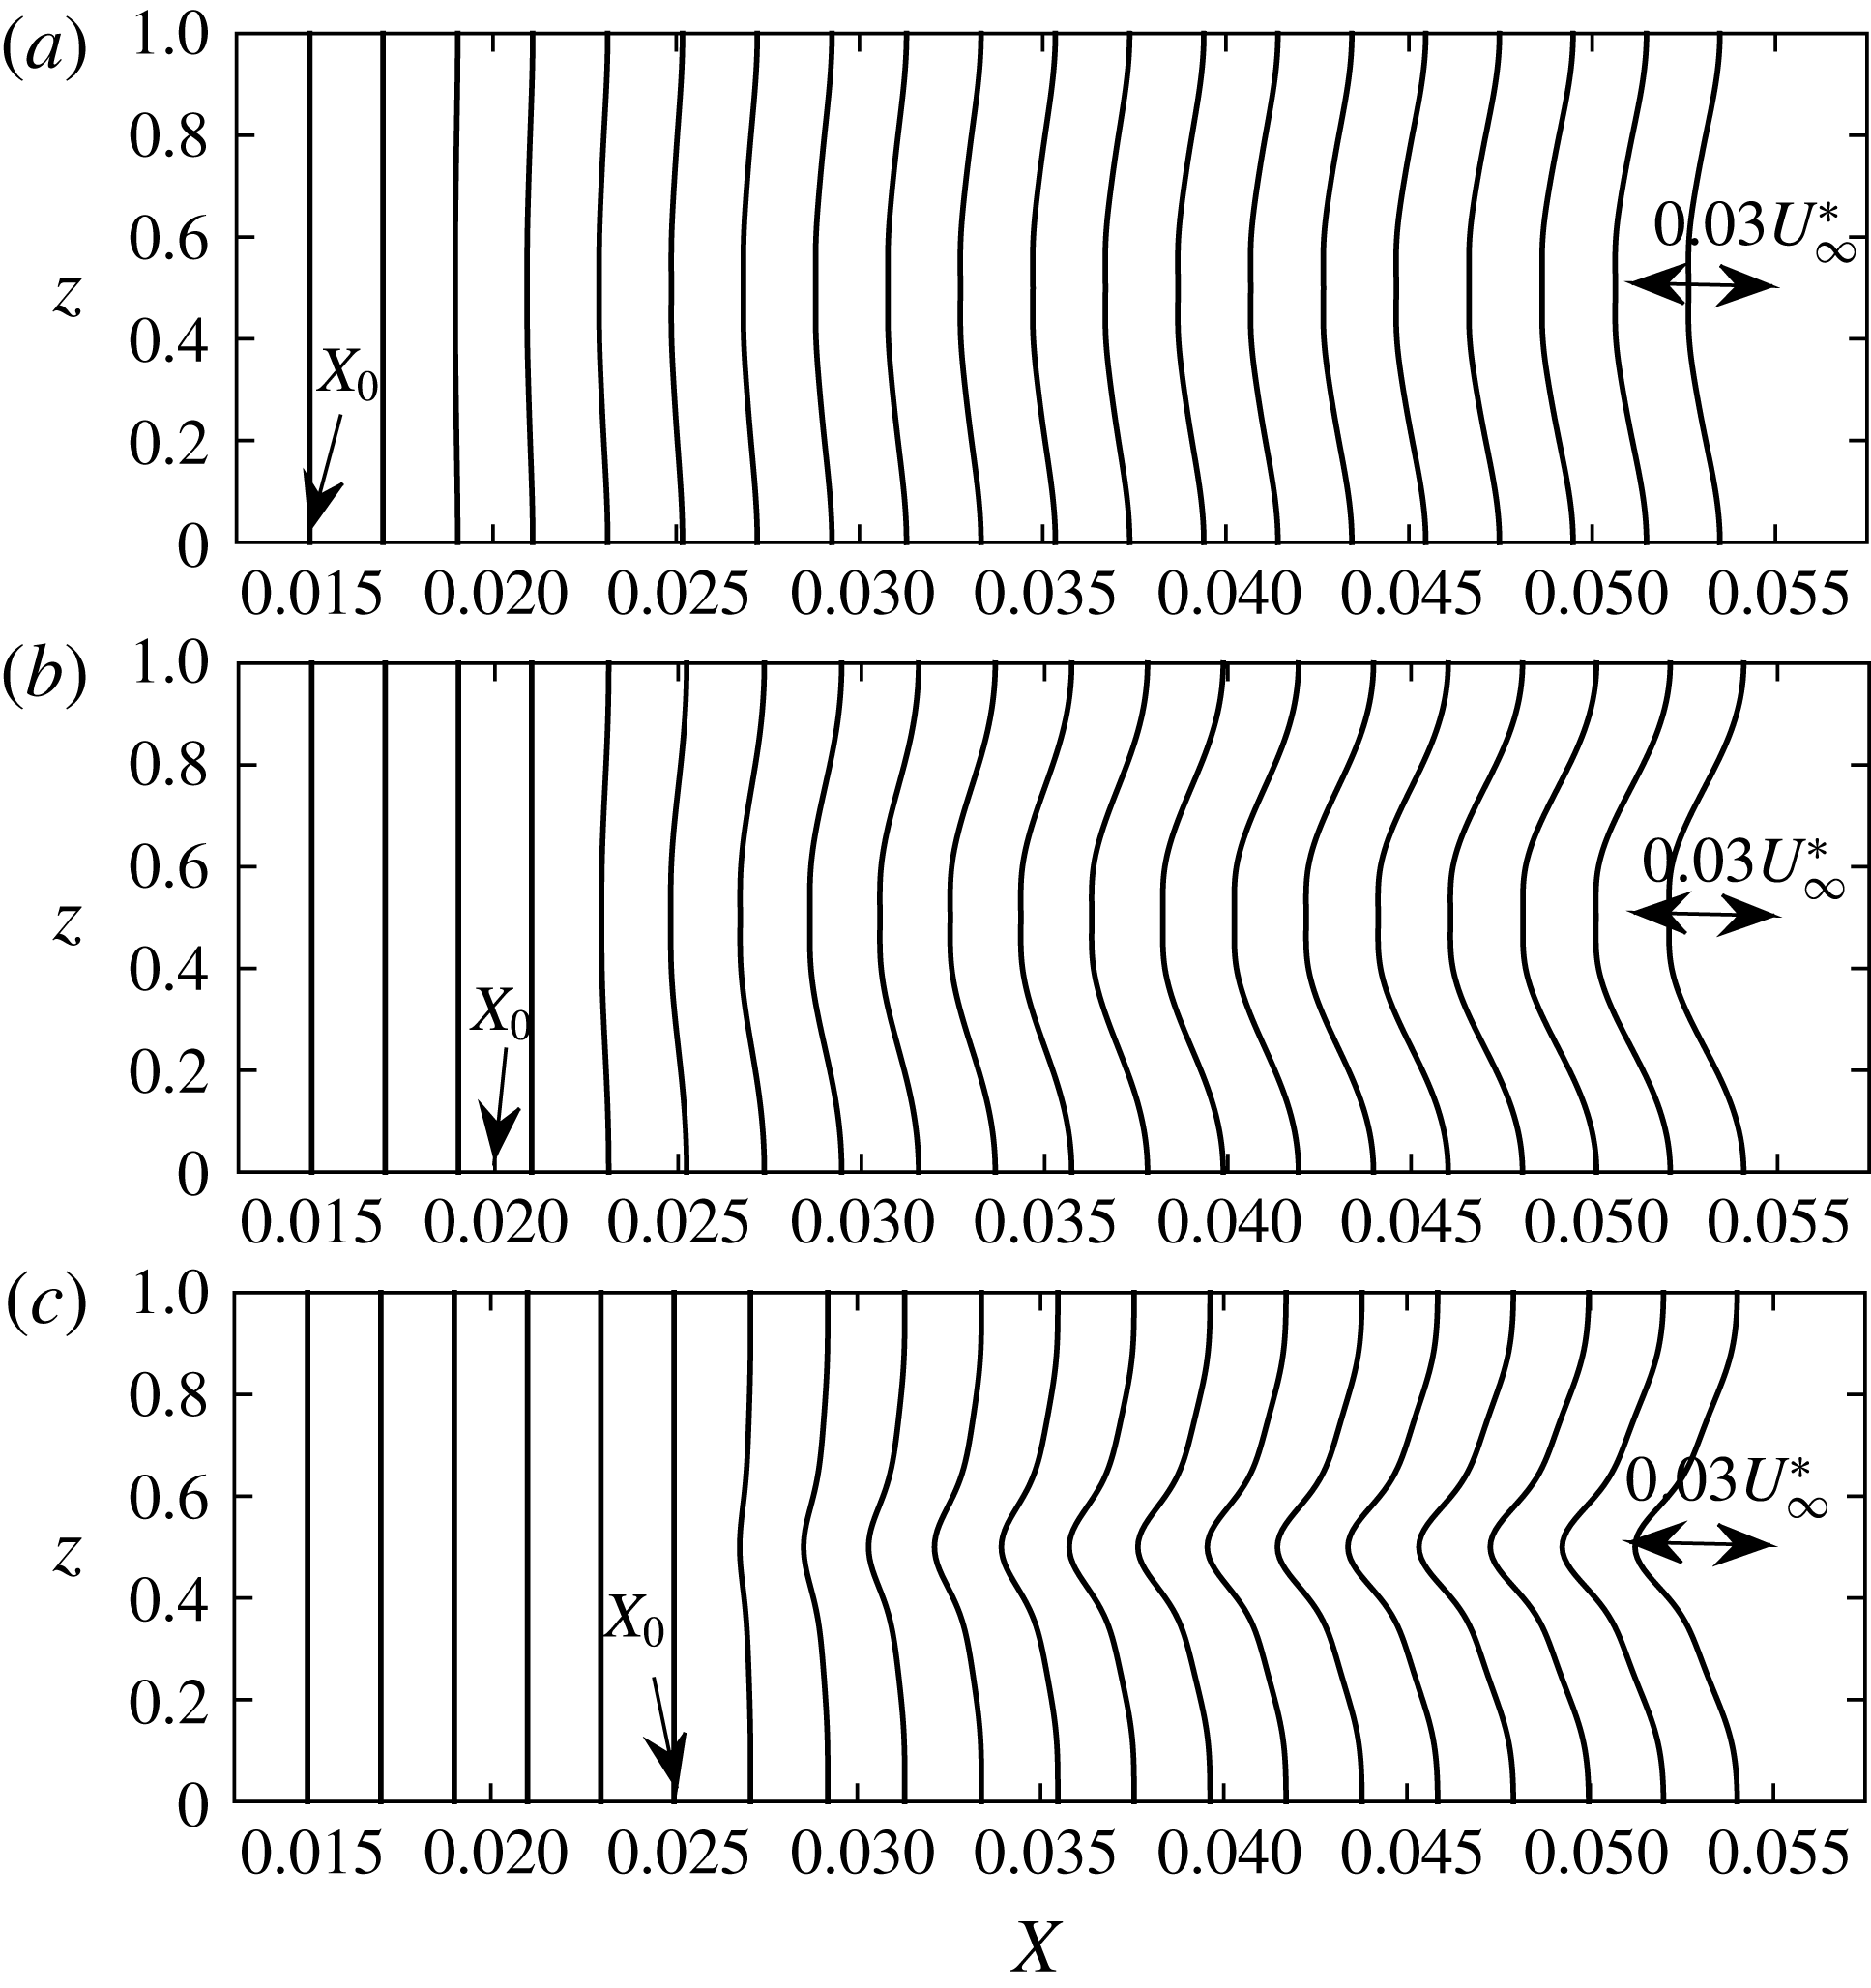
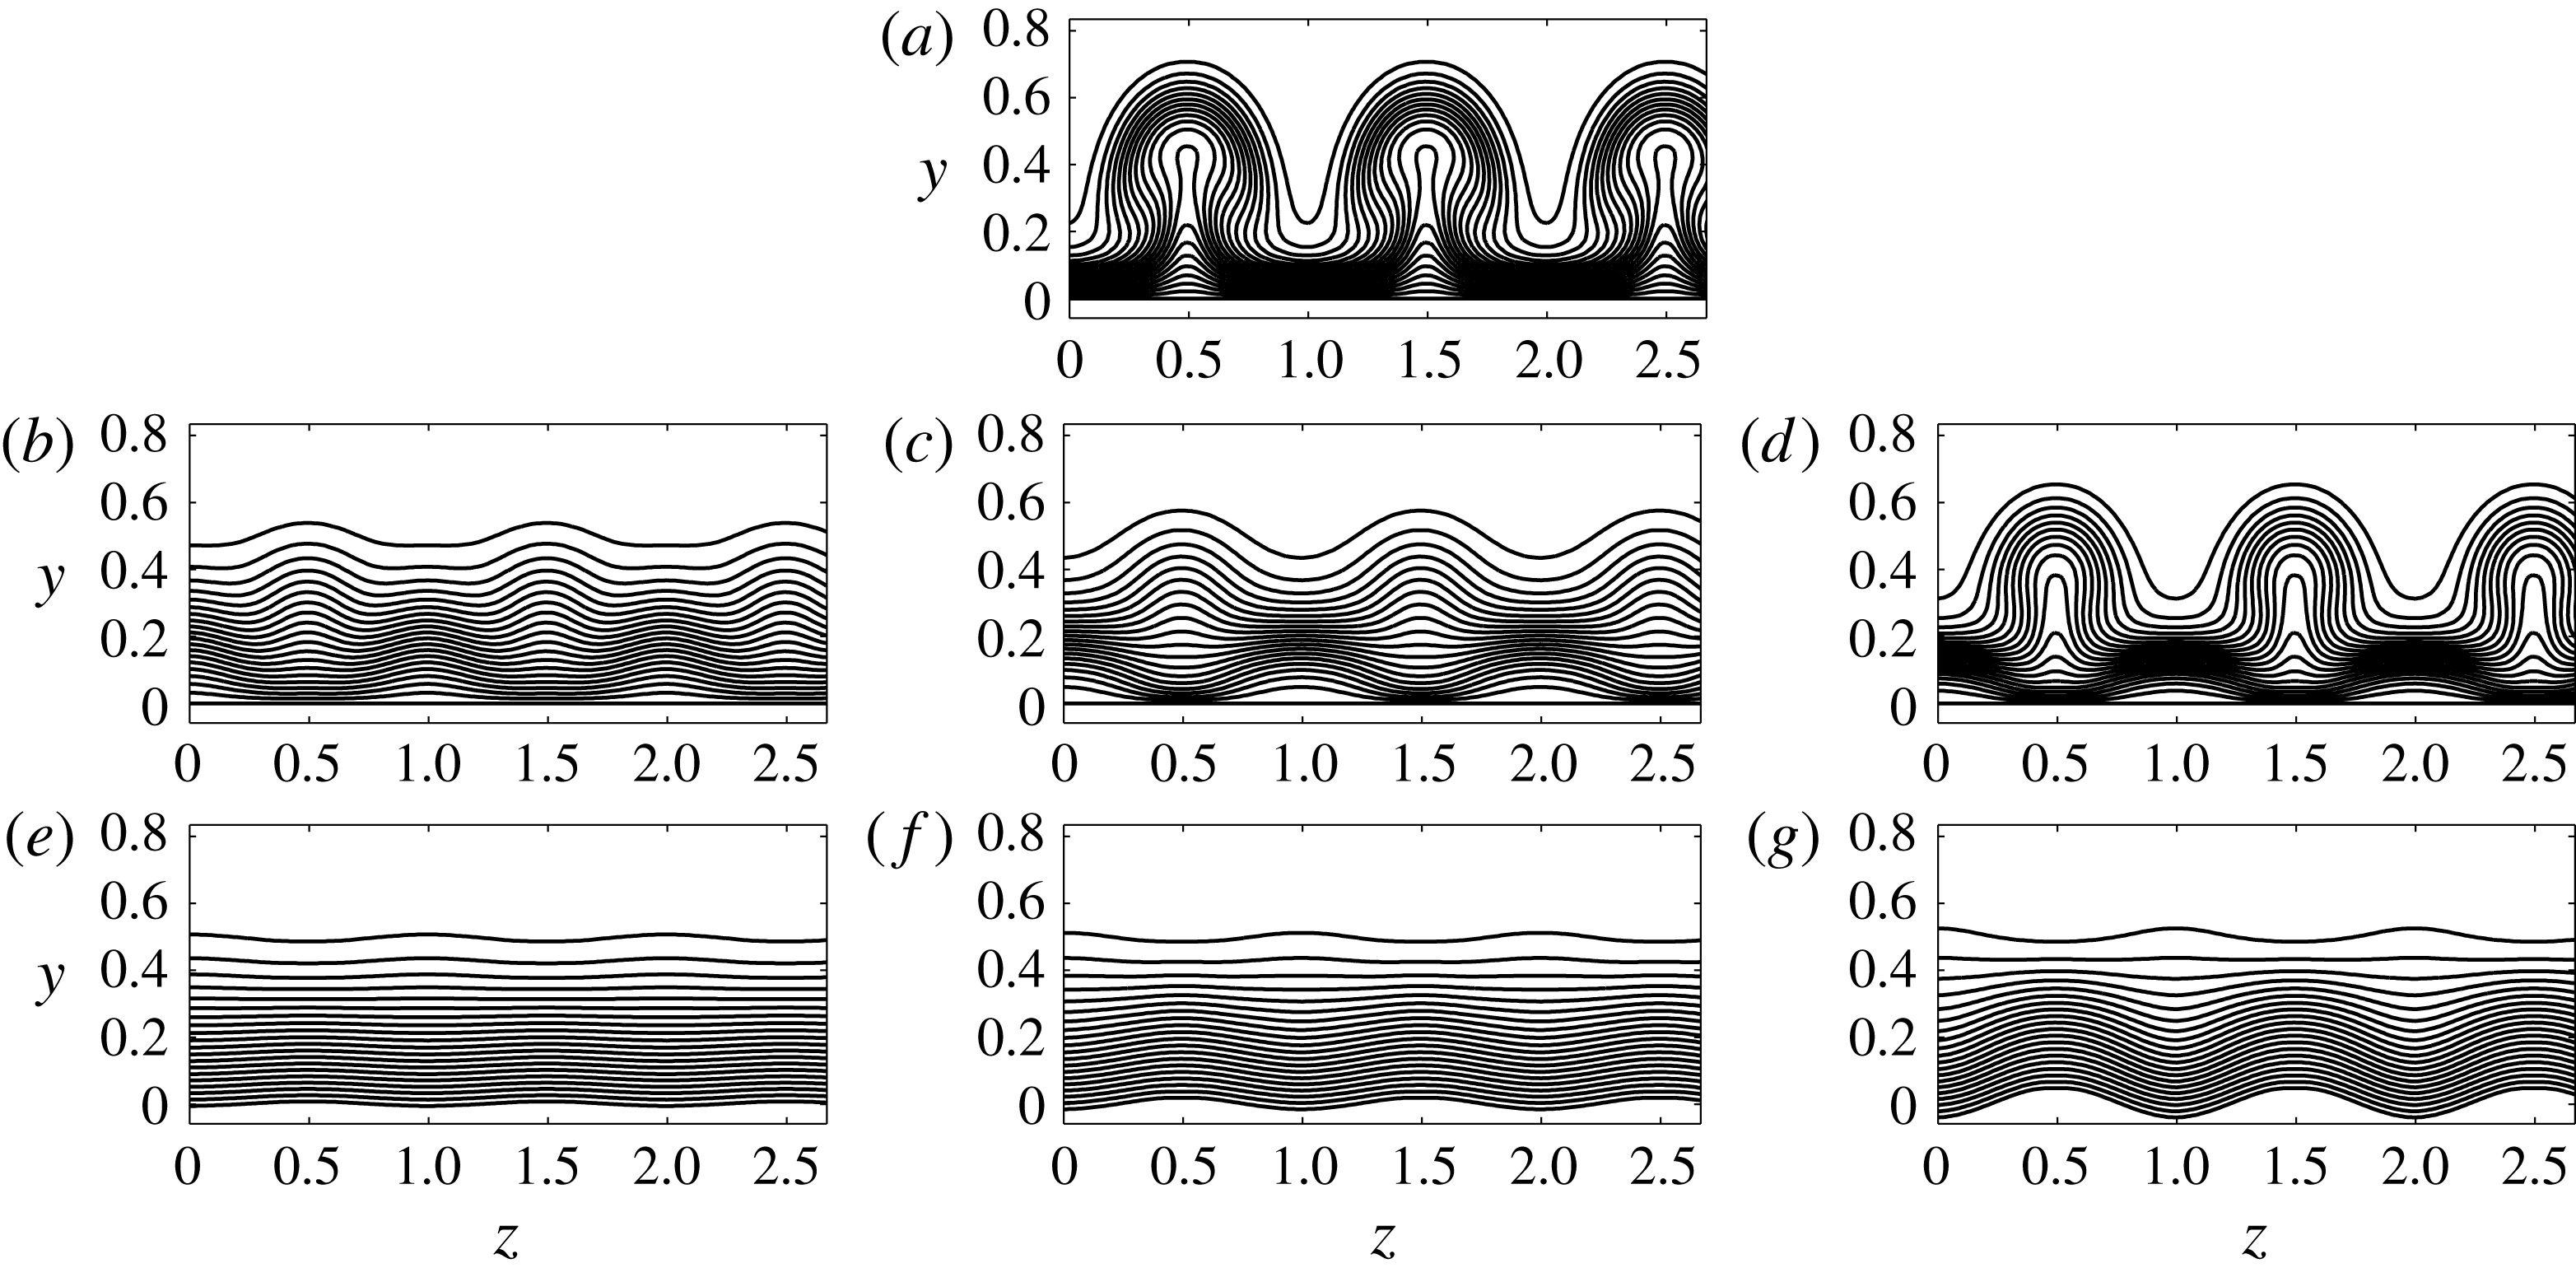
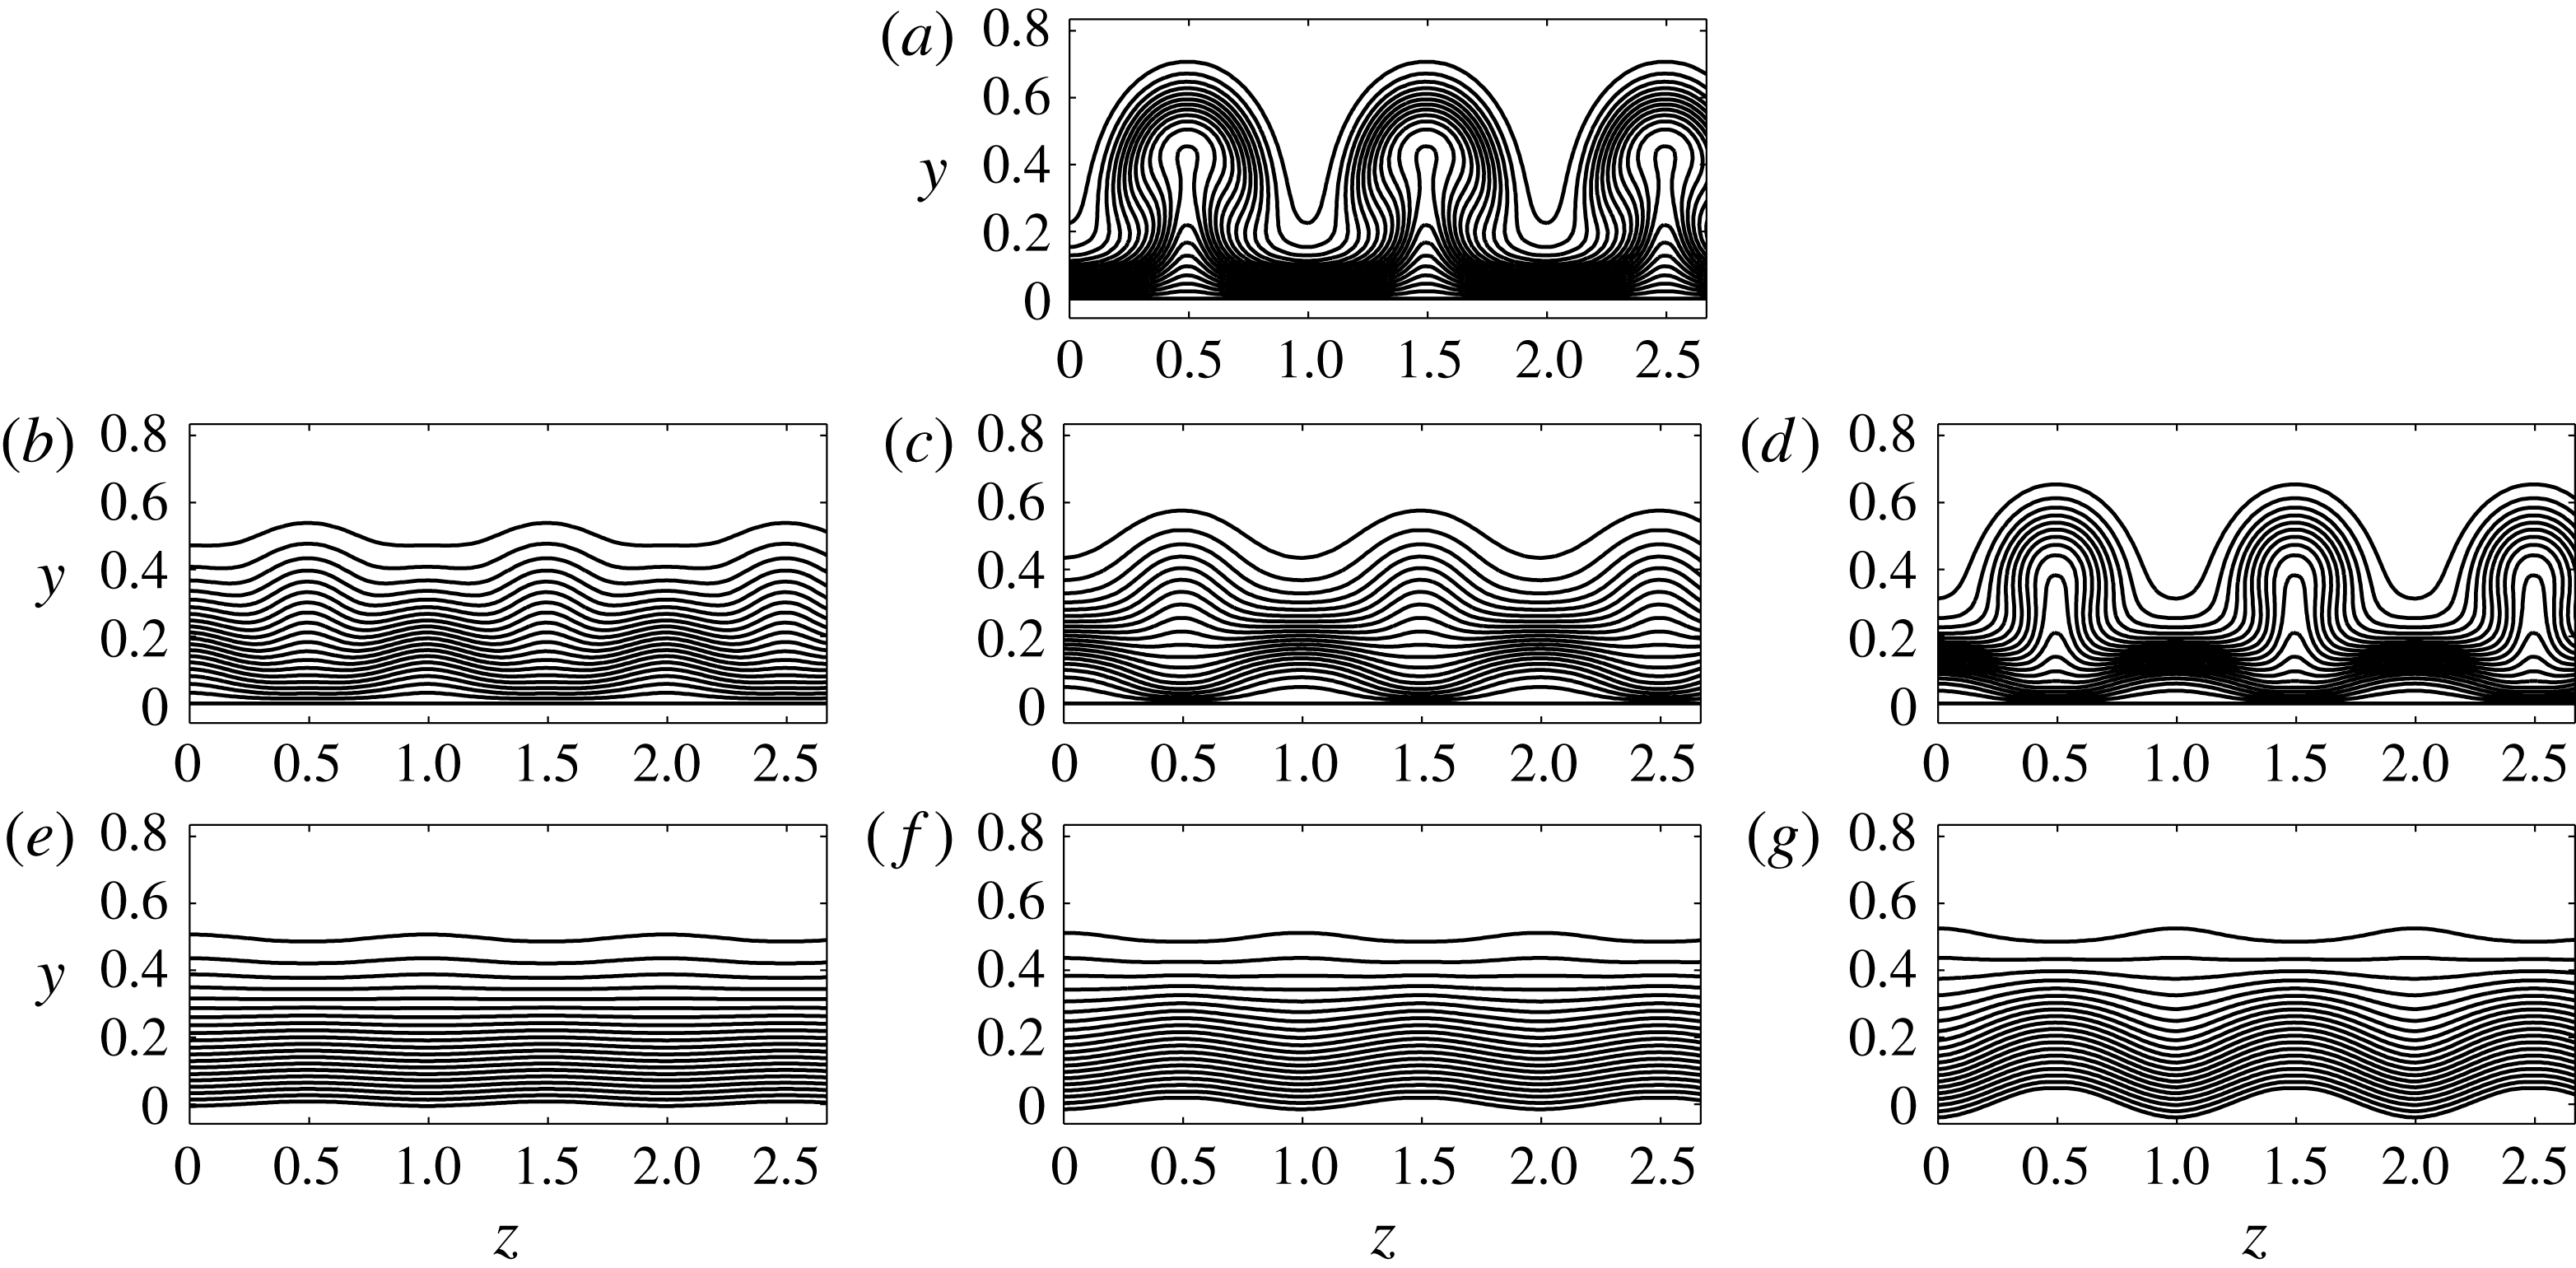
Regions of low and high speed associated with the streak can be visualized by plotting contours of streamwise velocity in sections at the fixed streamwise location
 $X=0.04$
, as shown in figure 8. Görtler vortices developing in the uncontrolled case (figure 8
a) reveal fully developed ‘mushroom‘ shapes with alternating low-speed streaks and high-speed streaks in the spanwise direction. Panels b, c and d of figure 8 correspond to results obtained by applying the control based on wall transpiration, while the right column of plots (panels 8
e, f and g) corresponds to results obtained by applying wall deformations. In the control algorithm based on wall deformations, the wall surface is gradually moved upward at the spanwise location corresponding to the low-speed streak, while at the same time it is moved downward at the spanwise location corresponding to high-speed streaks. This change in the geometry of the wall surface increases or decreases the momentum of the flow, thus reducing the energy associated with the Görtler vortices. The same mechanism is at play when wall transpiration is applied, except that the upward motion of the wall is replaced by blowing and the downward motion by suction. These contours show that the control based on wall deformations is more effective than the control based on wall transpiration, especially at high control initiation location
 $X_{0}=0.025$
. The difference between the results from the two control schemes is qualitatively measured from the contour plots by comparing the level of spanwise variation; for example, by comparing figure 8(b,c) it is noted that there are significant spanwise variations of the contour lines on the left-hand side (corresponding to the control based on wall transpiration), while on the right-hand side the flow appears as a Blasius boundary layer; more quantitative results will be shown in plots of energy and wall shear stress later in the section. Note that previously, it was found that the control based on wall transpiration is more effective than control based on wall deformation in wall turbulence (see, for example, Endo et al.
Reference Endo, Kasagi and Suzuki2000, Kang & Choi Reference Kang and Choi2000). However, the comparison of our results with the control of wall turbulence is largely irrelevant since the physics of the flow is different; moreover, here we target steady Görtler vortices, where the streamwise gradients are neglected, while a turbulent boundary layer is highly unsteady with strong variations of the flow in the streamwise direction. Another reason is that for our problem a parabolic set of equations is solved in a pre-transitional boundary layer, where there is no feedback to the downstream flow, and the variation of the wall deformation with respect to the streamwise direction is rather gentle (versus the variation in the spanwise direction). A thorough discussion of the physical mechanism and interpretations behind both types of control algorithms is presented later in § 5.
Streamwise velocity contours for spanwise separation
 $\unicode[STIX]{x1D6EC}^{\ast }=1.2$
cm, at the streamwise location
 $X=0.04$
: (a) no control; (b) control based on wall transpiration,
 $X_{0}=0.015$
; (c) control based on wall transpiration,
 $X_{0}=0.02$
; (d) control based on wall transpiration,
 $X_{0}=0.025$
; (e) control based on wall deformation,
 $X_{0}=0.015$
; (f) control based on wall deformation,
 $X_{0}=0.02$
; (g) control based on wall deformation,
 $X_{0}=0.025$
. The contour lines range from 0 at the wall to 1 in the external flow, with an increment of 0.05.
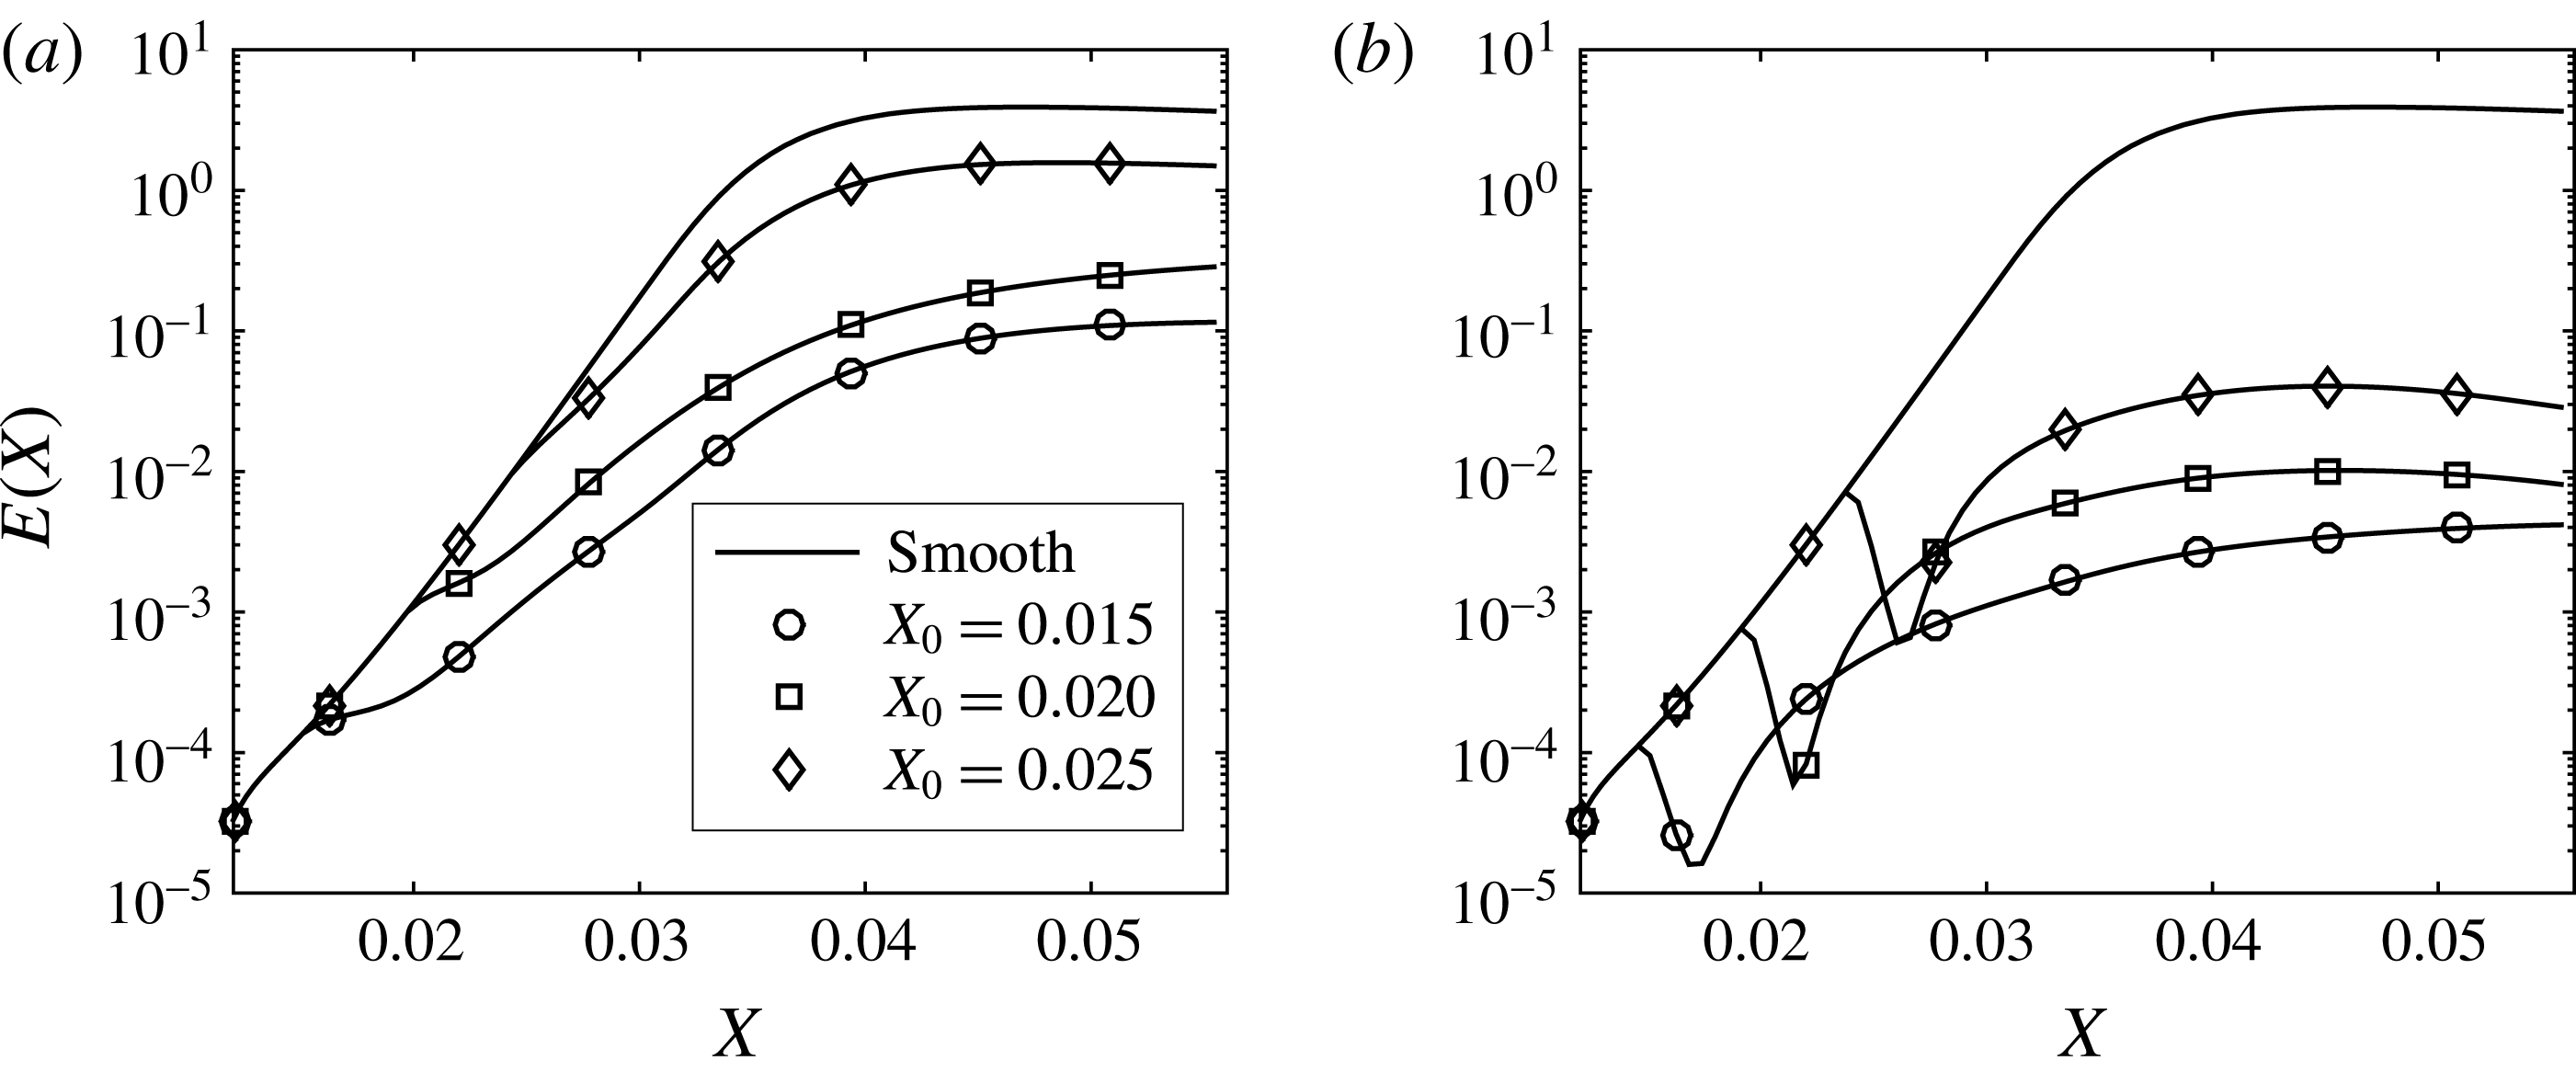
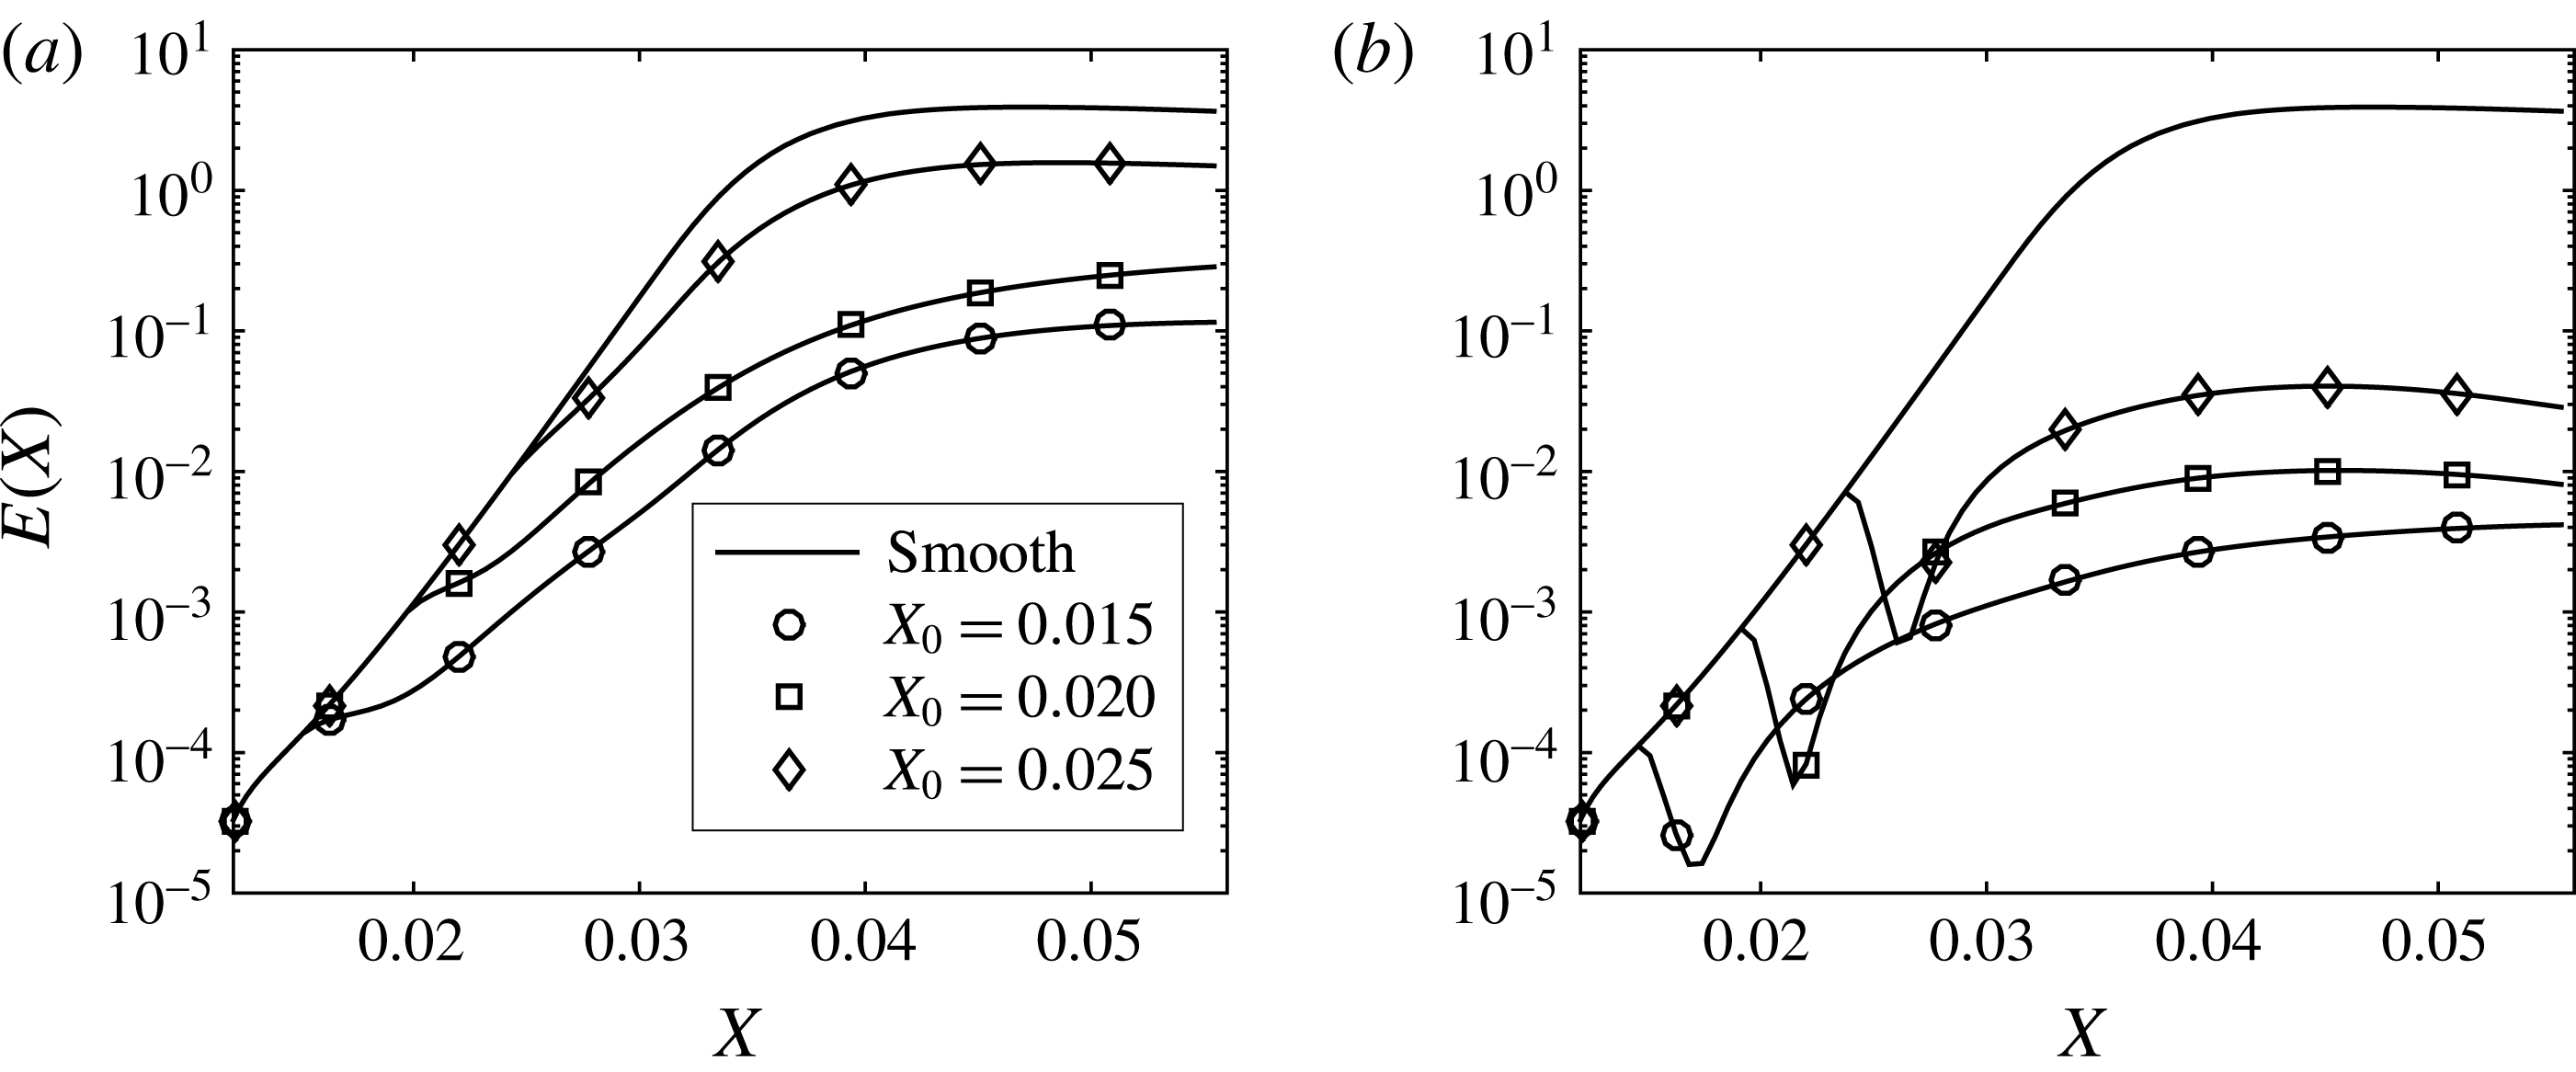
In figure 9, we compare the kinetic energy associated with the Görtler vortex for the three control cases to the energy calculated in the uncontrolled case. The energy is significantly reduced by the control based on wall deformation; for the smallest
 $X_{0}$
location, an approximately three orders of magnitude reduction is observed. The energy reduction in the case of wall transpiration is not as high as in the previous case, but it is considerable at least for the largest
 $X_{0}$
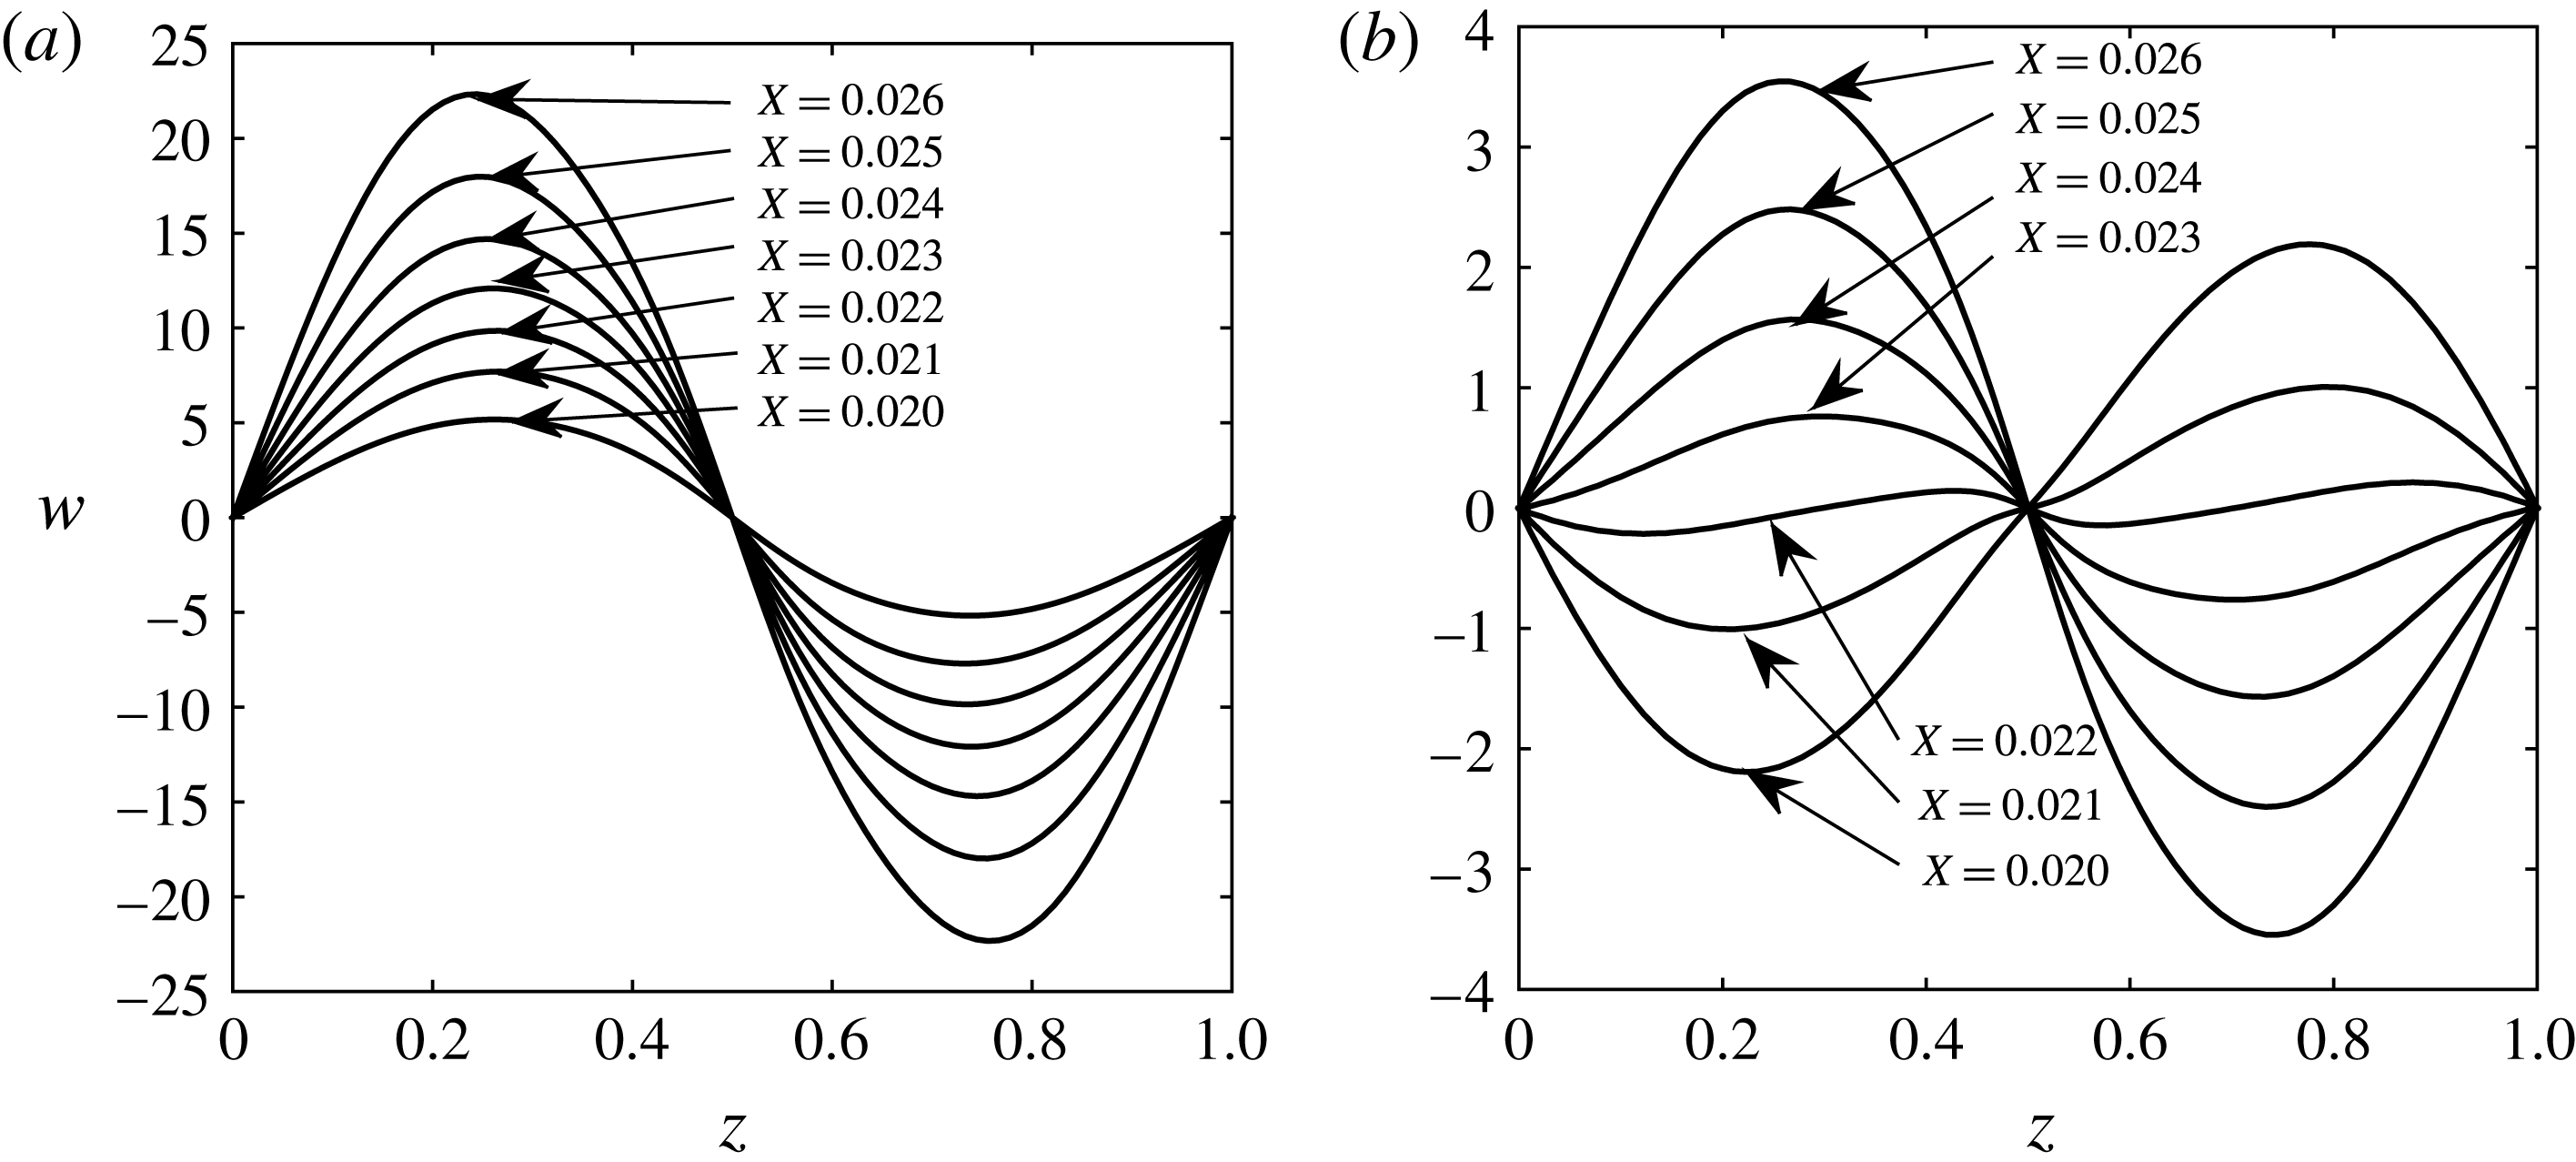
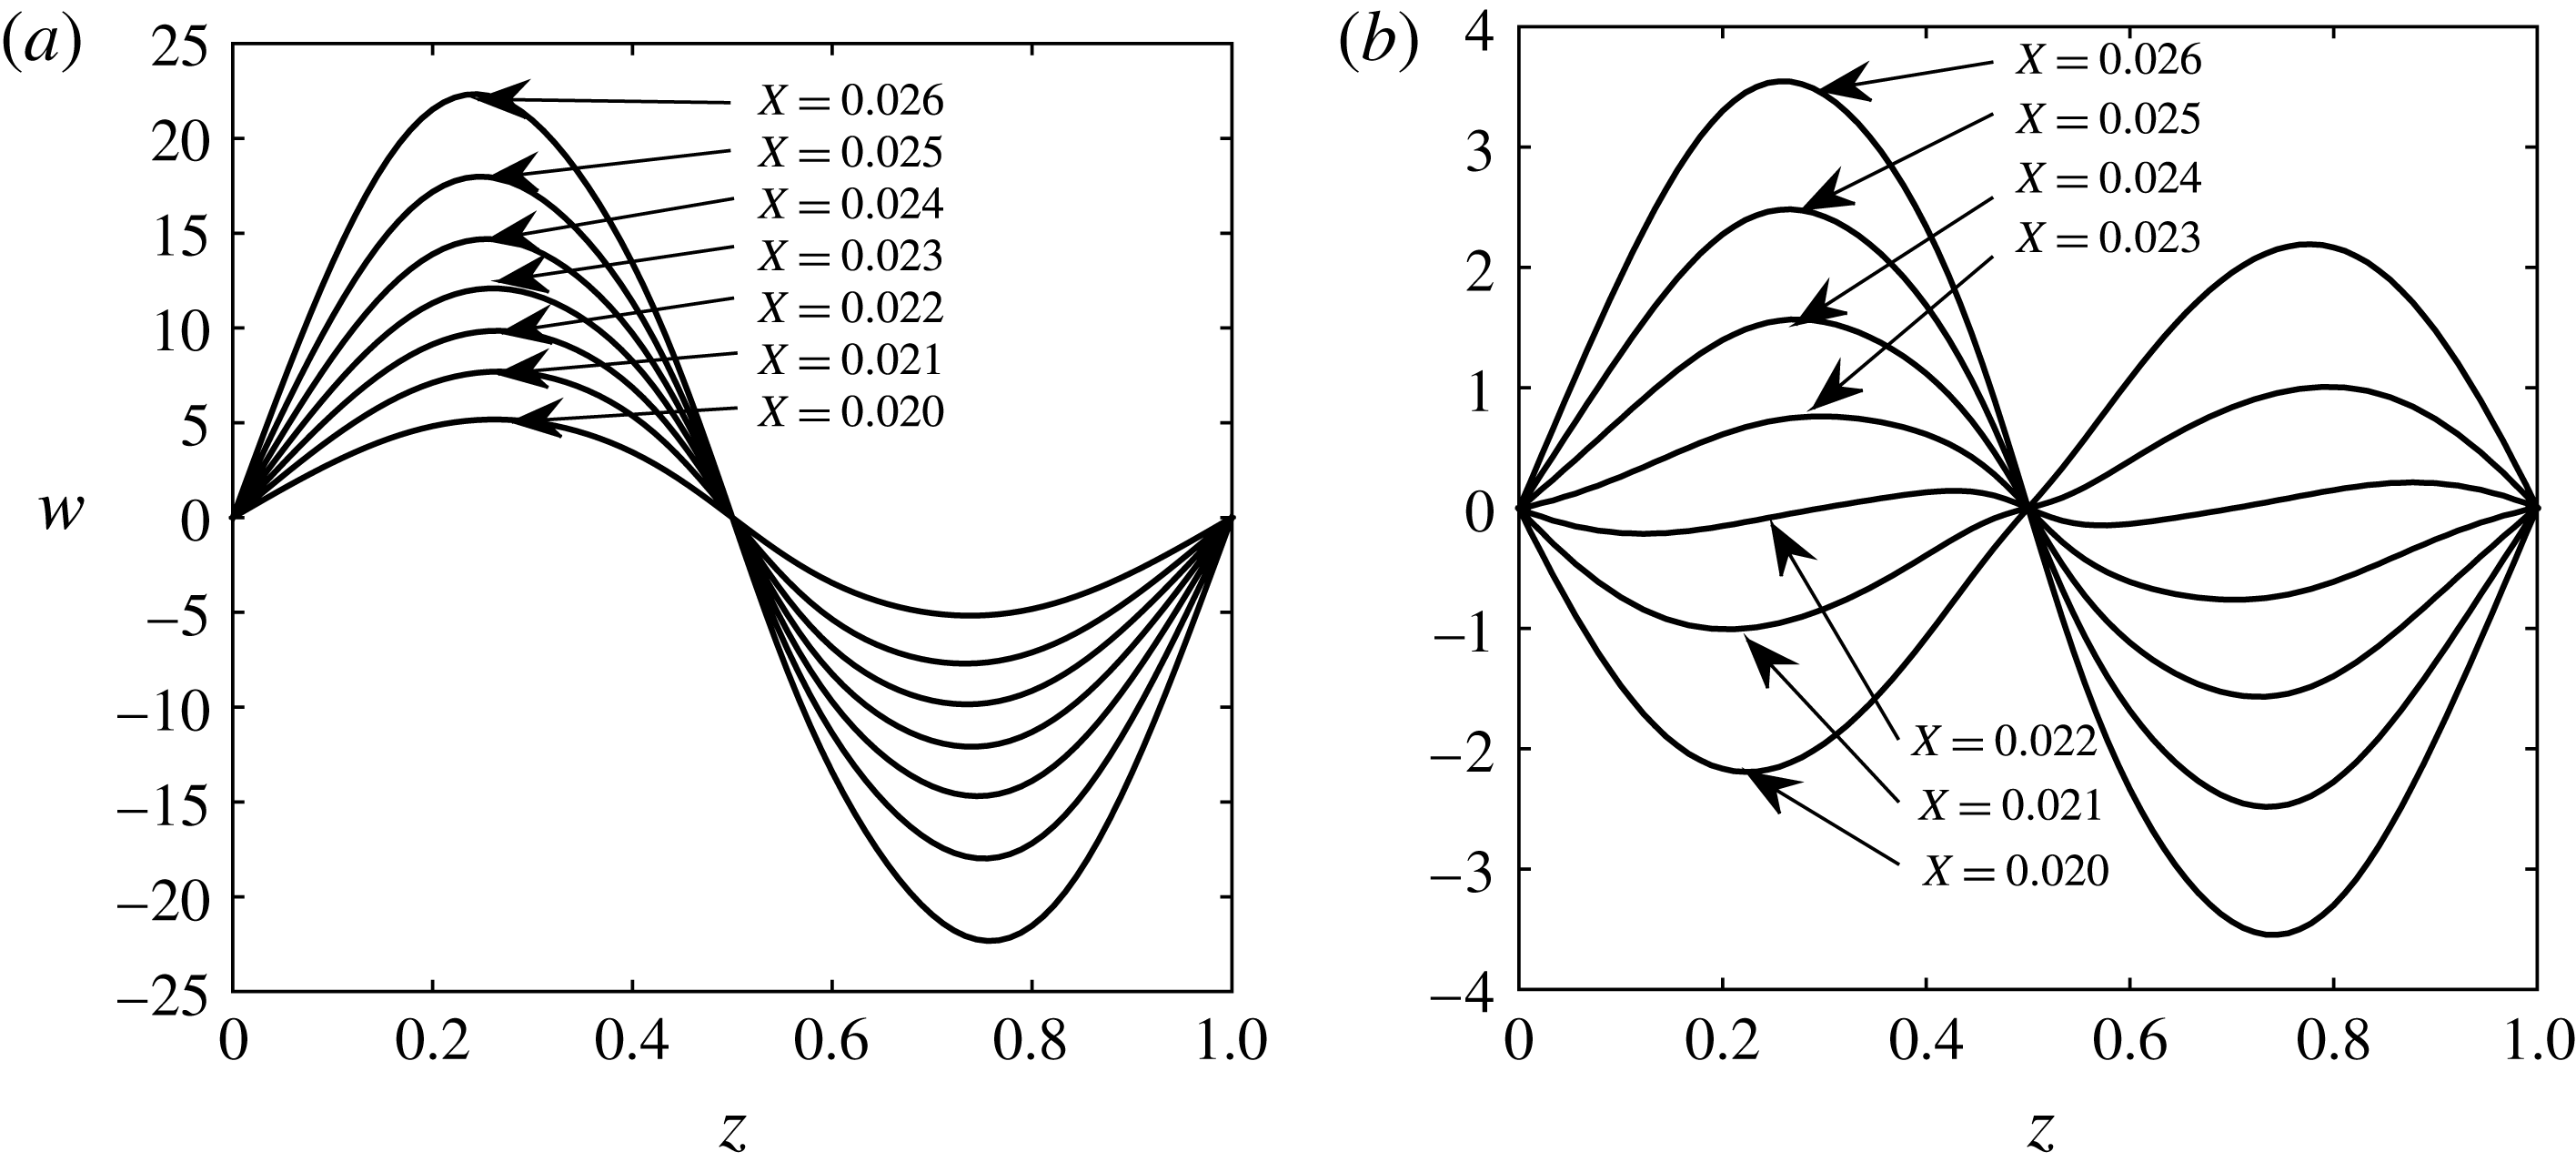
(almost two orders of magnitude). In figure 9(b), sharp minima in all energy curves associated with the controlled cases exist. These minima correspond to the streamwise location where the low- and high-speed regions switch spanwise locations, and also to the initiation point for the transient energy growth. To further rationalize this behaviour, in figure 10 we plot distributions of the spanwise velocity component,
 $w$
, as a function of
 $z$
for several streamwise locations (some upstream and some downstream of the energy minima locations) at
 $Y=0.07$
from the wall (at the point where
 $w$
has a maximum in the wall-normal direction). These plots correspond to the energy curve with square symbols in figure 9 (
 $X_{0}=0.020$
), for which the energy minimum occurs at approximately
 $X=0.022$
. The left-hand figure corresponds to the control based on wall transpiration. We see here that both the positive and negative regions of
 $w$
are monotonically increasing (in the absolute value). For the control based on wall deformation on the right-hand side on the other hand, there is a sign switch in both positive and negative regions. Since the curve corresponding to
 $X=0.022$
is the closest to the
 $w=0$
line, plots in figure 10 indicate that the streamwise location where the energy minimum occurs in figure 9 corresponds to vortices that experience region switching.
Energy as a function of the streamwise direction for
 $\unicode[STIX]{x1D6EC}^{\ast }=1.2$
cm: (a) control based on wall transpiration; (b) control based on wall deformations.
Spanwise velocity component,
 $w$
, as a function of
 $z$
for several streamwise locations: (a) control based on wall transpiration; (b) control based on wall deformation (
 $\unicode[STIX]{x1D6EC}^{\ast }=1.2$
cm).
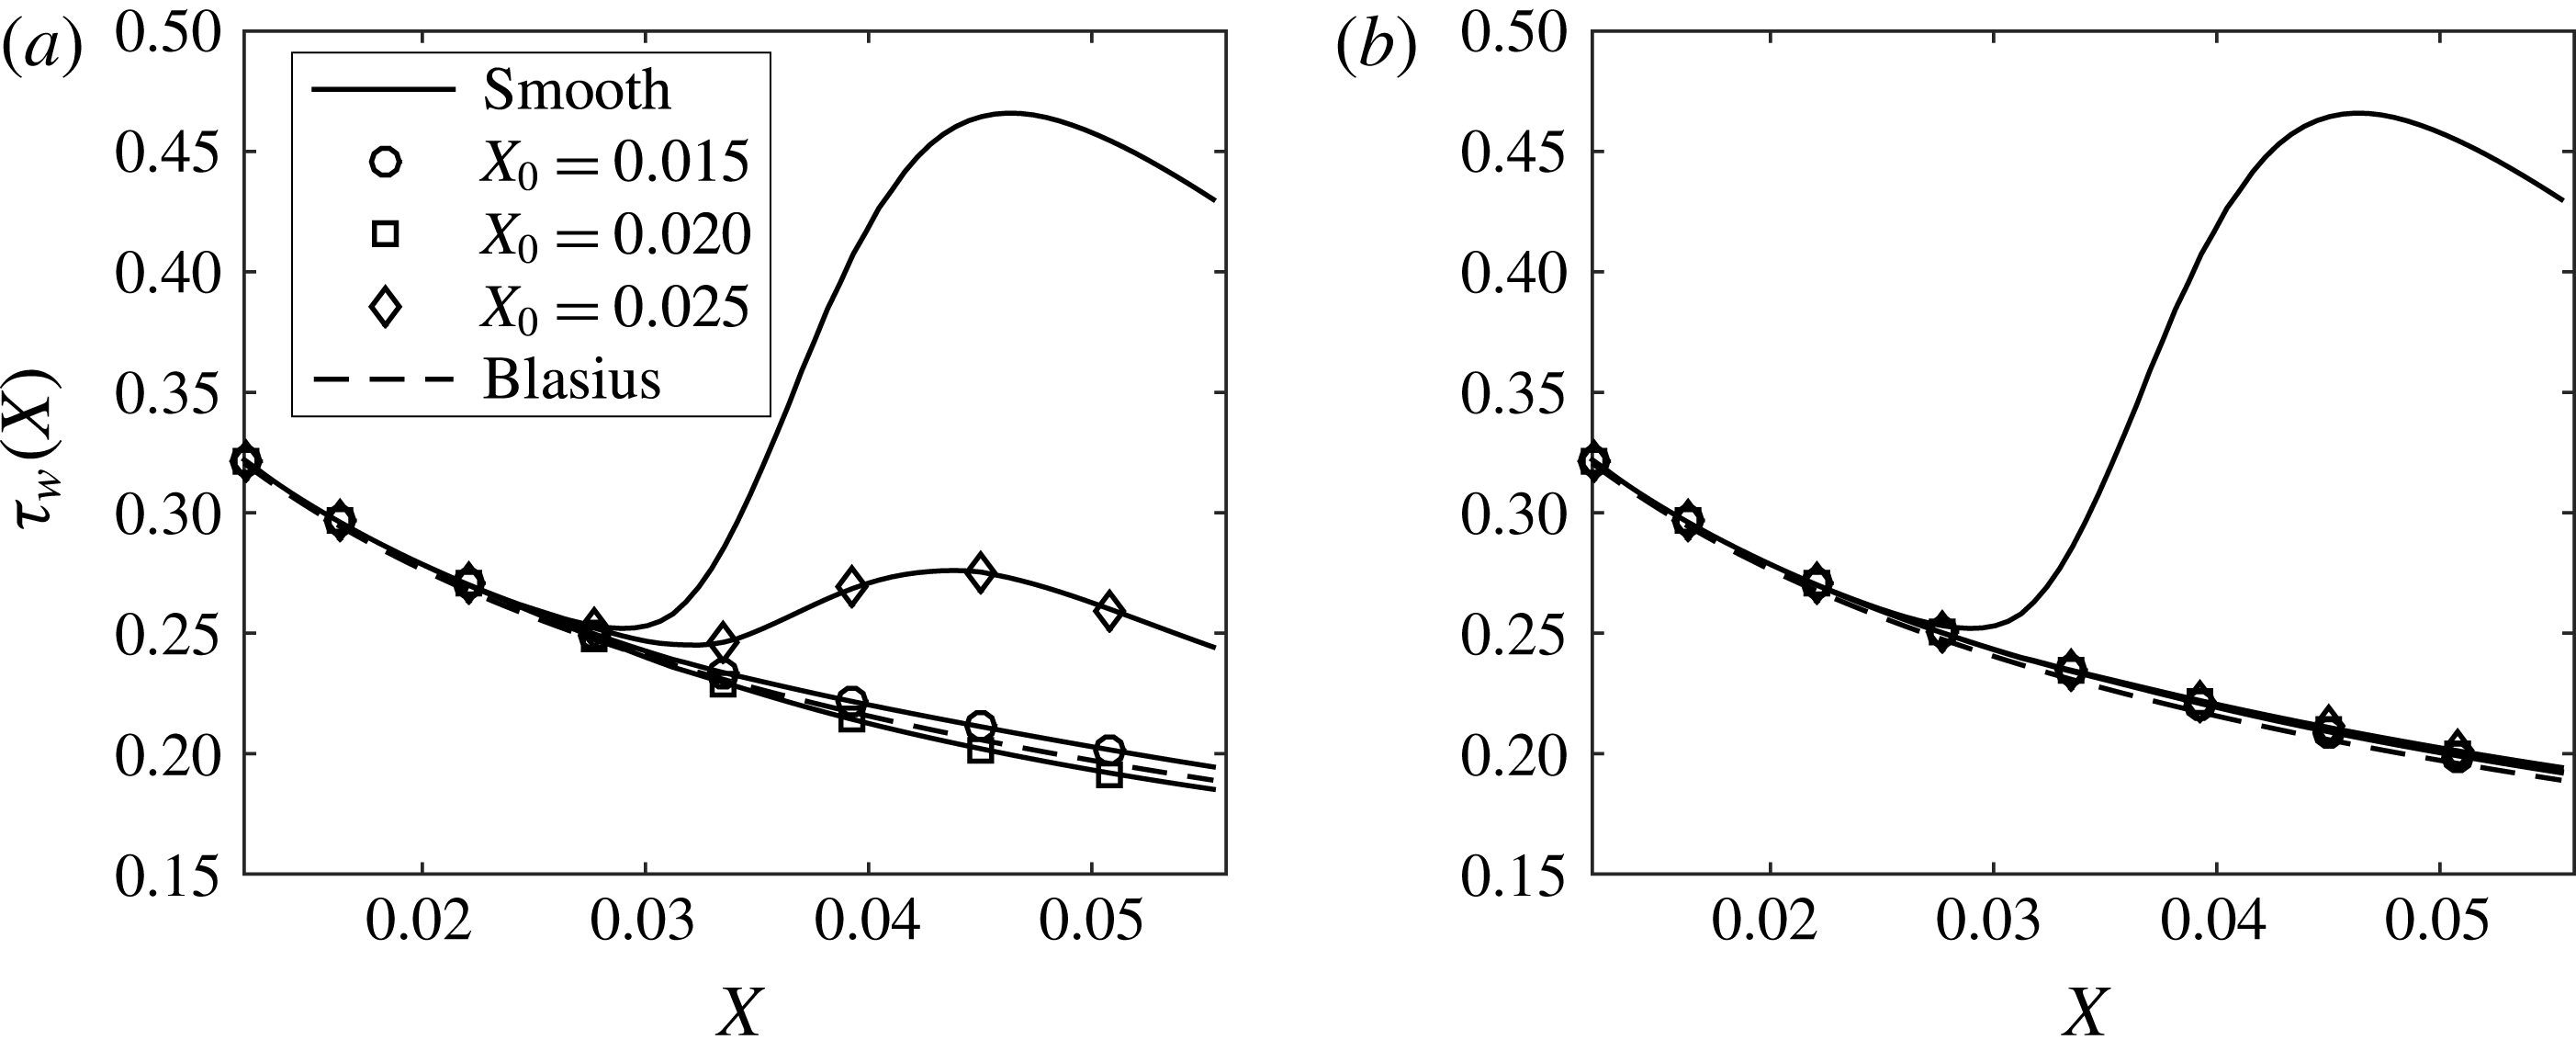
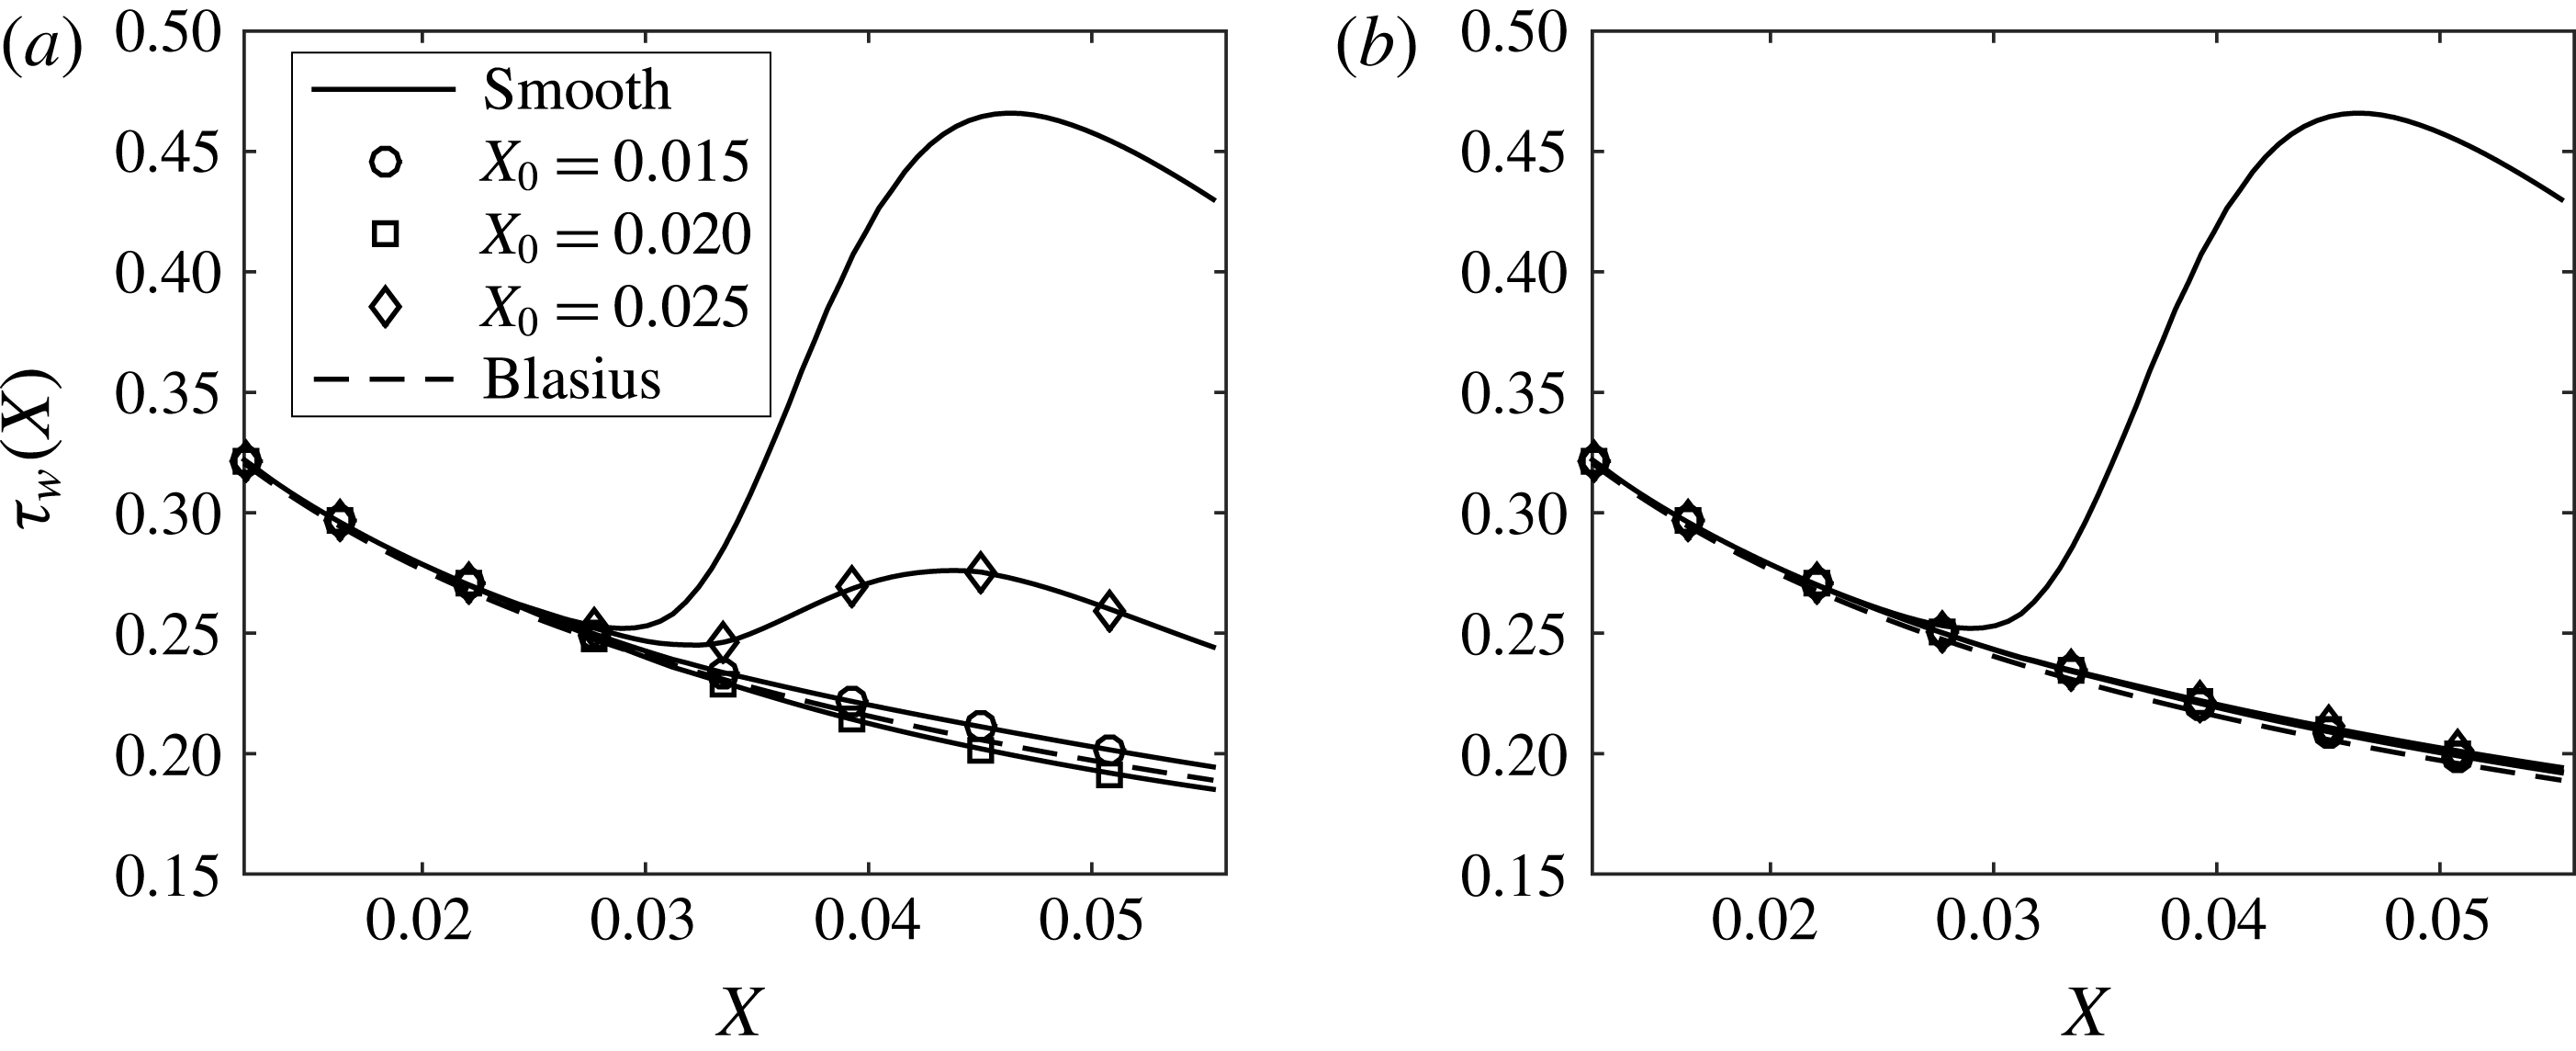
As a means to quantify the effect of control algorithms on the frictional drag, in figure 11 we plot the spanwise averaged wall shear stress for all cases, including the curve corresponding to the Blasius solution (i.e. no Görtler vortices, and no control). First, it appears that there is a significant increase in the shear stress from approximately
 $X=0.032$
, for Görtler vortices in the uncontrolled case, which translates into an increase in the skin friction drag. It is obvious that the shear stress is significantly reduced by the application of either control scheme, with wall deformations being more effective; this confirms our previous results in figures 4, 5 and 8. The shear stress curves corresponding to the control based on wall deformations (figure 11
b) are all remarkably close to the Blasius curve.
Spanwise averaged wall shear stress as a function of the streamwise direction for
 $\unicode[STIX]{x1D6EC}^{\ast }=1.2$
cm: (a) control based on wall transpiration; (b) control based on wall deformations.
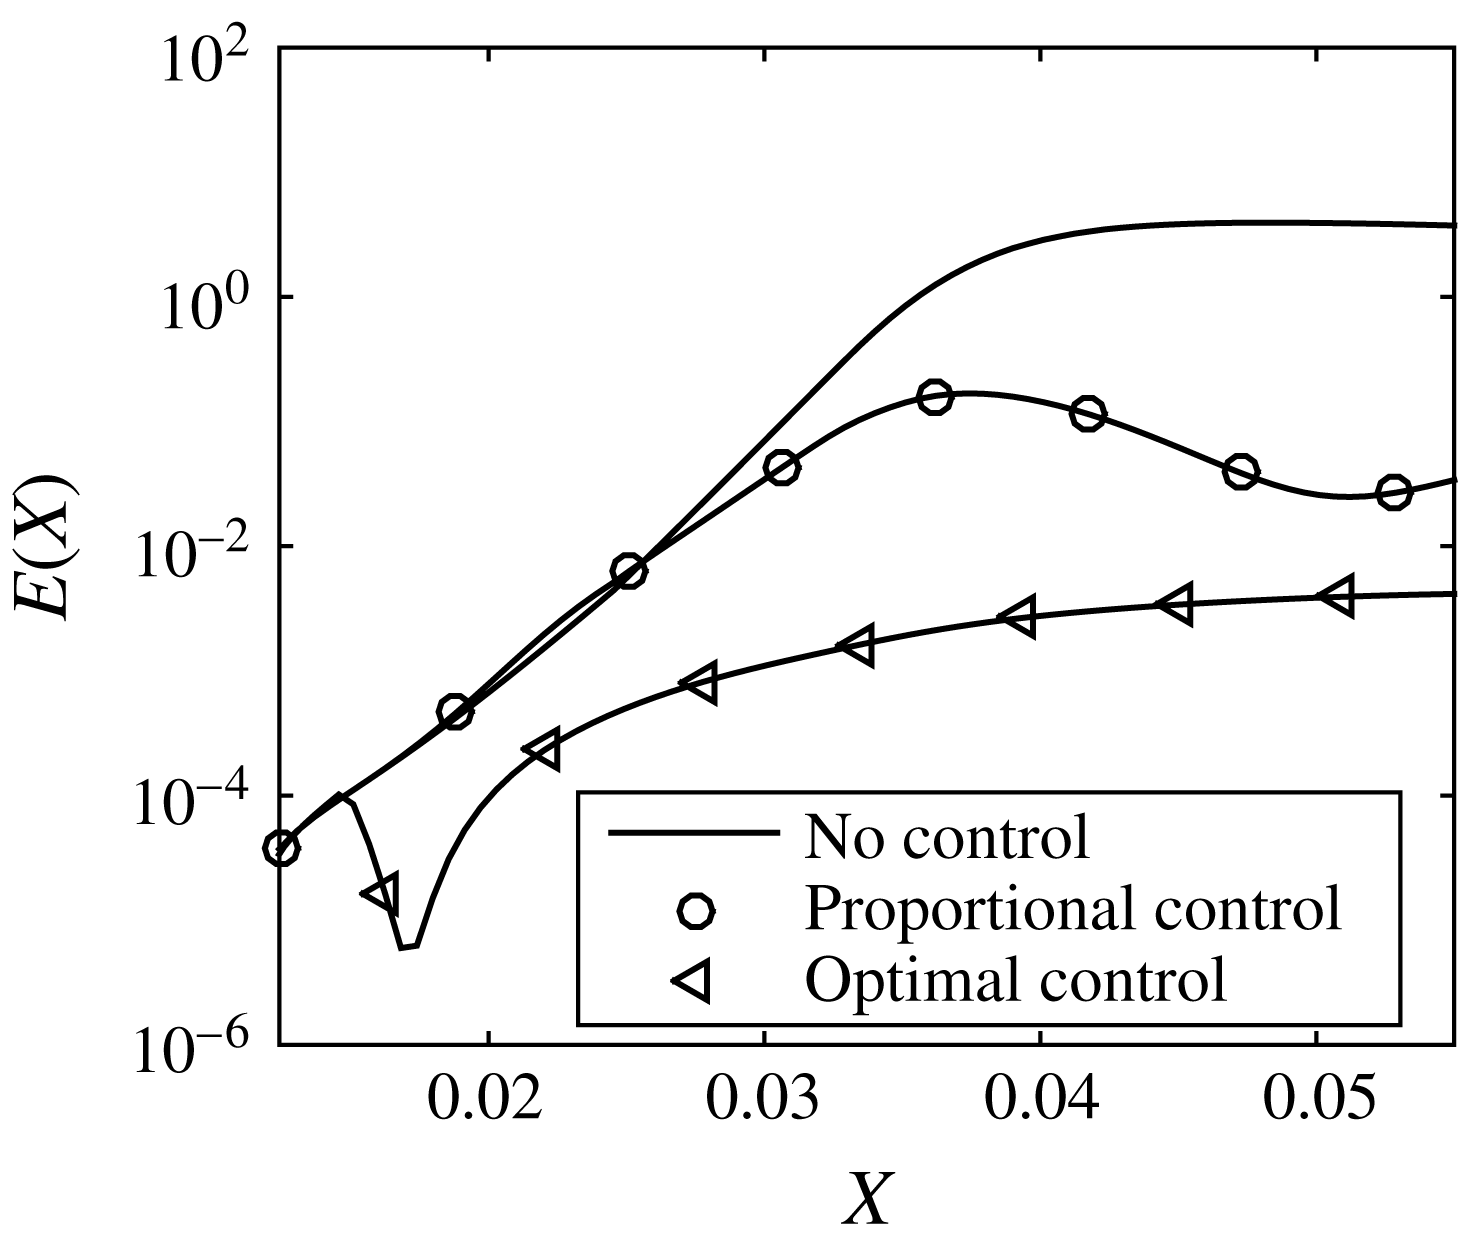
It is interesting to compare the energy plot obtained from the proportional control scheme that was applied in Sescu et al. (Reference Sescu, Taoudi and Afsar2017) with the present energy result, for the same spanwise separation of
 $\unicode[STIX]{x1D6EC}^{\ast }=1.2$
cm. This is accomplished in figure 12, which shows that the energy reduction corresponding to the optimal control is much more significant than the energy reduction corresponding to the proportional controller. This is not at all surprising, however, since the latter is based on a formulation in which the energy reduction would always be sub-optimal.
Comparison of energy plot from Sescu et al. (Reference Sescu, Taoudi and Afsar2017) with the present result, for the same spanwise separation
 $\unicode[STIX]{x1D6EC}^{\ast }=1.2$
cm.

4.3 Sensitivity to the roughness spanwise separation and diameter
In this section, results from three different spanwise separations,
 $\unicode[STIX]{x1D6EC}^{\ast }=0.8$
, 1.2 and 1.6 cm (where the roughness diameter is fixed at
 $D=0.6$
), and three different roughness diameters,
 $D=0.4$
, 0.7 and 1.0 (where the roughness spanwise separation is fixed at
 $\unicode[STIX]{x1D6EC}^{\ast }=1.2$
), are compared to each other. Based on the results from the previous subsection, the control initiation location
 $X_{0}=0.015$
has been chosen since this provided the best results in terms of both energy and shear stress distributions. Streamwise velocity component contours in the cross-plane at
 $X=0.04$
are shown in figures 13–15 for the uncontrolled and controlled vortices. Different levels of reductions in the streak amplitude are revealed by these contour plots: for the control based on wall deformations the variations in the spanwise direction are almost absent. The effect of varying the roughness diameters was less noticeable in the contour plots of the streamwise velocity, so they are not shown here.
Streamwise velocity contours for
 $X_{0}=0.015$
and
 $\unicode[STIX]{x1D6EC}^{\ast }=0.8$
cm: (a) no control; (b) control based on wall transpiration; (c) control based on wall deformation. The contour lines range from 0 at the wall to 1 in the external flow, with an increment of 0.05.

Streamwise velocity contours for
 $X_{0}=0.015$
and
 $\unicode[STIX]{x1D6EC}^{\ast }=1.2$
cm: (a) no control; (b) control based on wall transpiration; (c) control based on wall deformation. The contour lines range from 0 at the wall to 1 in the external flow, with an increment of 0.05.

Streamwise velocity contours for
 $X_{0}=0.015$
and
 $\unicode[STIX]{x1D6EC}^{\ast }=1.6$
cm: (a) no control; (b) control based on wall transpiration; (c) control based on wall deformation. The contour lines range from 0 at the wall to 1 in the external flow, with an increment of 0.05.

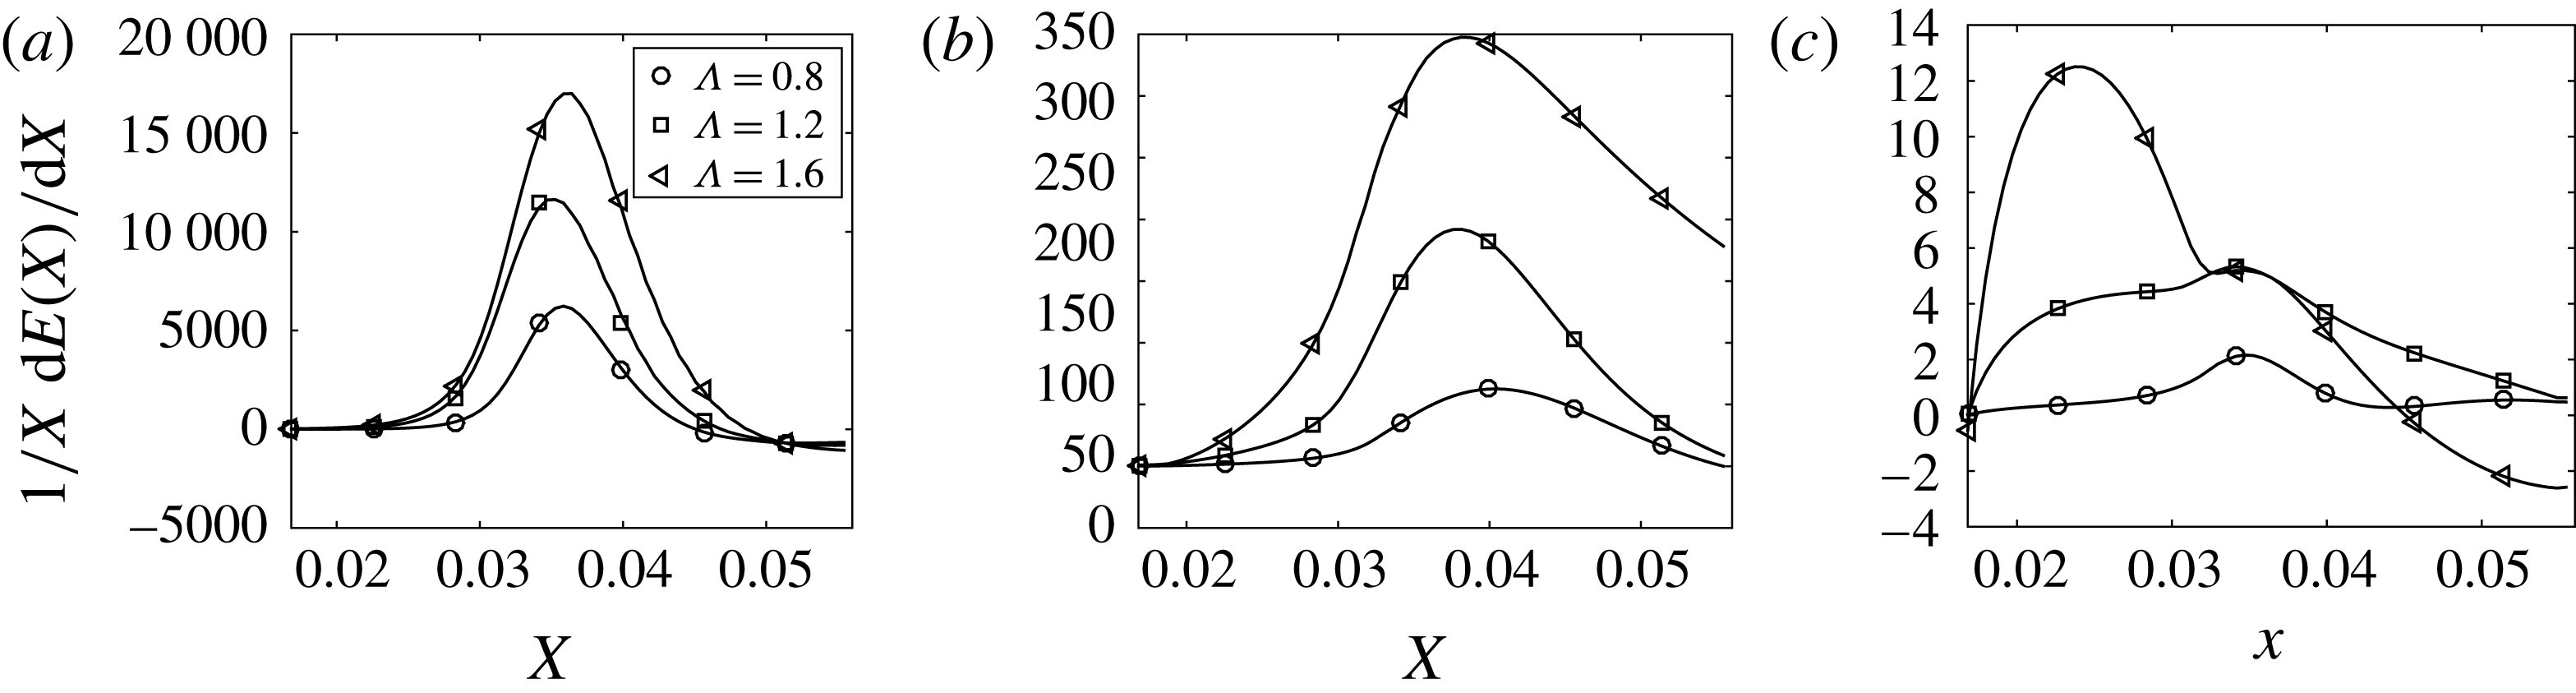
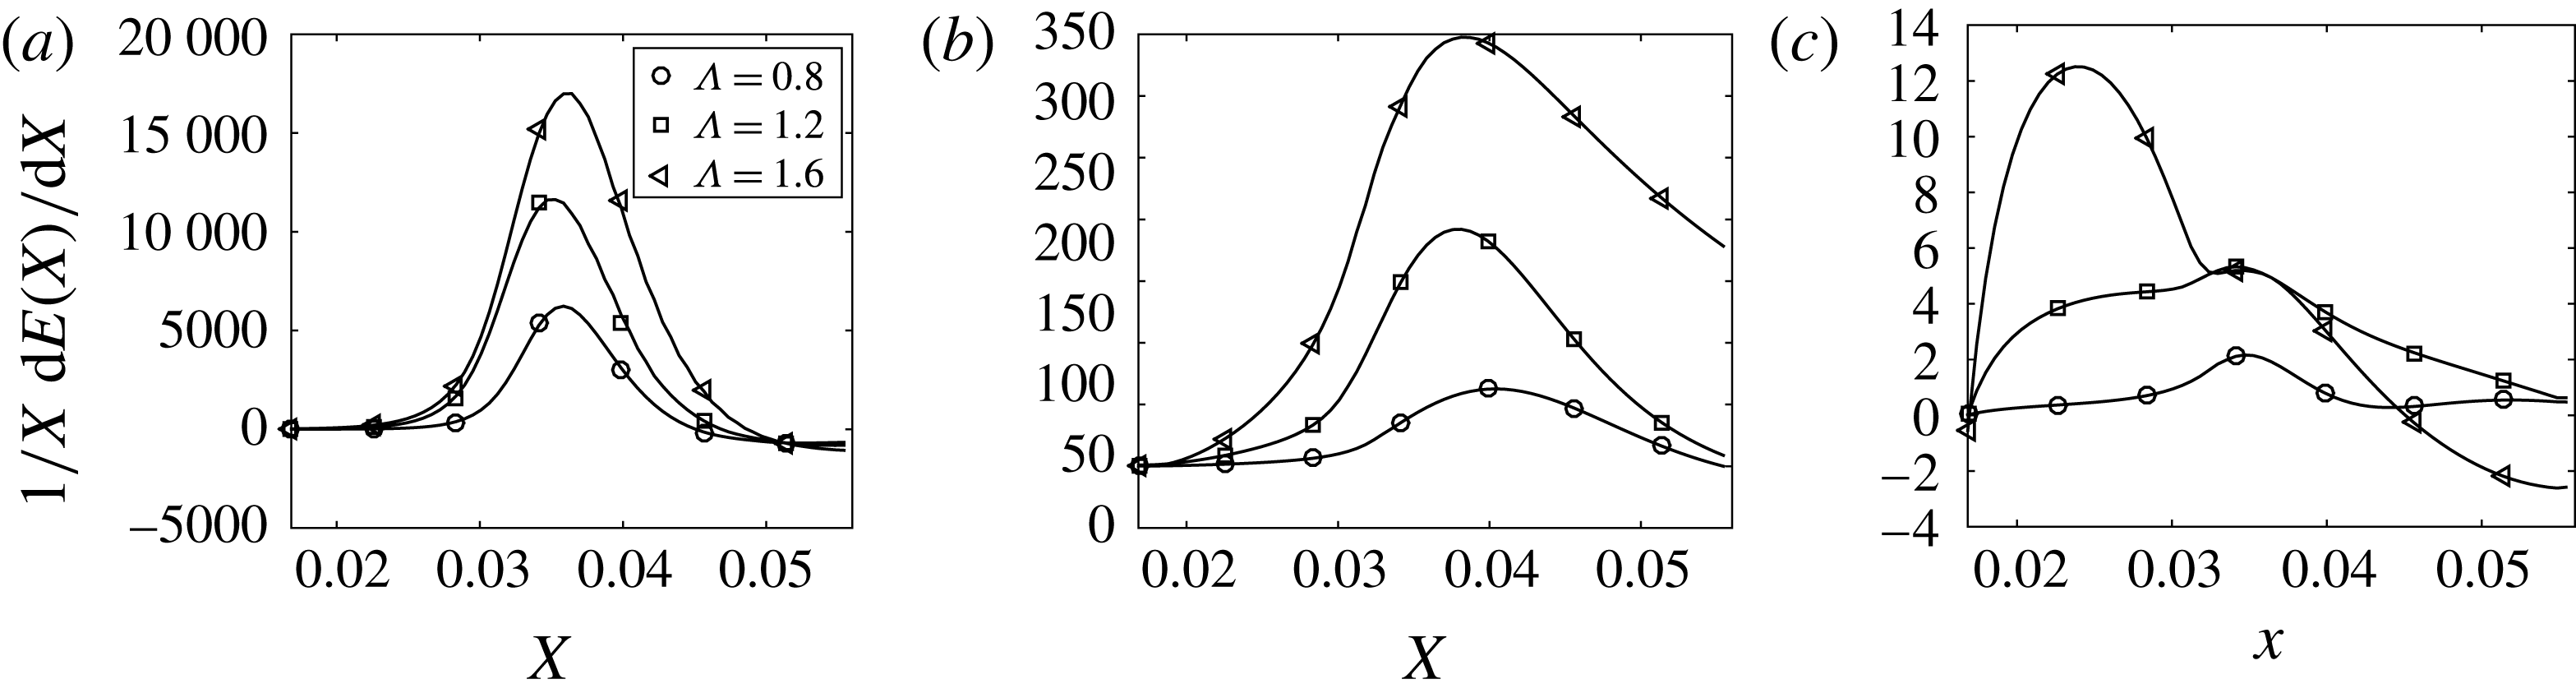
To better highlight the difference among various control cases, the growth rate of energy,
 $1/X\,\text{d}E/\text{d}X$
, is plotted here, as opposed to the energy itself as was done in the previous subsection. In figure 16 we plot the energy growth rate for different spanwise separations. One noticeable thing inferred from all cases, including the uncontrolled one, is that as the spanwise separation is increased, the energy growth rate is increased, which is altogether expected because the wakes are less likely to coalesce for the largest spanwise separation. The smallest growth rates correspond to the control based on wall deformations as expected (see figure 16
c), being reduced to almost zero for the smallest spanwise separation (circles in figure 16
c). Small energy growth rate is also seen in the case of control based on wall transpiration for the smallest spanwise separation case (circles in figure 16
b). The growth rate corresponding to the largest spanwise separation in this case is an order of magnitude larger (triangles compared to circles in figure 16
b).
Growth rate of energy as a function of the streamwise direction: (a) no control; (b) control based on wall transpiration; (c) control based on wall deformation.
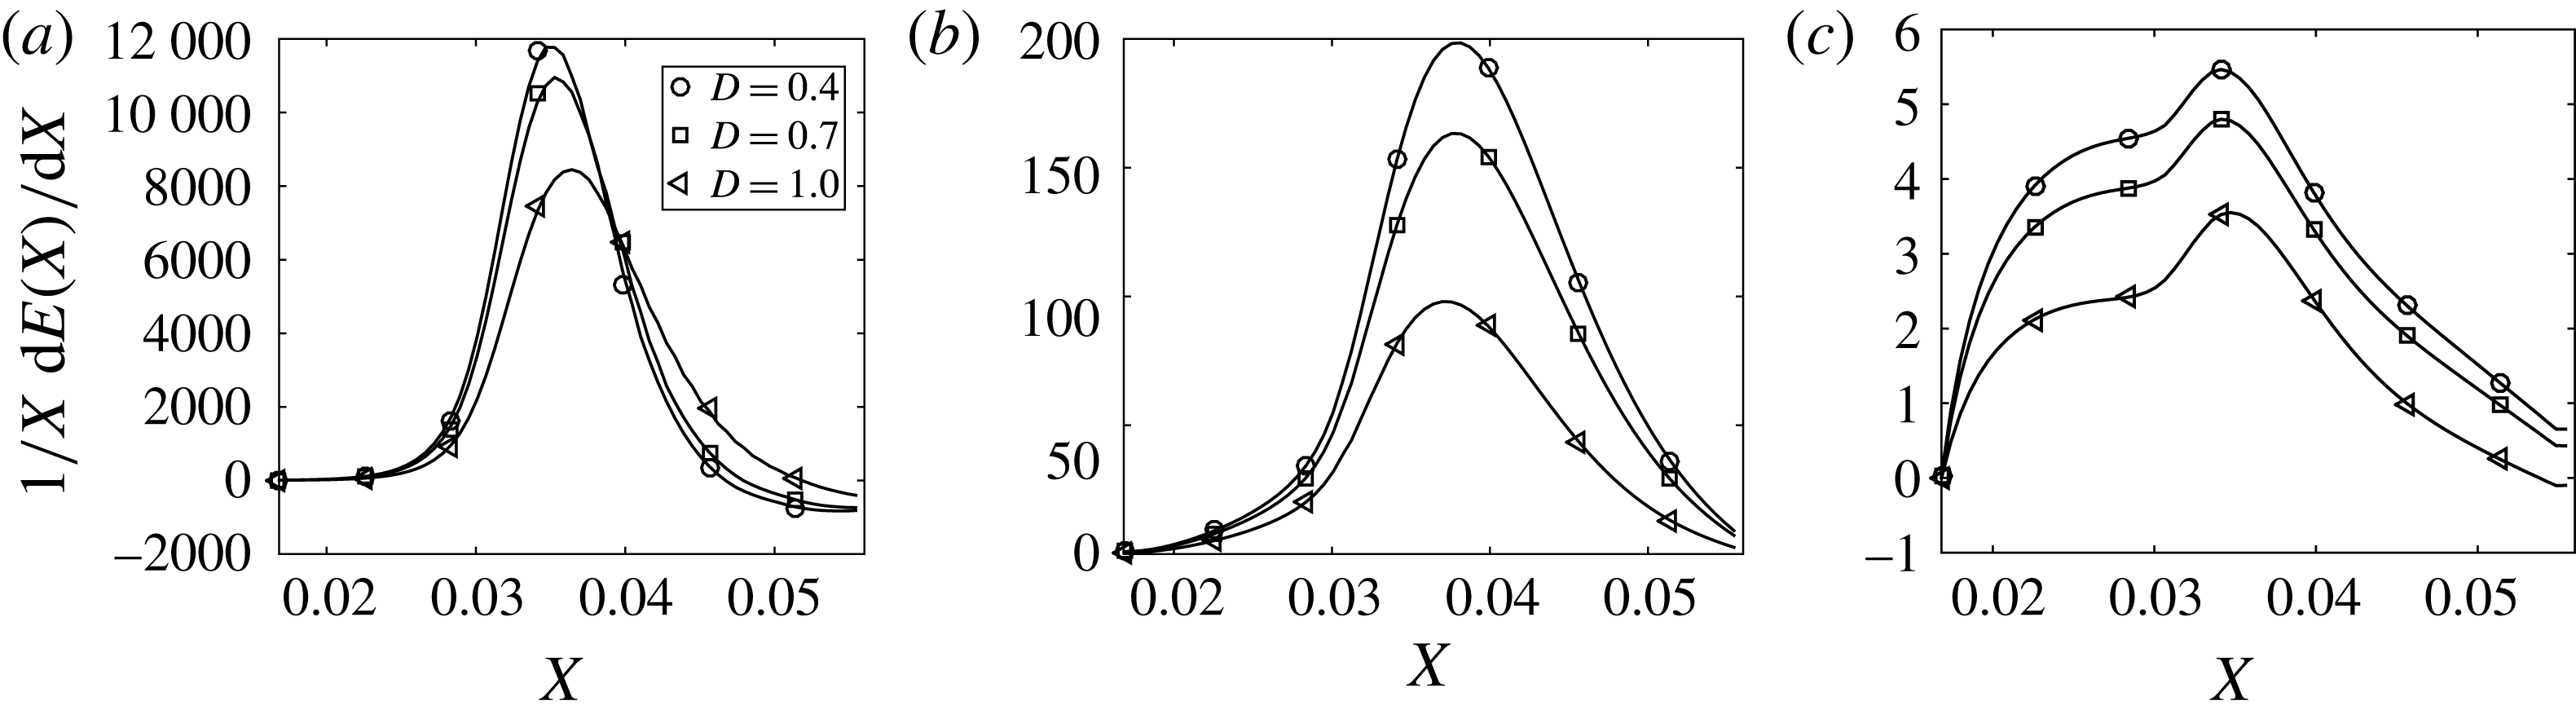
In regard to the variation of the roughness diameter, figure 17 shows that the differences are not as large as the differences noticed in the previous case. As the diameter is increased the growth rates decrease for all cases, which is expected and commensurate with the results corresponding to the variation of spanwise separation (i.e. as the diameter is increased the gap between the roughness elements decreases, as long as the spanwise separation is kept constant). The growth rates corresponding to the control based on wall deformations are almost two orders of magnitude smaller than the growth rates corresponding to the control based on wall transpiration here.
Growth rate of energy as a function of the streamwise direction: (a) no control; (b) control based on wall transpiration; (c) control based on wall deformation (
 $\unicode[STIX]{x1D6EC}^{\ast }=1.2$
cm).
5 Discussion of the physical mechanism behind the control strategies
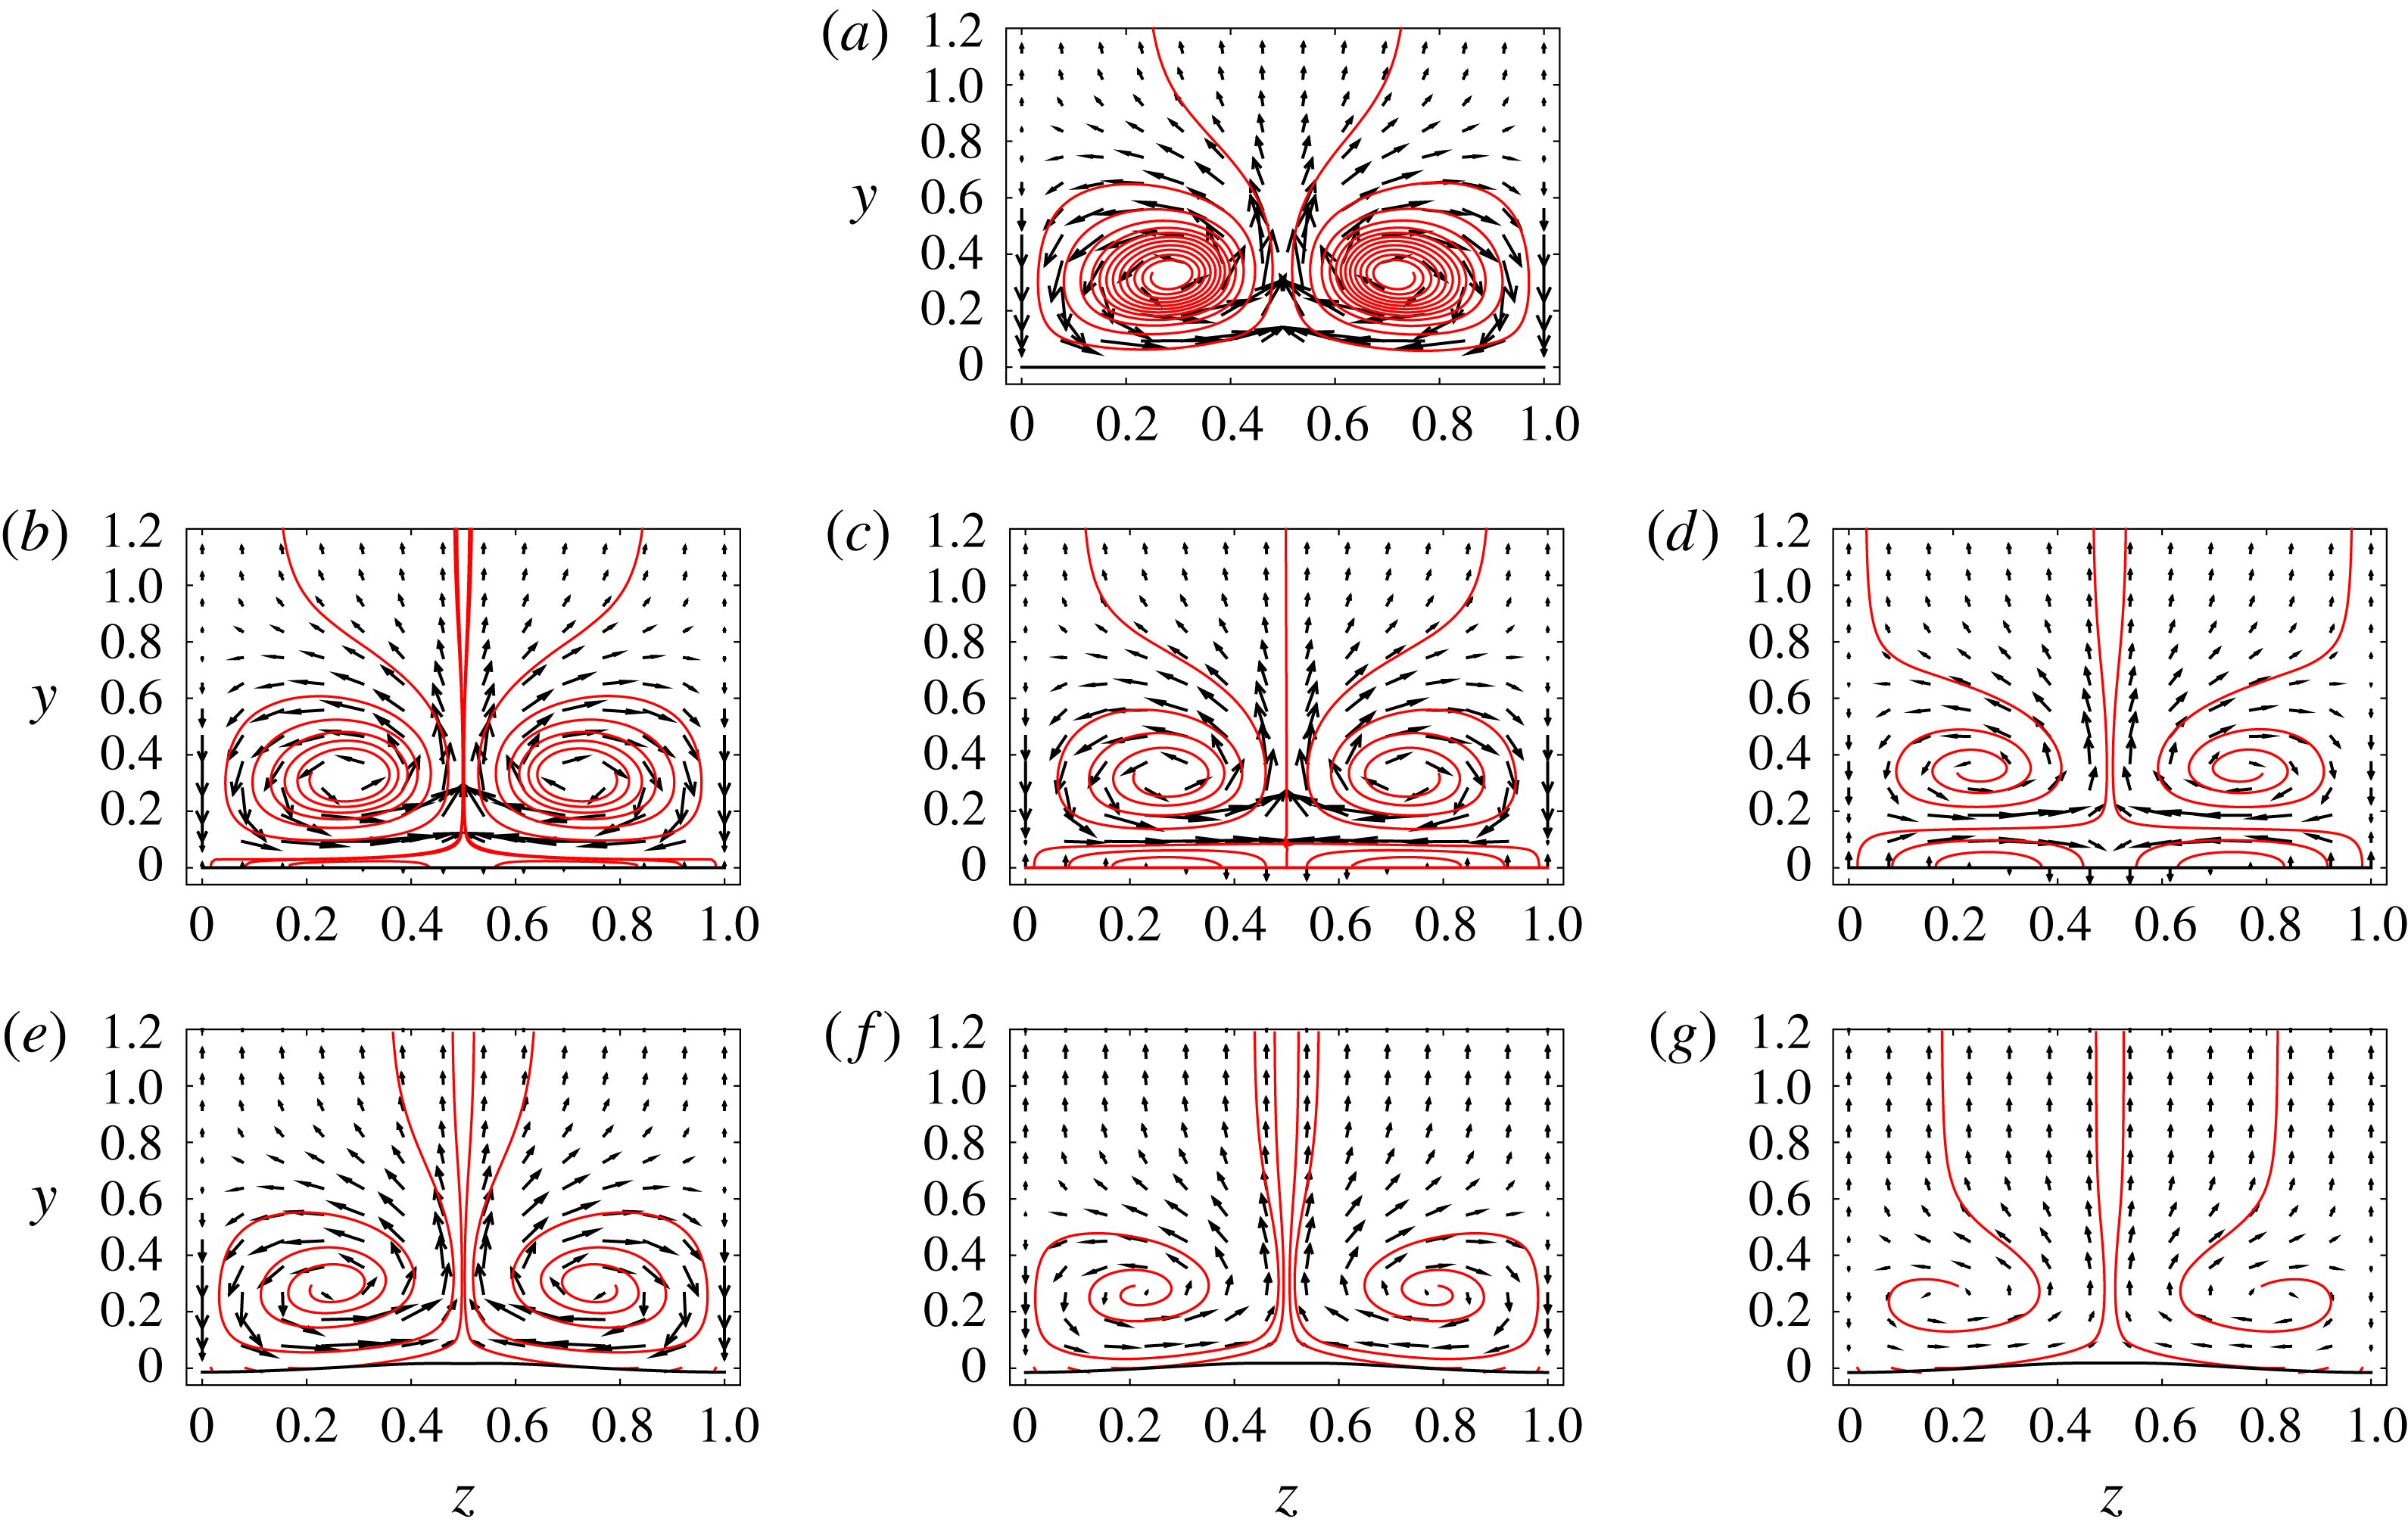
In this section, we discuss the main physical mechanisms that are behind the control based on wall transpiration and wall deformation, and explain why the latter is more effective than the former in reducing the vortex energy. In figure 18, we plot two-dimensional vector fields
 $(v,w)$
and streamlines in a cross-plane
 $(y,z)$
located in
 $X=0.04$
, for the spanwise separation
 $\unicode[STIX]{x1D6EC}^{\ast }=1.2$
cm. Two streamlines were seeded in close proximity to the centres of two vortices, while other streamlines were seeded from the wall. These latter have meaning for control based on wall transpiration because the velocity is non-zero at the wall as a result of blowing and suction. The top plot (figure 18
a) represents the uncontrolled flow, and it shows two counter-rotating vortices lifting low momentum from the wall at the spanwise location between the two vortices, as well as distributing high momentum fluid from the upper layers to the wall at the
 $z=0$
or
 $z=1$
planes. It is well known that this exchange of high and low momentum in the vertical direction brings about variations of the streamwise velocity along the spanwise direction, which is the main driver of high- and low-speed streaks.
Two-dimensional vector fields
 $(v,w)$
and streamlines in a cross-plane
 $(y,z)$
located in
 $X=0.04$
: (a) uncontrolled flow; (b) wall transpiration control, iteration 1; (c) wall transpiration control, iteration 5; (d) wall transpiration control, iteration 10; (e) wall deformation control, iteration 1; (f) wall deformation control, iteration 5; (g) wall deformation control, iteration 10 (
 $\unicode[STIX]{x1D6EC}^{\ast }=1.2$
cm).
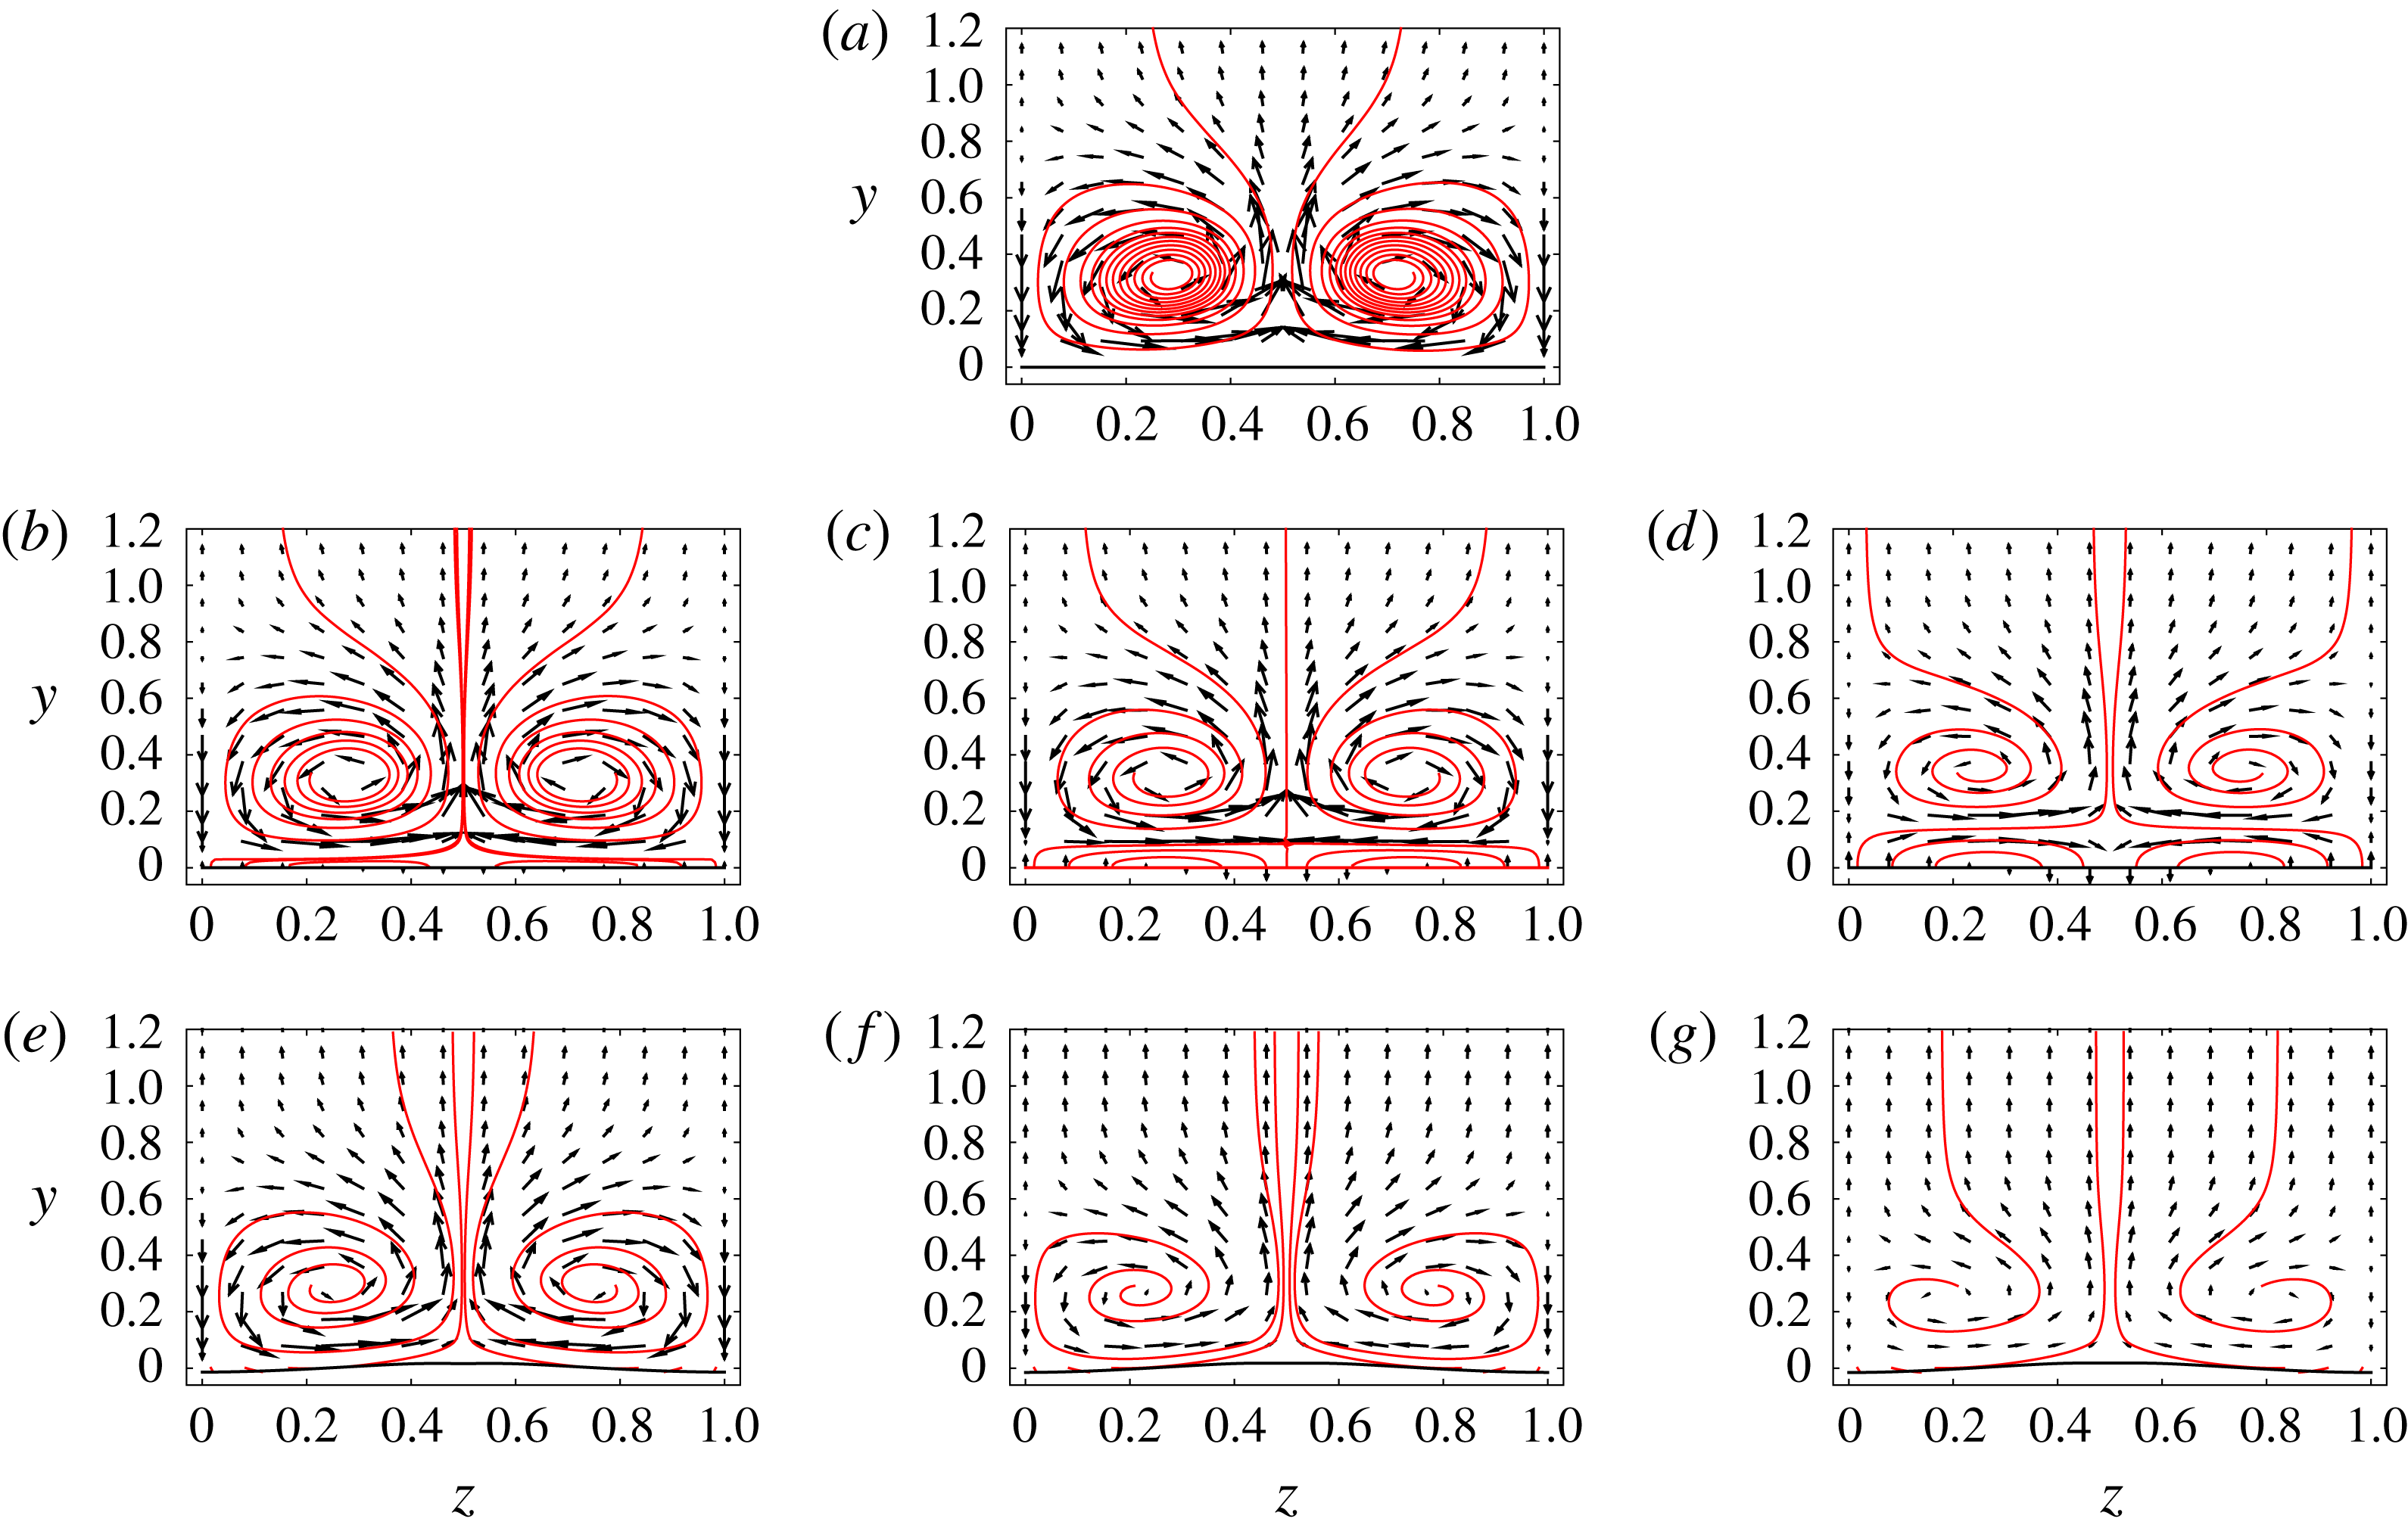
Panels 18(b) and 18(e) represent the vortices for the control based on wall deformation and transpiration, respectively, after the first iteration in the control algorithm. The other panels of the figure (18
c,d,f,g) represent the vortices at two subsequent iterations as indicated in the figure caption. As the number of iterations in the control algorithm increases, a weakening of the vortex strength is apparent as a result of both control algorithms. The strength of the vortex is qualitatively measured here by the length of the arrows of the two-dimensional vector field
 $(v,w)$
. The ‘relaxation’ of vortices is also revealed by the evolution of the streamline that is seeded from a location that is close to the centre of the vortex. For the uncontrolled flow in figure 18(a), it is noted that these streamlines are very close to each other; as the iteration number increases, however, the streamlines become more scarce and distant from one another (this is more prevalent for the control based on wall deformation). For the control based on wall transpiration in 18(b–d), an additional weak vortical flow is initiated in the vicinity of the wall due to a spanwise alternation of blowing and suction. This forces the two counter-rotating vortices to move upward, changing the vertical location of the Görtler vortex.
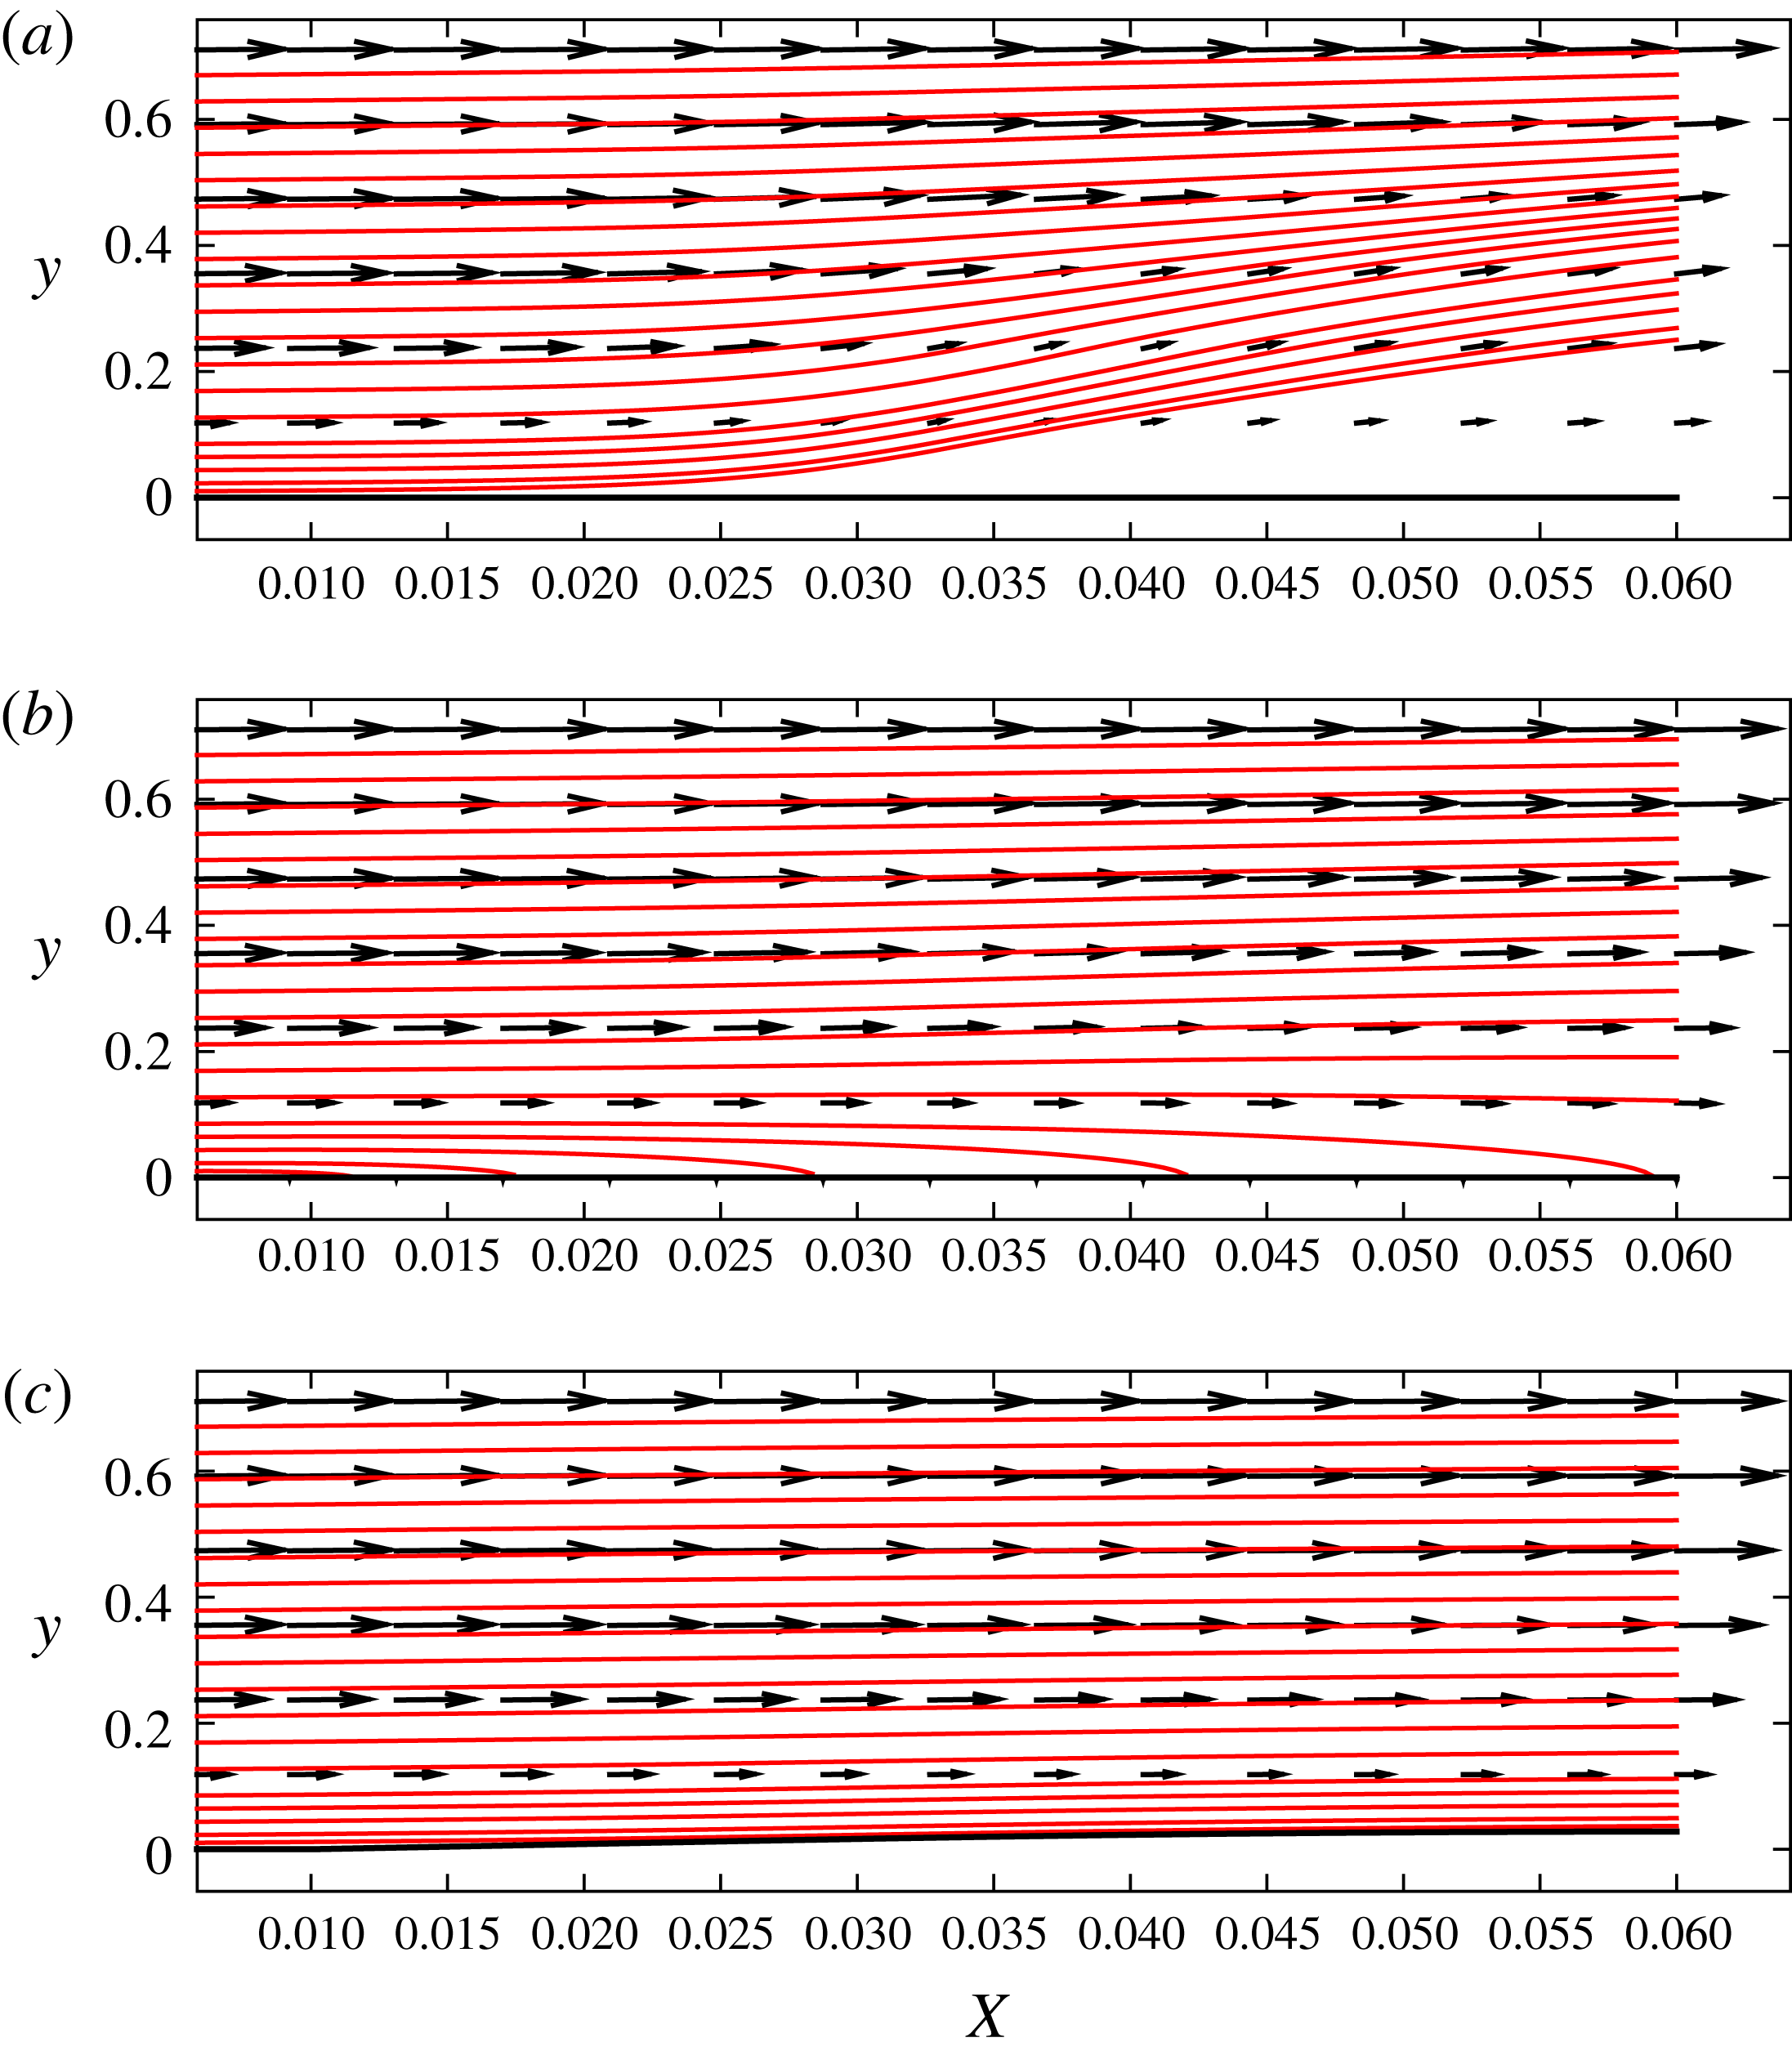
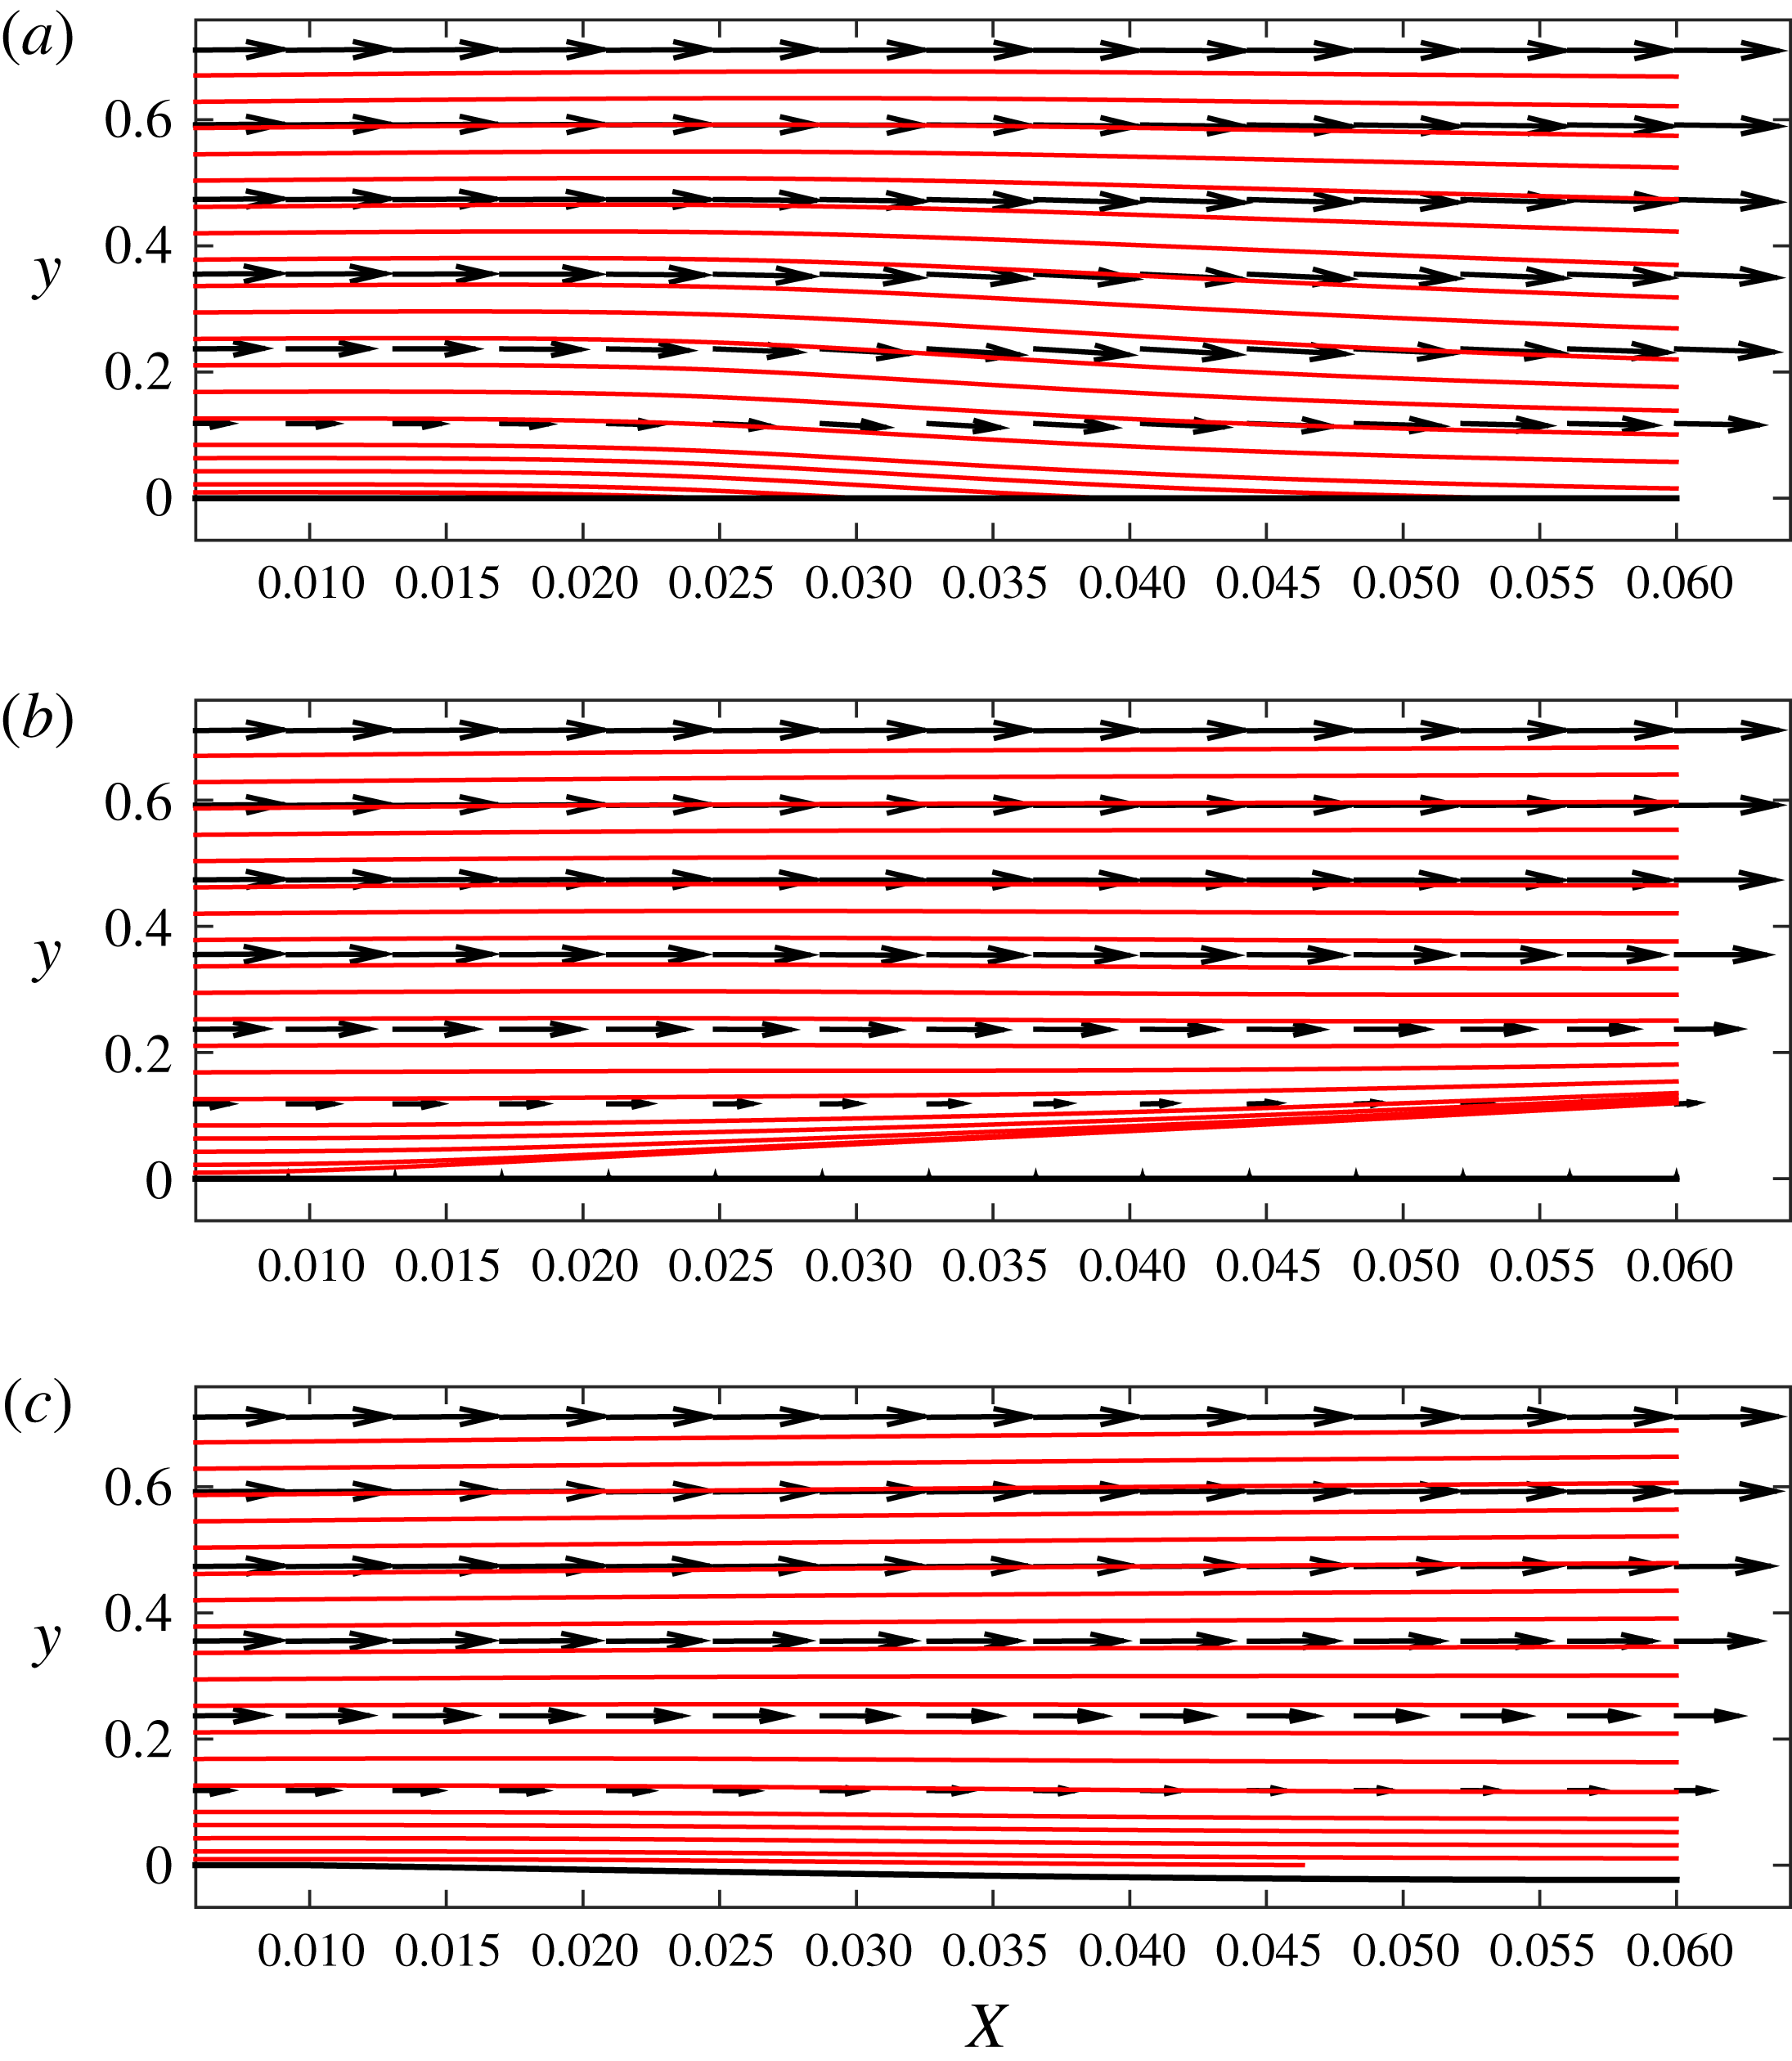
Two-dimensional vector fields
 $(u,v)$
and streamlines in a sectional plane
 $(X,y)$
located in
 $z=0.5$
(where low momentum fluid particles are lifted from the wall): (a) uncontrolled flow; (b) wall transpiration control; (c) wall deformation control (
 $\unicode[STIX]{x1D6EC}^{\ast }=1.2$
cm).
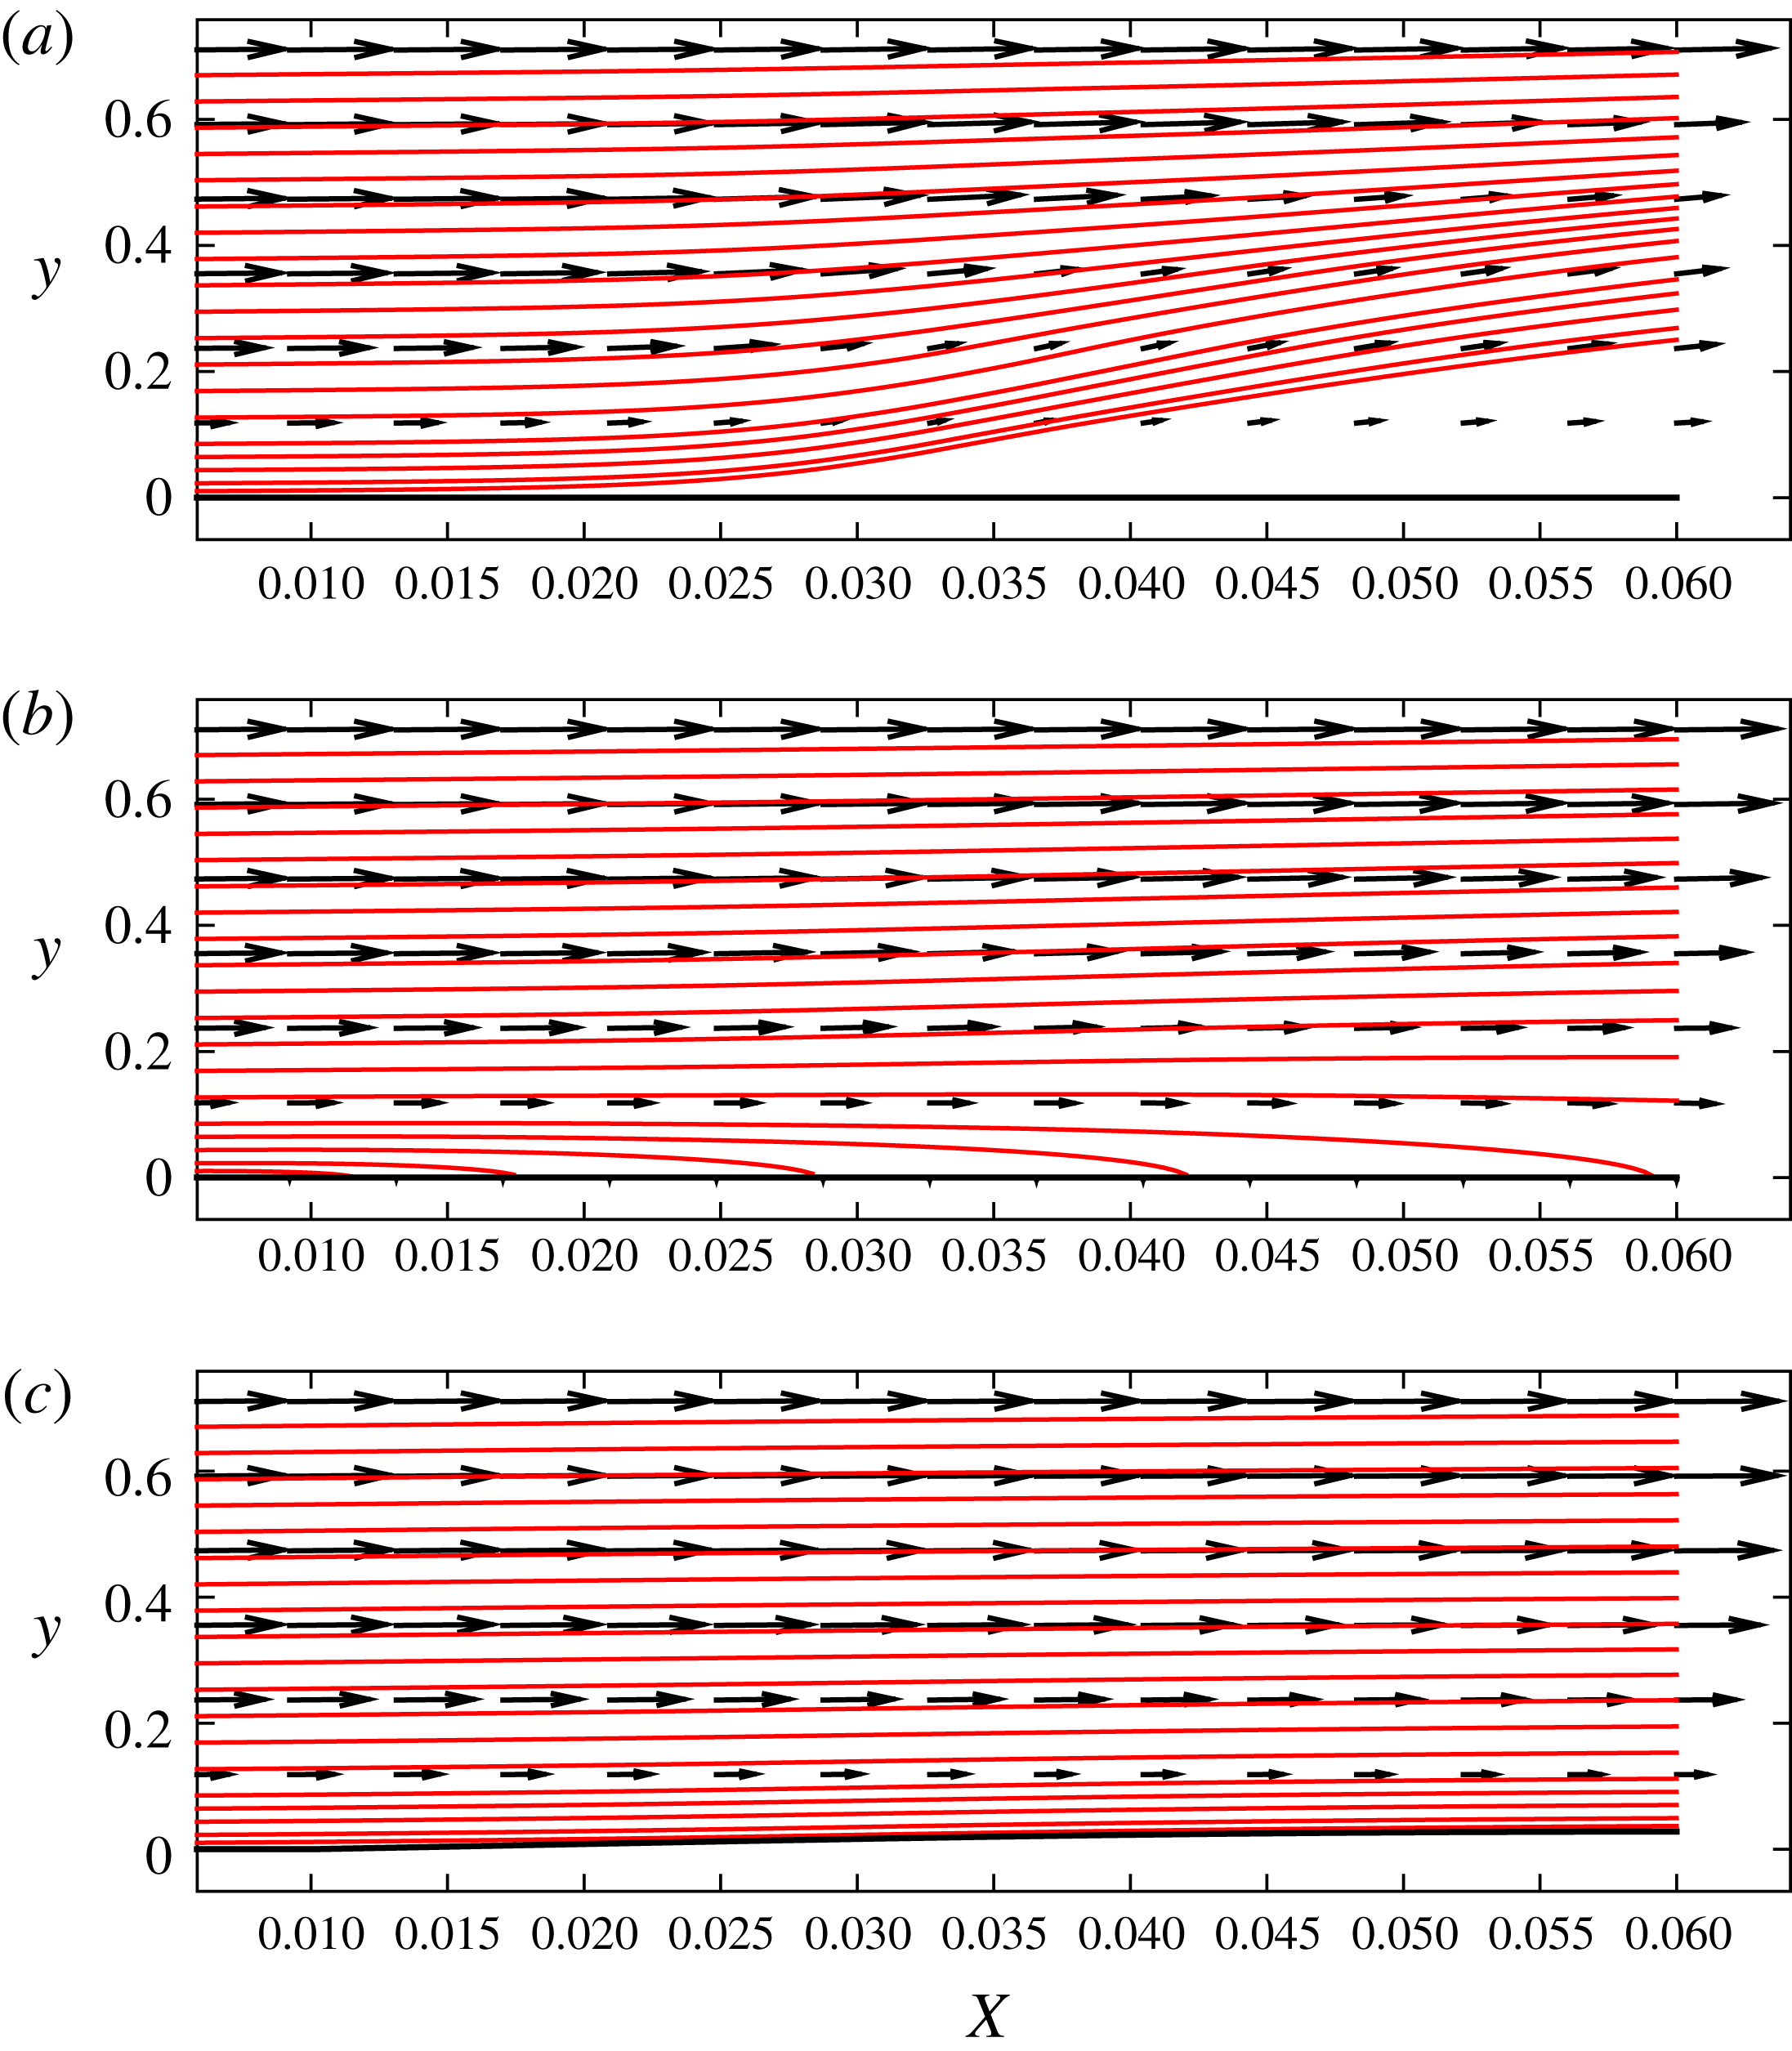
In figures 19 and 20, we plot two-dimensional vector fields and streamlines for uncontrolled and controlled boundary layers, in sectional planes
 $(x,y)$
that are located at
 $z=0.5$
and
 $z=0$
, respectively. In figure 19(a), corresponding to the uncontrolled flow, streamlines that are seeded in close proximity to the wall reveal how fluid particles carrying low momentum are lifted up from the lower layers to the upper layers. The deceleration of fluid particles can be noted by inspecting the variation of the length of arrows that form the vector field (the length of the arrows is proportional to the velocity magnitude in its location): by following the horizontal line of vectors starting from the left boundary at approximately
 $y=0.36$
in figure 19(a), one can notice how the length of arrows decreases as the fluid particle advances downstream. Now, if one inspects the same line of vectors in 19(b) or 19(c) (initiated at
 $y=0.36$
from the left), it is seen that the length of the arrow does not change much as the fluid particle moves downstream (there is a very small decrease for control based on wall transpiration in figure 19
b). The streamline at this wall-normal location (
 $y=0.36$
) is also parallel to the wall for both control cases, while the same streamline in the uncontrolled case (figure 19
a) shows a significant deviation in the upward direction. The same conclusions can be reached for the line of vectors located at
 $y=0.12$
(the streamline associated with this location is parallel to the wall as well). Below this level (
 $y=0.12$
), however, there are differences between the two control algorithms: first, the suction effect is revealed in figure 19(b) by the first five streamlines changing direction and ending at the wall because the fluid particles are absorbed into the wall; second, figure 19(c) shows a slight deviation of the wall line in the upward direction as a results of the control scheme, which accelerates fluid particle, thus increasing the momentum in the vicinity of the wall (all streamlines in this case become parallel to the wall).
Two-dimensional vector fields
 $(u,v)$
and streamlines in a sectional plane
 $(X,y)$
located in
 $z=0$
(where low momentum fluid particles are brought to the wall): (a) uncontrolled flow; (b) wall transpiration control; (c) wall deformation control (
 $\unicode[STIX]{x1D6EC}^{\ast }=1.2$
cm).
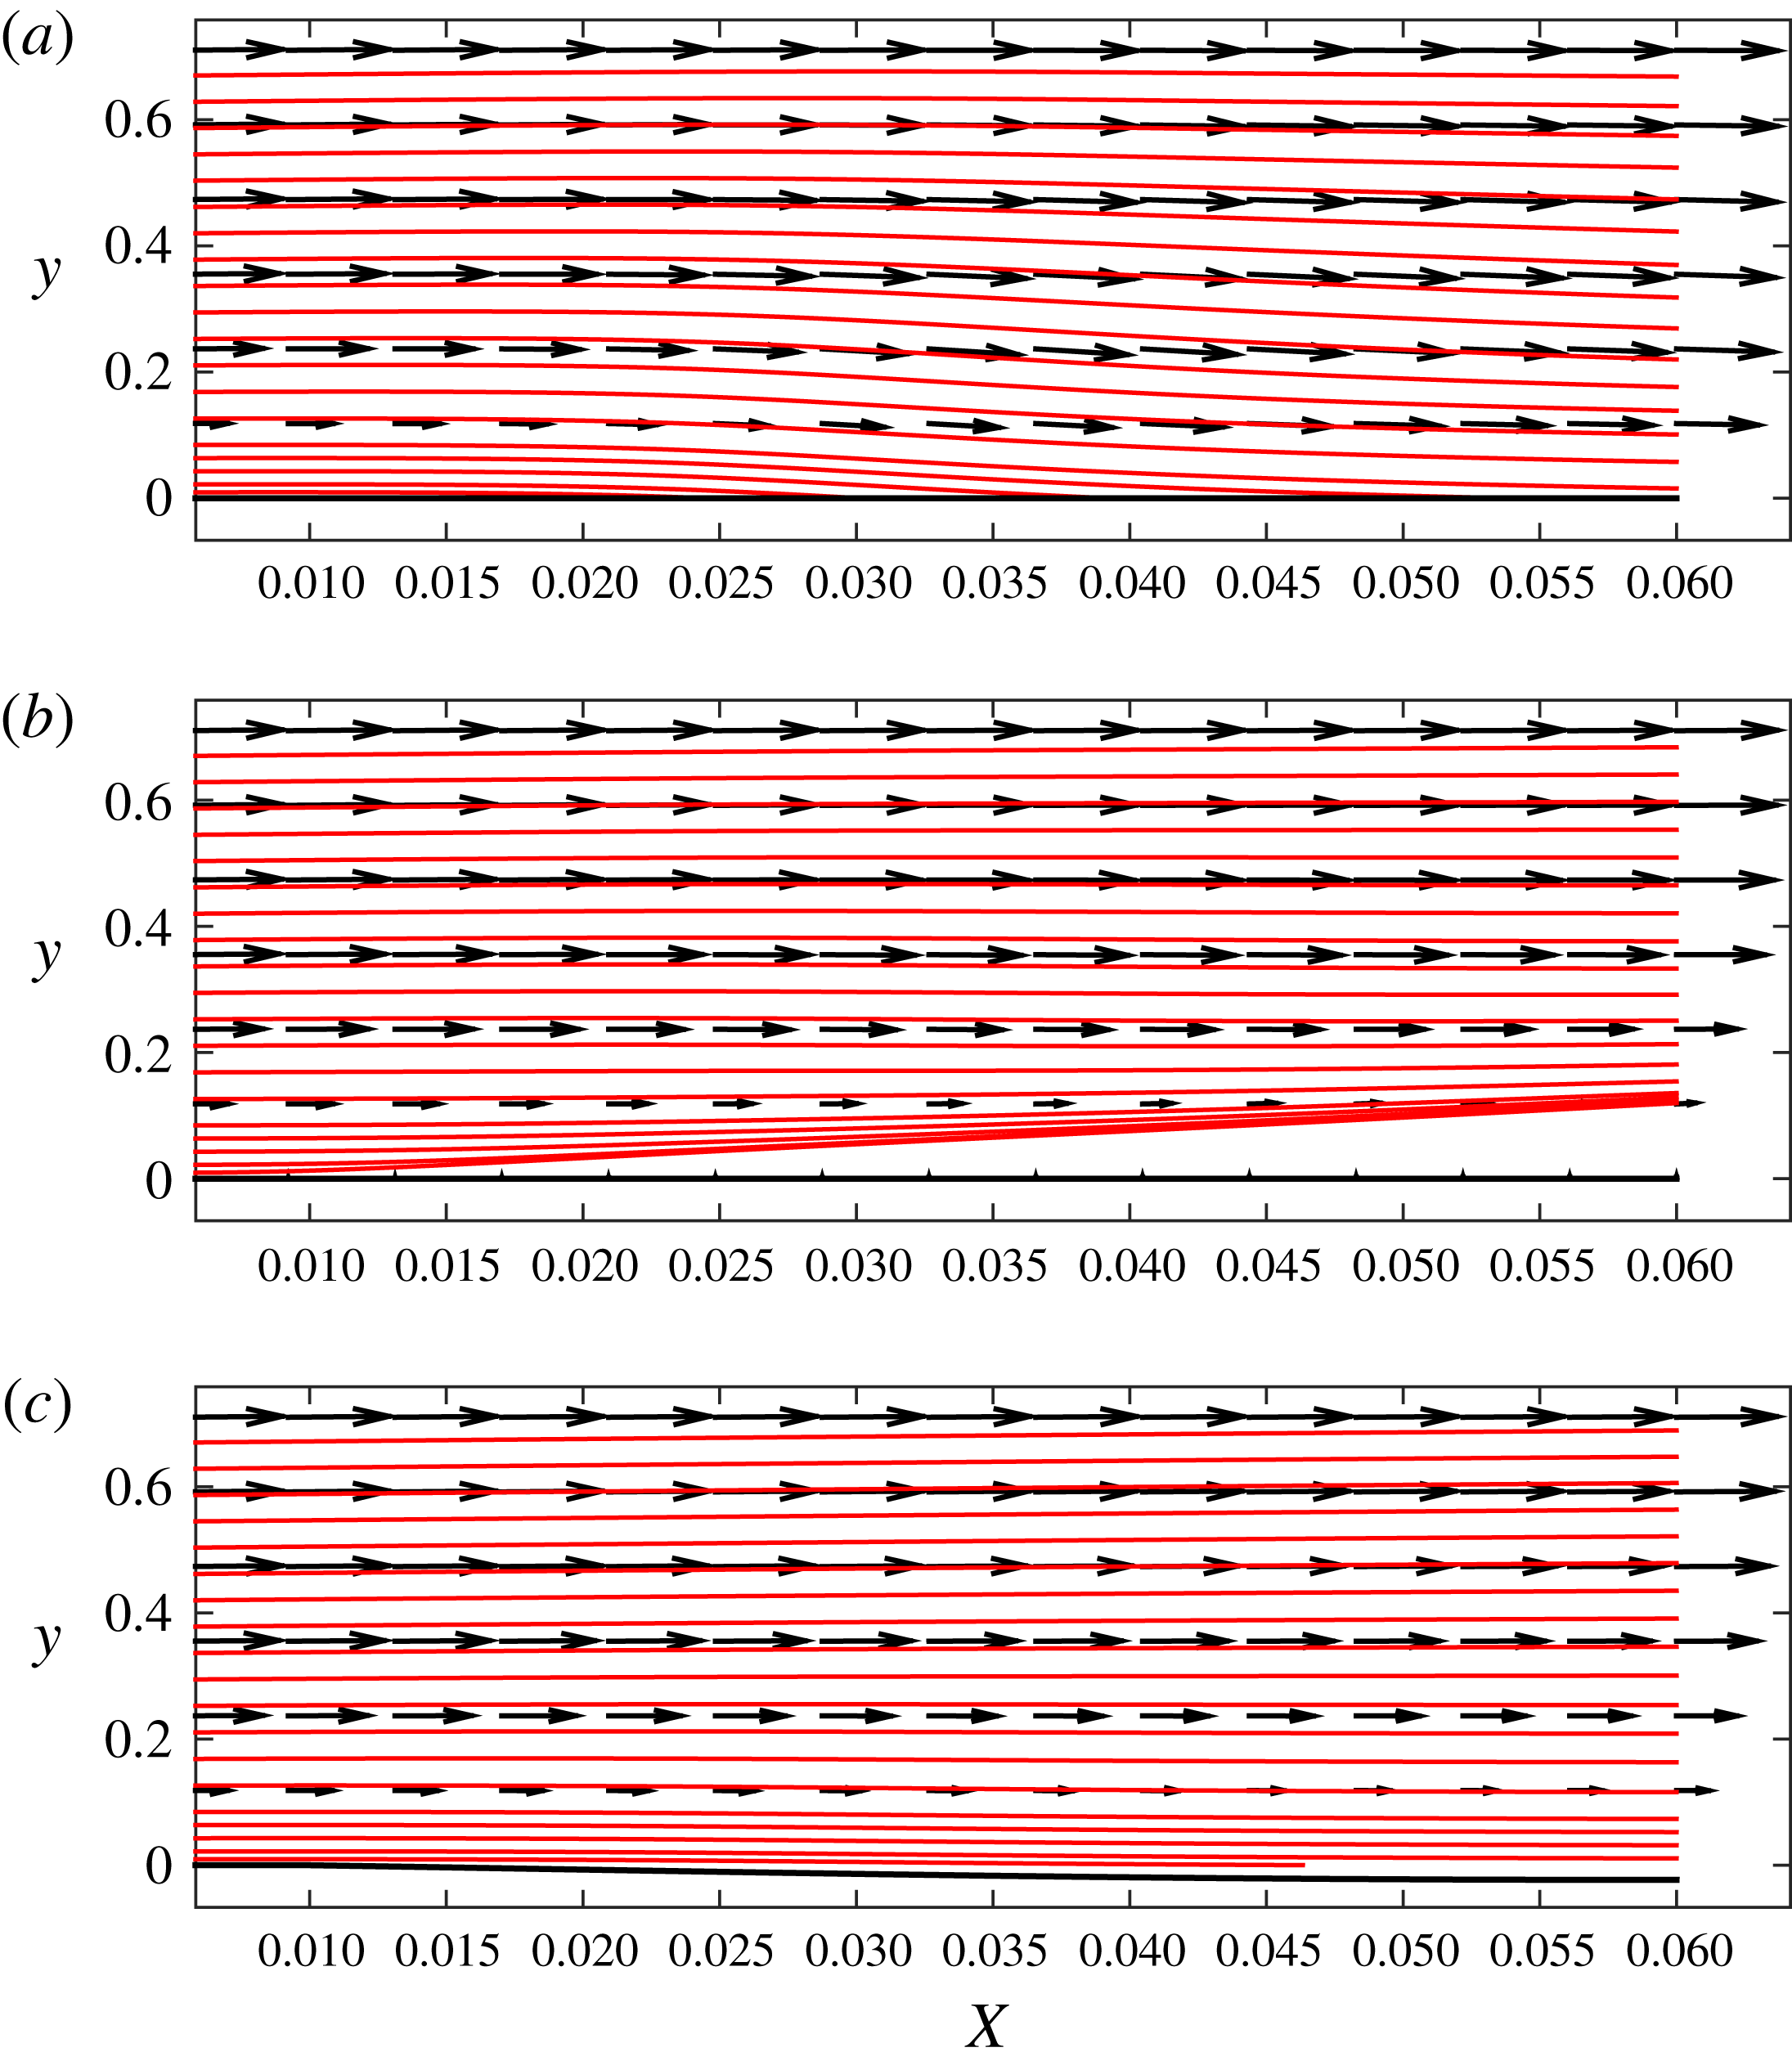
In figure 20, the same picture as in figure 19 is shown, except that another spanwise location corresponding to the downwelling of the fluid particle from the upper layers to the wall is considered. As mentioned before, at this spanwise location
 $z=0$
high momentum from above is brought downward, which can be clearly noticed by the increase in the length of arrows along the line of vectors that starts at approximately
 $y=0.12$
or
 $y=0.25$
from the left boundary. Shown in figure 20(a) are also streamlines that deviate towards the wall as a result of the counter-rotation posed by the vortices. The effect of blowing at this spanwise location is seen in figure 20(b), where the streamlines are deviated from the wall; this brings about changes in the upper layers, where fluid particles are constrained to move at a constant speed and in a trajectory that is parallel to the wall (see the line of vectors that starts at
 $y=0.25$
, for example). In figure 20(c), the downward deviation of the wall geometry can be seen, which slows down the fluid particles gently, thus decreasing the momentum in the proximity to the wall; again, this yields a constant velocity along the vector lines, with streamlines that remain parallel to the wall.
Finally, in figure 21 we plot two-dimensional vector fields
 $(u,w)$
and streamlines in two sectional planes
 $(x,z)$
that are parallel to the wall, one very close to the wall (
 $y=0.02$
) and the other at
 $y=0.15$
(the reason for choosing the latter becomes clear when looking at vectors and streamline plots in figures 19 and 20; at this elevation the velocity is constant along a horizontal line, and the streamline is parallel to the wall). The uncontrolled flow in figure 21(a), corresponding to the plane
 $y=0.02$
, shows a deviation of fluid particles towards
 $z=0.5$
line, which is the effect of counter-rotating vortices; this produces a small cross-flow component. As a result of the control, as shown in figure 21(b,c), the fluid particles are brought back to their original upstream trajectories, with the cross-flow component being negligible (note that a small cross-flow component is still seen in the plot corresponding to the control based on wall transpiration). At the other elevation (
 $y=0.15$
), there is somewhat smaller cross-flow component in the uncontrolled case (figure 21
d) as expected, and no cross-flow component for both control cases.
Two-dimensional vector fields
 $(u,w)$
and streamlines in a sectional plane
 $(X,z)$
parallel to the wall: (a) uncontrolled flow,
 $y=0.02$
; (b) wall transpiration control,
 $y=0.02$
; (c) wall deformation control,
 $y=0.02$
; (d) uncontrolled flow,
 $y=0.15$
; (e) wall transpiration control,
 $y=0.15$
; (d) wall deformation control,
 $y=0.15$
(
 $\unicode[STIX]{x1D6EC}^{\ast }=1.2$
cm).

Different mechanisms towards controlling a boundary layer flow distorted by centrifugal instabilities are at play here for the two schemes introduced in this study:
(i) For control based on wall deformation, a positive displacement of the wall (at the spanwise location between the two vortices, as seen in figure 19 c) accelerates fluid particles in the streamwise direction, while negative displacement (see figure 20 c) decelerates them. This means that the momentum of fluid particles in close proximity to the wall (in between the vortices) is increased, thus weakening the effect of lift up of low momentum fluid particles from the wall, as previously described. The opposite occurs at negative displacement locations, where the momentum of fluid particles at the wall is decreased. There is also an effect (although small) on the cross-flow velocity component as shown in figure 21.
(ii) The mechanism behind the control based on wall transpiration closely resembles the opposition control type, as introduced and described in previous studies concerning turbulent boundary layers or channel flows (see, for example, Choi et al. Reference Choi, Moin and Kim1994, Koumoutsakos Reference Koumoutsakos1997, Reference Koumoutsakos1999, Stroh et al. Reference Stroh, Frohnapfel, Schlatter and Hasegawa2015), although, here, the sensor is not the vertical velocity measured in a plane parallel to the wall. However, as seen in figure 18(b,d,f), blowing is applied in regions where the vertical velocity in the flow is negative, and suction is applied where the vertical velocity in the flow is positive; this is the main mechanism of reducing the energy of the Görtler vortices. Compared to the control based on wall deformation, the effect on the cross-flow velocity is more significant as shown in figure 18(f), where the vortical flow induced by alternating blowing and suction contributes to the increase of the cross-flow.
We emphasize again that there are significant differences between the steady Görtler vortices considered here and the wall turbulence considered in previous studies that might explain why, for wall turbulence, it was found that the control based on wall transpiration can be more effective than wall deformation. As mentioned previously, we solve a parabolic problem in steady state, where we assume variations in the streamwise direction to be small for both the flow and wall geometry. One of the reasons that the wall deformation control is more effective than the wall transpiration control, in our study, is clear from the previous discussions of vector fields and streamlines (figures 18–21): in a nutshell, the alternation of blowing and suction in the spanwise direction for the former type of control introduces an additional vortical flow that, on one hand, deviates or attracts streamlines from/to the wall, and, on the other hand, influences the cross-flow in proximity to the wall; this is not the case for the control based on wall deformation, where it was found that the mechanism of flow alteration is different. Moreover, in the control based on wall transpiration case, the additional vortical flow induced in the vicinity of the wall forces Görtler vortices to move slightly upward, thus preventing their complete elimination.
6 Summary and conclusions
An optimal control strategy in the high Reynolds number asymptotic framework was derived and tested on Görtler vortices developing along a concave surface. The Navier–Stokes equations were simplified to obtained the boundary region equations (BRE), which are a parabolic set of equations since the streamwise pressure derivative and the second derivative were neglected. The effect of wall deformations was incorporated into the model by a Prandtl transformation applied to the BRE, which was then solved numerically using a marching algorithm. The variations in local surface shape then allowed for a relatively straightforward control strategy to be implemented to the transformed set of equations in order to determine the optimum wall deformation or transpiration that reduced the energy of the vortices. Görtler vortices were initiated by perturbing the upstream flow with a periodic array of roughness elements placed near the leading edge, using a previously derived asymptotic solution to obtain the upstream boundary conditions (Goldstein et al.
Reference Goldstein, Sescu, Duck and Choudhari2010, Reference Goldstein, Sescu, Duck and Choudhari2011). The vortex energy was controlled via an optimal control algorithm based on Lagrange multipliers and adjoint equations, where the wall displacement or the wall transpiration velocity serves as the control variable. The modified BREs equations (2.9)–(2.12) explicitly included an arbitrary function
 ${\mathcal{F}}(X,z)$
representing the local surface deformation, and therefore provided a parametric mechanism for the optimal control. The optimal control strategy was aimed at minimizing the difference between the calculated wall shear stress and the Blasius shear stress. The cost functional was defined in terms of the energy associated with the Görtler vortices, and the sensors were functions of the wall shear stress. Local wall deformations appeared to resemble elongated surface shapes, in the form of streaks, that we optimized to control the Görtler vortex energy.
An extensive numerical study of the effect of controlled wall deformation versus transpiration on the vortex development for incompressible boundary layer flow over a curved wall has been performed. Various results in terms of contour plots of streamwise velocity, energy distribution in the streamwise direction or distributions of the spanwise average shear stress showed that the optimal control algorithm is very effective in counteracting the Görtler vortices. The kinetic energy associated with the vortices was shown to decrease by almost three orders of magnitude from the original amplitude in some cases, with a commensurate reduction in the wall shear stress. Our results clearly indicate that the controlled surface deformations are more effective than wall transpiration in altering the streamwise development of the Görtler vortices for a given roughness height and spanwise wavelength. Potential explanations for this difference were given, and the physical mechanism behind the control was described. It was found that for control based on wall deformation, a positive displacement of the wall accelerates fluid particles in the streamwise direction, while negative displacement decelerates them, which means that the fluid momentum at the wall is increased, weakening the ‘lift-up’ effect. The opposite was shown to occur at negative displacement locations, where the momentum of fluid particles at the wall is decreased. On the other hand, for control based on wall transpiration, blowing is applied in regions where the vertical velocity in the flow is negative, and suction is applied where the vertical velocity in the flow is positive (this is similar to the ‘opposition control’ mechanism that was introduced in the framework of control of turbulent channel flows (Choi et al. Reference Choi, Moin and Kim1994)) which is the main mechanism behind the reduction of the energy of the Görtler vortices. The fact that wall-deformation-based control was found to be more effective than wall transpiration in our formulation of the control problem is clear in the discussion and pictorial representation of velocity field and streamlines of both types of control mechanisms (see figures 18–21).
While the boundary layer was excited by a row of roughness elements as derived in Goldstein et al. (Reference Goldstein, Sescu, Duck and Choudhari2010), the algorithm can be easily extended to include free-stream disturbances or turbulence at the upstream boundary. The proposed control algorithm has potential application to a number of realistic problems including aircraft wing design, to mitigate induced drag, or in supersonic wind tunnels, where it is known that flow instabilities in the test section are triggered by Görtler vortices developing on the concave portion of the walls. Of course, the latter application will necessitate the extension of the algorithm into the compressible regime, which is a matter of future analysis.
Acknowledgements
The authors would like to gratefully acknowledge constructive corrections, comments and suggestions from anonymous reviewers, especially the third reviewer for corrections in the derivation of optimality conditions. A.S. would like to acknowledge partial support from NASA EPSCoR RID Program through Mississippi State Grant Consortium directed by Dr N. Murray. M.Z.A. would like to thank Strathclyde University for financial support from the Chancellor’s Fellowship.
Appendix A. Adjoint equations
In the particular case considered in this study (with
 $\unicode[STIX]{x1D713}={\mathcal{F}}$
representing the wall deformation, and
 $\unicode[STIX]{x1D719}=v_{w}$
representing the wall transpiration), the Lagrangian can be expanded as
 $$\begin{eqnarray}\displaystyle & & \displaystyle {\mathcal{L}}(u,v,w,p,{\mathcal{F}},v_{w},u^{a},v^{a},w^{a},p^{a},s)\nonumber\\ \displaystyle & & \displaystyle \quad =\frac{\unicode[STIX]{x1D70E}_{1}}{2}\int _{X_{0}}^{X_{1}}\int _{\unicode[STIX]{x1D6FA}}\left\Vert \frac{\unicode[STIX]{x2202}{\mathcal{F}}}{\unicode[STIX]{x2202}X}\right\Vert ^{2}+\Vert {\mathcal{F}}\Vert ^{2}\,\text{d}\unicode[STIX]{x1D6FA}\,\text{d}X+\frac{\unicode[STIX]{x1D70E}_{2}}{2}\int _{X_{0}}^{X_{1}}\int _{\unicode[STIX]{x1D6E4}}\left\Vert \frac{\unicode[STIX]{x2202}v_{w}}{\unicode[STIX]{x2202}X}\right\Vert ^{2}+\Vert v_{w}\Vert ^{2}\,\text{d}\unicode[STIX]{x1D6E4}\,\text{d}X\nonumber\\ \displaystyle & & \displaystyle \qquad -\,\int _{X_{0}}^{X_{1}}\int _{\unicode[STIX]{x1D6E4}}s(v-v_{w})\,\text{d}\unicode[STIX]{x1D6E4}\,\text{d}X-\int _{0}^{X_{0}}\int _{\unicode[STIX]{x1D6E4}}sv\,\text{d}\unicode[STIX]{x1D6E4}\,\text{d}X-\int _{X_{1}}^{X_{t}}\int _{\unicode[STIX]{x1D6E4}}sv\,\text{d}\unicode[STIX]{x1D6E4}\,\text{d}X+{\mathcal{H}},\end{eqnarray}$$
where
 $$\begin{eqnarray}\displaystyle {\mathcal{H}} & = & \displaystyle \frac{\unicode[STIX]{x1D6FC}}{2}\int _{X_{s0}}^{X_{s1}}\int _{\unicode[STIX]{x1D6E4}}\Vert \unicode[STIX]{x1D70F}_{w}-\unicode[STIX]{x1D70F}_{0}\Vert ^{2}\,\text{d}\unicode[STIX]{x1D6E4}\,\text{d}X\nonumber\\ \displaystyle & & \displaystyle -\int _{0}^{X_{t}}\int _{\unicode[STIX]{x1D6FA}}u^{a}\left[u\frac{\unicode[STIX]{x2202}u}{\unicode[STIX]{x2202}X}+\hat{v}\frac{\unicode[STIX]{x2202}u}{\unicode[STIX]{x2202}Y}+w\frac{\unicode[STIX]{x2202}u}{\unicode[STIX]{x2202}z}-\frac{\unicode[STIX]{x2202}^{2}u}{\unicode[STIX]{x2202}Y^{2}}-{\mathcal{D}}^{2}u+\frac{\unicode[STIX]{x2202}{\mathcal{F}}^{2}}{\unicode[STIX]{x2202}z^{2}}\frac{\unicode[STIX]{x2202}u}{\unicode[STIX]{x2202}Y}\right]\text{d}\unicode[STIX]{x1D6FA}\,\text{d}X\nonumber\\ \displaystyle & & \displaystyle -\int _{0}^{X_{t}}\int _{\unicode[STIX]{x1D6FA}}v^{a}\left[u\frac{\unicode[STIX]{x2202}v}{\unicode[STIX]{x2202}X}+\hat{v}\frac{\unicode[STIX]{x2202}v}{\unicode[STIX]{x2202}Y}+w\frac{\unicode[STIX]{x2202}v}{\unicode[STIX]{x2202}z}+G_{\unicode[STIX]{x1D6EC}}u^{2}+\frac{\unicode[STIX]{x2202}p}{\unicode[STIX]{x2202}Y}-\frac{\unicode[STIX]{x2202}^{2}v}{\unicode[STIX]{x2202}Y^{2}}-{\mathcal{D}}^{2}v+\frac{\unicode[STIX]{x2202}{\mathcal{F}}^{2}}{\unicode[STIX]{x2202}z^{2}}\frac{\unicode[STIX]{x2202}v}{\unicode[STIX]{x2202}Y}\right]\text{d}\unicode[STIX]{x1D6FA}\,\text{d}X\nonumber\\ \displaystyle & & \displaystyle -\int _{0}^{X_{t}}\int _{\unicode[STIX]{x1D6FA}}w^{a}\left[u\frac{\unicode[STIX]{x2202}w}{\unicode[STIX]{x2202}X}+\hat{v}\frac{\unicode[STIX]{x2202}w}{\unicode[STIX]{x2202}Y}+w\frac{\unicode[STIX]{x2202}w}{\unicode[STIX]{x2202}z}+{\mathcal{D}}p-\frac{\unicode[STIX]{x2202}^{2}w}{\unicode[STIX]{x2202}Y^{2}}-{\mathcal{D}}^{2}w+\frac{\unicode[STIX]{x2202}{\mathcal{F}}^{2}}{\unicode[STIX]{x2202}z^{2}}\frac{\unicode[STIX]{x2202}w}{\unicode[STIX]{x2202}Y}\right]\text{d}\unicode[STIX]{x1D6FA}\,\text{d}X\nonumber\\ \displaystyle & & \displaystyle -\int _{0}^{X_{t}}\int _{\unicode[STIX]{x1D6FA}}p^{a}\left[\frac{\unicode[STIX]{x2202}u}{\unicode[STIX]{x2202}X}+\frac{\unicode[STIX]{x2202}\hat{v}}{\unicode[STIX]{x2202}Y}+\frac{\unicode[STIX]{x2202}w}{\unicode[STIX]{x2202}z}\right]\text{d}\unicode[STIX]{x1D6FA}\,\text{d}X,\end{eqnarray}$$
which is a notation that is introduced to avoid repetitions of this quantity in the subsequent equations. In the above equations, the control is applied in specified intervals
 $[X_{0},X_{1}]$
only,
 $\unicode[STIX]{x1D6FA}$
is the cross-section domain
 $[0,\infty ]\times [z_{1},z_{2}]$
ranging from the wall (
 $Y=0$
) to infinity and from
 $z_{1}$
to
 $z_{2}$
in the spanwise direction,
 $\unicode[STIX]{x1D6E4}$
is the wall boundary line for a given
 $X$
,
 $\unicode[STIX]{x1D70F}_{w}$
is the wall shear stress,
 $\unicode[STIX]{x1D70F}_{0}$
is a target shear stress (equal to the value corresponding to the Blasius solution) and
 $[X_{s1},X_{s2}]$
is the interval where the cost function is defined. The last three integrals in (A 1) are used to enforce the boundary condition on
 $v$
, which includes the wall transpiration. If we take the directional derivative of the Lagrangian with respect to
 $p$
, the result is
 $$\begin{eqnarray}\displaystyle \int _{0}^{X_{t}}\int _{\unicode[STIX]{x1D6FA}}\left[v^{a}\frac{\unicode[STIX]{x2202}(\unicode[STIX]{x1D6FF}p)}{\unicode[STIX]{x2202}Y}+w^{a}{\mathcal{D}}(\unicode[STIX]{x1D6FF}p)\right]\,\text{d}\unicode[STIX]{x1D6FA}\,\text{d}X=0. & & \displaystyle\end{eqnarray}$$
Then, by applying an integration by parts in
 $\unicode[STIX]{x1D6FA}$
we obtain
 $$\begin{eqnarray}\displaystyle \int _{0}^{X_{t}}\int _{\unicode[STIX]{x1D6E4}}\left[v^{a}\unicode[STIX]{x1D6FF}p+w^{a}\unicode[STIX]{x1D6FF}p\left(1-\frac{\unicode[STIX]{x2202}{\mathcal{F}}}{\unicode[STIX]{x2202}z}\right)\right]\,\text{d}\unicode[STIX]{x1D6E4}\,\text{d}X-\int _{0}^{X_{t}}\int _{\unicode[STIX]{x1D6FA}}\unicode[STIX]{x1D6FF}p\left(\frac{\unicode[STIX]{x2202}v^{a}}{\unicode[STIX]{x2202}Y}+{\mathcal{D}}w^{a}\right)\,\text{d}\unicode[STIX]{x1D6FA}\,\text{d}X=0 & & \displaystyle \nonumber\\ \displaystyle & & \displaystyle\end{eqnarray}$$
and assuming arbitrary variations of
 $\unicode[STIX]{x1D6FF}p$
, the first adjoint equation is obtained in the form
 $$\begin{eqnarray}\displaystyle \frac{\unicode[STIX]{x2202}v^{a}}{\unicode[STIX]{x2202}Y}+{\mathcal{D}}w^{a}=0\quad \text{on}~[0,X_{t}]\times \unicode[STIX]{x1D6FA}, & & \displaystyle\end{eqnarray}$$
where
 $\unicode[STIX]{x1D6FF}p|_{\unicode[STIX]{x1D6E4}}=0$
.
Next, we take the directional derivative of the Lagrangian with respect to
 $u$
, and obtain
 $$\begin{eqnarray}\displaystyle & & \displaystyle \int _{0}^{X_{t}}\int _{\unicode[STIX]{x1D6FA}}\left[u^{a}\unicode[STIX]{x1D6FF}u\frac{\unicode[STIX]{x2202}u}{\unicode[STIX]{x2202}X}+u^{a}u\frac{\unicode[STIX]{x2202}(\unicode[STIX]{x1D6FF}u)}{\unicode[STIX]{x2202}X}+u^{a}v\frac{\unicode[STIX]{x2202}(\unicode[STIX]{x1D6FF}u)}{\unicode[STIX]{x2202}Y}-\frac{\unicode[STIX]{x2202}{\mathcal{F}}}{\unicode[STIX]{x2202}X}u^{a}\unicode[STIX]{x1D6FF}u\frac{\unicode[STIX]{x2202}u}{\unicode[STIX]{x2202}Y}-\frac{\unicode[STIX]{x2202}{\mathcal{F}}}{\unicode[STIX]{x2202}X}u^{a}u\frac{\unicode[STIX]{x2202}(\unicode[STIX]{x1D6FF}u)}{\unicode[STIX]{x2202}Y}\right.\nonumber\\ \displaystyle & & \displaystyle \qquad -\left.\frac{\unicode[STIX]{x2202}{\mathcal{F}}}{\unicode[STIX]{x2202}z}u^{a}w\frac{\unicode[STIX]{x2202}(\unicode[STIX]{x1D6FF}u)}{\unicode[STIX]{x2202}Y}+u^{a}w\frac{\unicode[STIX]{x2202}(\unicode[STIX]{x1D6FF}u)}{\unicode[STIX]{x2202}z}-u^{a}\frac{\unicode[STIX]{x2202}^{2}(\unicode[STIX]{x1D6FF}u)}{\unicode[STIX]{x2202}Y^{2}}-u^{a}{\mathcal{D}}^{2}(\unicode[STIX]{x1D6FF}u)\right.\nonumber\\ \displaystyle & & \displaystyle \qquad +\left.\frac{\unicode[STIX]{x2202}^{2}{\mathcal{F}}}{\unicode[STIX]{x2202}z^{2}}u^{a}\frac{\unicode[STIX]{x2202}(\unicode[STIX]{x1D6FF}u)}{\unicode[STIX]{x2202}Y}+v^{a}\unicode[STIX]{x1D6FF}u\frac{\unicode[STIX]{x2202}v}{\unicode[STIX]{x2202}X}-\frac{\unicode[STIX]{x2202}{\mathcal{F}}}{\unicode[STIX]{x2202}X}v^{a}\unicode[STIX]{x1D6FF}u\frac{\unicode[STIX]{x2202}v}{\unicode[STIX]{x2202}Y}+2G_{\unicode[STIX]{x1D6EC}}v^{a}u\unicode[STIX]{x1D6FF}u\right.\nonumber\\ \displaystyle & & \displaystyle \qquad +\left.w^{a}\unicode[STIX]{x1D6FF}u\frac{\unicode[STIX]{x2202}w}{\unicode[STIX]{x2202}X}-\frac{\unicode[STIX]{x2202}{\mathcal{F}}}{\unicode[STIX]{x2202}X}w^{a}\unicode[STIX]{x1D6FF}u\frac{\unicode[STIX]{x2202}w}{\unicode[STIX]{x2202}Y}+p^{a}\frac{\unicode[STIX]{x2202}{\mathcal{F}}}{\unicode[STIX]{x2202}X}-\frac{\unicode[STIX]{x2202}{\mathcal{F}}}{\unicode[STIX]{x2202}X}p^{a}\frac{\unicode[STIX]{x2202}(\unicode[STIX]{x1D6FF}u)}{\unicode[STIX]{x2202}Y}\right]\,\text{d}\unicode[STIX]{x1D6FA}\,\text{d}X=0,\end{eqnarray}$$
where terms involving
 $\unicode[STIX]{x2202}{\mathcal{F}}/\unicode[STIX]{x2202}X$
or
 $\unicode[STIX]{x2202}{\mathcal{F}}/\unicode[STIX]{x2202}z$
derive from the dependence of
 $\hat{v}$
on
 $u$
, that is
 $\hat{v}=v-(u\unicode[STIX]{x2202}{\mathcal{F}}/\unicode[STIX]{x2202}X+w\unicode[STIX]{x2202}{\mathcal{F}}/\unicode[STIX]{x2202}z)$
. Integrating by parts in
 $\unicode[STIX]{x1D6FA}$
or
 $[0,X_{t}]$
,
 $$\begin{eqnarray}\displaystyle & & \displaystyle \int _{\unicode[STIX]{x1D6FA}}[(u^{a}u\unicode[STIX]{x1D6FF}u)|_{0}^{X_{t}}+(p^{a}\unicode[STIX]{x1D6FF}u)|_{0}^{X_{t}}]\,\text{d}\unicode[STIX]{x1D6FA}\nonumber\\ \displaystyle & & \displaystyle \qquad +\,\int _{0}^{X_{t}}\int _{\unicode[STIX]{x1D6E4}}\left[u^{a}v\unicode[STIX]{x1D6FF}u-\frac{\unicode[STIX]{x2202}{\mathcal{F}}}{\unicode[STIX]{x2202}X}u^{a}u\unicode[STIX]{x1D6FF}u-\frac{\unicode[STIX]{x2202}{\mathcal{F}}}{\unicode[STIX]{x2202}z}u^{a}w\unicode[STIX]{x1D6FF}u+u^{a}w\unicode[STIX]{x1D6FF}u-u^{a}\frac{\unicode[STIX]{x2202}(\unicode[STIX]{x1D6FF}u)}{\unicode[STIX]{x2202}Y}+\frac{\unicode[STIX]{x2202}u^{a}}{\unicode[STIX]{x2202}Y}\unicode[STIX]{x1D6FF}u\right.\nonumber\\ \displaystyle & & \displaystyle \qquad -\left.u^{a}\frac{\unicode[STIX]{x2202}(\unicode[STIX]{x1D6FF}u)}{\unicode[STIX]{x2202}z}+\frac{\unicode[STIX]{x2202}u^{a}}{\unicode[STIX]{x2202}z}\unicode[STIX]{x1D6FF}u-2\frac{\unicode[STIX]{x2202}{\mathcal{F}}}{\unicode[STIX]{x2202}z}\left[u^{a}\frac{\unicode[STIX]{x2202}(\unicode[STIX]{x1D6FF}u)}{\unicode[STIX]{x2202}Y}-\frac{\unicode[STIX]{x2202}u^{a}}{\unicode[STIX]{x2202}z}\unicode[STIX]{x1D6FF}u\right]+\left(\frac{\unicode[STIX]{x2202}{\mathcal{F}}}{\unicode[STIX]{x2202}z}\right)^{2}\left[u^{a}\frac{\unicode[STIX]{x2202}(\unicode[STIX]{x1D6FF}u)}{\unicode[STIX]{x2202}Y}-\frac{\unicode[STIX]{x2202}u^{a}}{\unicode[STIX]{x2202}Y}\unicode[STIX]{x1D6FF}u\right]\right.\nonumber\\ \displaystyle & & \displaystyle \qquad +\left.\frac{\unicode[STIX]{x2202}^{2}{\mathcal{F}}}{\unicode[STIX]{x2202}z^{2}}u^{a}\unicode[STIX]{x1D6FF}u-\frac{\unicode[STIX]{x2202}{\mathcal{F}}}{\unicode[STIX]{x2202}X}p^{a}\unicode[STIX]{x1D6FF}u\right]\,\text{d}\unicode[STIX]{x1D6E4}\,\text{d}X\nonumber\\ \displaystyle & & \displaystyle \qquad +\,\int _{0}^{X_{t}}\int _{\unicode[STIX]{x1D6FA}}\unicode[STIX]{x1D6FF}u\left[u^{a}\frac{\unicode[STIX]{x2202}u}{\unicode[STIX]{x2202}X}-u\frac{\unicode[STIX]{x2202}u^{a}}{\unicode[STIX]{x2202}X}-v\frac{\unicode[STIX]{x2202}u^{a}}{\unicode[STIX]{x2202}Y}-\frac{\unicode[STIX]{x2202}{\mathcal{F}}}{\unicode[STIX]{x2202}X}u^{a}\frac{\unicode[STIX]{x2202}u}{\unicode[STIX]{x2202}Y}+\frac{\unicode[STIX]{x2202}{\mathcal{F}}}{\unicode[STIX]{x2202}X}u\frac{\unicode[STIX]{x2202}u^{a}}{\unicode[STIX]{x2202}Y}\right.\nonumber\\ \displaystyle & & \displaystyle \qquad +\left.\frac{\unicode[STIX]{x2202}{\mathcal{F}}}{\unicode[STIX]{x2202}z}w\frac{\unicode[STIX]{x2202}u^{a}}{\unicode[STIX]{x2202}Y}-w\frac{\unicode[STIX]{x2202}u^{a}}{\unicode[STIX]{x2202}z}-\frac{\unicode[STIX]{x2202}^{2}u^{a}}{\unicode[STIX]{x2202}Y^{2}}-{\mathcal{D}}^{2}(u^{a})-\frac{\unicode[STIX]{x2202}^{2}{\mathcal{F}}}{\unicode[STIX]{x2202}z^{2}}\frac{\unicode[STIX]{x2202}u^{a}}{\unicode[STIX]{x2202}Y}+v^{a}\frac{\unicode[STIX]{x2202}v}{\unicode[STIX]{x2202}X}-\frac{\unicode[STIX]{x2202}{\mathcal{F}}}{\unicode[STIX]{x2202}X}v^{a}\frac{\unicode[STIX]{x2202}v}{\unicode[STIX]{x2202}Y}+2G_{\unicode[STIX]{x1D6EC}}v^{a}u\right.\nonumber\\ \displaystyle & & \displaystyle \qquad +\left.w^{a}\frac{\unicode[STIX]{x2202}w}{\unicode[STIX]{x2202}X}-\frac{\unicode[STIX]{x2202}{\mathcal{F}}}{\unicode[STIX]{x2202}X}w^{a}\frac{\unicode[STIX]{x2202}w}{\unicode[STIX]{x2202}Y}-\frac{\unicode[STIX]{x2202}p^{a}}{\unicode[STIX]{x2202}X}+\frac{\unicode[STIX]{x2202}{\mathcal{F}}}{\unicode[STIX]{x2202}X}\frac{\unicode[STIX]{x2202}p^{a}}{\unicode[STIX]{x2202}Y}\right]\,\text{d}\unicode[STIX]{x1D6FA}\,\text{d}X=0,\end{eqnarray}$$
where the first integral is obtained from integration by parts in
 $[0,X_{t}]$
, and the second integral is obtained from integration by parts in
 $\unicode[STIX]{x1D6FA}$
; some additional terms have appeared from integrating by parts two times, wherever second derivatives of
 $\unicode[STIX]{x1D6FF}u$
are involved (i.e. for two generic functions
 $f$
and
 $g$
,
 $\int fg^{\prime \prime }\,\text{d}x=fg^{\prime }-f^{\prime }g+\int f^{\prime \prime }g\,\text{d}x$
). Thus, the second adjoint equation is obtained in the form
 $$\begin{eqnarray}\displaystyle & & \displaystyle -u\frac{\unicode[STIX]{x2202}u^{a}}{\unicode[STIX]{x2202}X}-\hat{v}\frac{\unicode[STIX]{x2202}u^{a}}{\unicode[STIX]{x2202}Y}-w\frac{\unicode[STIX]{x2202}u^{a}}{\unicode[STIX]{x2202}z}+u^{a}\frac{\unicode[STIX]{x2202}u}{\unicode[STIX]{x2202}X}+v^{a}\frac{\unicode[STIX]{x2202}v}{\unicode[STIX]{x2202}X}+w^{a}\frac{\unicode[STIX]{x2202}w}{\unicode[STIX]{x2202}X}-\frac{\unicode[STIX]{x2202}{\mathcal{F}}}{\unicode[STIX]{x2202}X}\left(u^{a}\frac{\unicode[STIX]{x2202}u}{\unicode[STIX]{x2202}Y}+v^{a}\frac{\unicode[STIX]{x2202}v}{\unicode[STIX]{x2202}Y}+w^{a}\frac{\unicode[STIX]{x2202}w}{\unicode[STIX]{x2202}Y}\right)\nonumber\\ \displaystyle & & \displaystyle \qquad +\,2G_{\unicode[STIX]{x1D6EC}}uv^{a}-\frac{\unicode[STIX]{x2202}p^{a}}{\unicode[STIX]{x2202}X}+\frac{\unicode[STIX]{x2202}{\mathcal{F}}}{\unicode[STIX]{x2202}X}\frac{\unicode[STIX]{x2202}p^{a}}{\unicode[STIX]{x2202}Y}-\frac{\unicode[STIX]{x2202}^{2}u^{a}}{\unicode[STIX]{x2202}Y^{2}}-{\mathcal{D}}^{2}u^{a}-\frac{\unicode[STIX]{x2202}^{2}{\mathcal{F}}}{\unicode[STIX]{x2202}z^{2}}\frac{\unicode[STIX]{x2202}u^{a}}{\unicode[STIX]{x2202}Y}=0,\end{eqnarray}$$
where
 $\unicode[STIX]{x1D6FF}u|_{\unicode[STIX]{x1D6E4}}=0$
,
 $\unicode[STIX]{x1D6FF}u|_{0}^{X_{t}}=0$
, and its first derivatives with respect to
 $y$
or
 $z$
are zero at the boundaries.
Similarly, the third and the fourth adjoint equations, corresponding to the
 $y$
- and
 $z$
-momentum equations from BRE, are obtained in the form:
 $$\begin{eqnarray}\displaystyle & & \displaystyle -u\frac{\unicode[STIX]{x2202}v^{a}}{\unicode[STIX]{x2202}X}-\hat{v}\frac{\unicode[STIX]{x2202}v^{a}}{\unicode[STIX]{x2202}Y}-w\frac{\unicode[STIX]{x2202}v^{a}}{\unicode[STIX]{x2202}z}+u^{a}\frac{\unicode[STIX]{x2202}u}{\unicode[STIX]{x2202}Y}+v^{a}\frac{\unicode[STIX]{x2202}v}{\unicode[STIX]{x2202}Y}+w^{a}\frac{\unicode[STIX]{x2202}w}{\unicode[STIX]{x2202}Y}-\frac{\unicode[STIX]{x2202}p^{a}}{\unicode[STIX]{x2202}Y}-\frac{\unicode[STIX]{x2202}^{2}v^{a}}{\unicode[STIX]{x2202}Y^{2}}\nonumber\\ \displaystyle & & \displaystyle \qquad -\,{\mathcal{D}}^{2}v^{a}-\frac{\unicode[STIX]{x2202}^{2}{\mathcal{F}}}{\unicode[STIX]{x2202}z^{2}}\frac{\unicode[STIX]{x2202}v^{a}}{\unicode[STIX]{x2202}Y}=0\end{eqnarray}$$
 $$\begin{eqnarray}\displaystyle & & \displaystyle -u\frac{\unicode[STIX]{x2202}w^{a}}{\unicode[STIX]{x2202}X}-\hat{v}\frac{\unicode[STIX]{x2202}w^{a}}{\unicode[STIX]{x2202}Y}-w\frac{\unicode[STIX]{x2202}w^{a}}{\unicode[STIX]{x2202}z}+u^{a}\frac{\unicode[STIX]{x2202}u}{\unicode[STIX]{x2202}z}+v^{a}\frac{\unicode[STIX]{x2202}v}{\unicode[STIX]{x2202}z}+w^{a}\frac{\unicode[STIX]{x2202}w}{\unicode[STIX]{x2202}z}-\frac{\unicode[STIX]{x2202}{\mathcal{F}}}{\unicode[STIX]{x2202}z}\left(u^{a}\frac{\unicode[STIX]{x2202}u}{\unicode[STIX]{x2202}Y}+v^{a}\frac{\unicode[STIX]{x2202}v}{\unicode[STIX]{x2202}Y}+w^{a}\frac{\unicode[STIX]{x2202}w}{\unicode[STIX]{x2202}Y}\right)\nonumber\\ \displaystyle & & \displaystyle \qquad -\,{\mathcal{D}}p^{a}-\frac{\unicode[STIX]{x2202}^{2}w^{a}}{\unicode[STIX]{x2202}Y^{2}}-{\mathcal{D}}^{2}w^{a}-\frac{\unicode[STIX]{x2202}^{2}{\mathcal{F}}}{\unicode[STIX]{x2202}z^{2}}\frac{\unicode[STIX]{x2202}w^{a}}{\unicode[STIX]{x2202}Y}=0\end{eqnarray}$$
respectively. Upon deriving the third adjoint equation (A 9), an expression is obtained for
 $s$
(the Lagrange multiplier with respect to the transpiration condition; see (A 1)) as a result of the integration by parts:
 $$\begin{eqnarray}\displaystyle s=-p^{a}-v^{a}(u+\hat{v}+w)-\left[1+\left(\frac{\unicode[STIX]{x2202}{\mathcal{F}}}{\unicode[STIX]{x2202}z}\right)^{2}\right]v_{Y}^{a}+2\frac{\unicode[STIX]{x2202}{\mathcal{F}}}{\unicode[STIX]{x2202}z}v_{Y}^{a}+\frac{\unicode[STIX]{x2202}^{2}{\mathcal{F}}}{\unicode[STIX]{x2202}z^{2}}v^{a}. & & \displaystyle\end{eqnarray}$$
The initial and boundary conditions associated with the adjoint equations are
 $$\begin{eqnarray}\displaystyle & \displaystyle (u^{a},v^{a},w^{a},p^{a})|_{X=X_{t}}=(0,0,0,0)\quad \text{in}~\unicode[STIX]{x1D6FA}, & \displaystyle\end{eqnarray}$$
 $$\begin{eqnarray}\displaystyle & \displaystyle (u^{a},v^{a},w^{a})|_{\unicode[STIX]{x1D6E4}}=\left\{\begin{array}{@{}ll@{}}(\unicode[STIX]{x1D6FC}(\unicode[STIX]{x1D70F}_{w}-\unicode[STIX]{x1D70F}_{0}),0,0)\quad & \text{for}~X\in [X_{s0},X_{s1}]\\ (0,0,0)\quad & \text{otherwise}\end{array}\right. & \displaystyle\end{eqnarray}$$
and
 $$\begin{eqnarray}\displaystyle (u^{a},v^{a},w^{a},p^{a})|_{Y\rightarrow \infty }=(0,0,0,0). & & \displaystyle\end{eqnarray}$$
In the present study the optimal control is performed with either wall transpiration or wall deformation (and not with both at the same time), so one of the two first integrals is (A 1) is set to zero, depending on the type of control employed (also, the last three integrals in the Lagrangian are not necessary for control based on wall deformation). In this study, the values of the constant factors
 $\unicode[STIX]{x1D6FC}$
,
 $\unicode[STIX]{x1D70E}_{1}$
and
 $\unicode[STIX]{x1D70E}_{2}$
are 1, 0.7 and 0.1, respectively, and the value of
 $\unicode[STIX]{x1D6FC}$
is 1.
Appendix B. Optimality condition for control based on wall transpiration
With wall transpiration,
 $v_{w}$
, considered as the objective variable, the Lagrangian can be written as
 $$\begin{eqnarray}\displaystyle & & \displaystyle {\mathcal{L}}(u,v,w,p,v_{w},u^{a},v^{a},w^{a},p^{a},s)\nonumber\\ \displaystyle & & \displaystyle \quad =\frac{\unicode[STIX]{x1D70E}_{2}}{2}\int _{X_{0}}^{X_{1}}\int _{\unicode[STIX]{x1D6E4}}\left|\frac{\unicode[STIX]{x2202}v_{w}}{\unicode[STIX]{x2202}X}\right|^{2}+|v_{w}|^{2}\,\text{d}\unicode[STIX]{x1D6E4}\,\text{d}X\nonumber\\ \displaystyle & & \displaystyle \qquad -\,\int _{X_{0}}^{X_{1}}\int _{\unicode[STIX]{x1D6E4}}s(v-v_{w})\,\text{d}\unicode[STIX]{x1D6E4}\,\text{d}X-\int _{0}^{X_{0}}\int _{\unicode[STIX]{x1D6E4}}sv\,\text{d}\unicode[STIX]{x1D6E4}\,\text{d}X-\int _{X_{1}}^{X_{t}}\int _{\unicode[STIX]{x1D6E4}}sv\,\text{d}\unicode[STIX]{x1D6E4}\,\text{d}X+{\mathcal{H}},\end{eqnarray}$$
where the norm
 $\Vert ~\Vert$
is replaced by the absolute value since
 $v_{w}$
and
 $\unicode[STIX]{x1D70F}_{w}$
are real functions. If we take the directional derivative of the Lagrangian with respect to
 $v_{w}$
, the result is
 $$\begin{eqnarray}\displaystyle \int _{X_{0}}^{X_{1}}\int _{\unicode[STIX]{x1D6E4}}\left[\frac{\unicode[STIX]{x2202}v_{w}}{\unicode[STIX]{x2202}X}(\unicode[STIX]{x1D6FF}v_{w})_{X}+v_{w}\unicode[STIX]{x1D6FF}v_{w}+s\unicode[STIX]{x1D6FF}v_{w}\right]\,\text{d}\unicode[STIX]{x1D6E4}\,\text{d}X=0. & & \displaystyle\end{eqnarray}$$
Then, the application of an integration by parts in
 $[X_{0},X_{1}]$
about the first term in (B 2) yields
 $$\begin{eqnarray}\displaystyle & & \displaystyle \int _{\unicode[STIX]{x1D6E4}}\left[\frac{\unicode[STIX]{x2202}v_{w}}{\unicode[STIX]{x2202}X}\unicode[STIX]{x1D6FF}v_{w}|_{X_{1}}-\frac{\unicode[STIX]{x2202}v_{w}}{\unicode[STIX]{x2202}X}\unicode[STIX]{x1D6FF}v_{w}|_{X_{0}}\right]\,\text{d}\unicode[STIX]{x1D6E4}\nonumber\\ \displaystyle & & \displaystyle \quad +\,\int _{X_{0}}^{X_{1}}\int _{\unicode[STIX]{x1D6E4}}\left[-\frac{\unicode[STIX]{x2202}^{2}v_{w}}{\unicode[STIX]{x2202}X^{2}}\unicode[STIX]{x1D6FF}v_{w}+v_{w}\unicode[STIX]{x1D6FF}v_{w}+s\unicode[STIX]{x1D6FF}v_{w}\right]\,\text{d}\unicode[STIX]{x1D6E4}\,\text{d}X=0\end{eqnarray}$$
so the optimality equation for
 $v_{w}$
is obtained in the form
 $$\begin{eqnarray}\displaystyle \frac{\unicode[STIX]{x2202}^{2}v_{w}}{\unicode[STIX]{x2202}X^{2}}-v_{w}=\frac{1}{\unicode[STIX]{x1D70E}_{2}}\left(p^{a}+\frac{\unicode[STIX]{x2202}v^{a}}{\unicode[STIX]{x2202}Y}\right), & & \displaystyle\end{eqnarray}$$
satisfying the boundary conditions
 $$\begin{eqnarray}\displaystyle \frac{\unicode[STIX]{x2202}v_{w}}{\unicode[STIX]{x2202}X}(X_{0})=0,\quad \frac{\unicode[STIX]{x2202}v_{w}}{\unicode[STIX]{x2202}X}(X_{1})=0, & & \displaystyle\end{eqnarray}$$
where
 $s$
is given by (A 11), with
 $u=\hat{v}=w=0$
at the wall, and
 ${\mathcal{F}}=0$
.
Appendix C. Optimality condition for control based on wall deformation
In the case of control based on wall deformation, the Lagrangian is given as
 $$\begin{eqnarray}\displaystyle {\mathcal{L}}(u,v,w,p,{\mathcal{F}},u^{a},v^{a},w^{a},p^{a},s)=\frac{\unicode[STIX]{x1D70E}_{1}}{2}\int _{X_{0}}^{X_{1}}\int _{\unicode[STIX]{x1D6FA}}\left|\frac{\unicode[STIX]{x2202}{\mathcal{F}}}{\unicode[STIX]{x2202}X}\right|^{2}+|{\mathcal{F}}|^{2}\,\text{d}\unicode[STIX]{x1D6FA}\,\text{d}X+{\mathcal{H}}, & & \displaystyle\end{eqnarray}$$
where there is no component associated with the boundary conditions since the wall deformation enters the problem through a Prandtl transformation (the functional
 ${\mathcal{F}}$
describing the wall deformations is a multiplicative factor in the state equations).
By taking the directional derivative with respect to
 ${\mathcal{F}}$
, the optimality condition in this case is obtained as
 $$\begin{eqnarray}\displaystyle & & \displaystyle \unicode[STIX]{x1D70E}_{1}\frac{\unicode[STIX]{x2202}^{2}{\mathcal{F}}}{\unicode[STIX]{x2202}X^{2}}-2\left(\frac{\unicode[STIX]{x2202}u^{a}}{\unicode[STIX]{x2202}z}\frac{\unicode[STIX]{x2202}^{2}u}{\unicode[STIX]{x2202}Y^{2}}+\frac{\unicode[STIX]{x2202}v^{a}}{\unicode[STIX]{x2202}z}\frac{\unicode[STIX]{x2202}^{2}v}{\unicode[STIX]{x2202}Y^{2}}+\frac{\unicode[STIX]{x2202}w^{a}}{\unicode[STIX]{x2202}z}\frac{\unicode[STIX]{x2202}^{2}w}{\unicode[STIX]{x2202}Y^{2}}\right)\frac{\unicode[STIX]{x2202}{\mathcal{F}}}{\unicode[STIX]{x2202}z}-\unicode[STIX]{x1D70E}_{1}{\mathcal{F}}\nonumber\\ \displaystyle & & \displaystyle \quad =\left(\frac{\unicode[STIX]{x2202}^{2}u^{a}}{\unicode[STIX]{x2202}z^{2}}\frac{\unicode[STIX]{x2202}u}{\unicode[STIX]{x2202}Y}+\frac{\unicode[STIX]{x2202}^{2}v^{a}}{\unicode[STIX]{x2202}z^{2}}\frac{\unicode[STIX]{x2202}v}{\unicode[STIX]{x2202}Y}+\frac{\unicode[STIX]{x2202}^{2}w^{a}}{\unicode[STIX]{x2202}z^{2}}\frac{\unicode[STIX]{x2202}w}{\unicode[STIX]{x2202}Y}\right)-2\left(\frac{\unicode[STIX]{x2202}u^{a}}{\unicode[STIX]{x2202}z}\frac{\unicode[STIX]{x2202}^{2}u}{\unicode[STIX]{x2202}Yz}+\frac{\unicode[STIX]{x2202}v^{a}}{\unicode[STIX]{x2202}z}\frac{\unicode[STIX]{x2202}^{2}v}{\unicode[STIX]{x2202}Yz}+\frac{\unicode[STIX]{x2202}w^{a}}{\unicode[STIX]{x2202}z}\frac{\unicode[STIX]{x2202}^{2}w}{\unicode[STIX]{x2202}Yz}\right)\nonumber\\ \displaystyle & & \displaystyle \qquad -\left(u\frac{\unicode[STIX]{x2202}u^{a}}{\unicode[STIX]{x2202}X}+w\frac{\unicode[STIX]{x2202}u^{a}}{\unicode[STIX]{x2202}z}\right)\frac{\unicode[STIX]{x2202}u}{\unicode[STIX]{x2202}Y}-\left(u\frac{\unicode[STIX]{x2202}v^{a}}{\unicode[STIX]{x2202}X}+w\frac{\unicode[STIX]{x2202}v^{a}}{\unicode[STIX]{x2202}z}\right)\frac{\unicode[STIX]{x2202}v}{\unicode[STIX]{x2202}Y}-\left(u\frac{\unicode[STIX]{x2202}w^{a}}{\unicode[STIX]{x2202}X}+w\frac{\unicode[STIX]{x2202}w^{a}}{\unicode[STIX]{x2202}z}\right)\frac{\unicode[STIX]{x2202}w}{\unicode[STIX]{x2202}Y}\nonumber\\ \displaystyle & & \displaystyle \qquad -\,\frac{\unicode[STIX]{x2202}p^{a}}{\unicode[STIX]{x2202}X}\frac{\unicode[STIX]{x2202}u}{\unicode[STIX]{x2202}Y}-\frac{\unicode[STIX]{x2202}p^{a}}{\unicode[STIX]{x2202}z}\frac{\unicode[STIX]{x2202}w}{\unicode[STIX]{x2202}Y}+\frac{\unicode[STIX]{x2202}w^{a}}{\unicode[STIX]{x2202}z}\frac{\unicode[STIX]{x2202}p}{\unicode[STIX]{x2202}Y}\end{eqnarray}$$
subjected to boundary conditions
 $$\begin{eqnarray}\displaystyle \frac{\unicode[STIX]{x2202}{\mathcal{F}}}{\unicode[STIX]{x2202}X}(X_{0})=0,\quad \frac{\unicode[STIX]{x2202}{\mathcal{F}}}{\unicode[STIX]{x2202}X}(X_{1})=0. & & \displaystyle\end{eqnarray}$$
Equation (C 2) is applied at the wall, where
 $u=v=w=0$
and
 $u_{a}=v_{a}=w_{a}=0$
, except
 $u_{a}=\unicode[STIX]{x1D6FC}(u_{Y}-\unicode[STIX]{x1D70F}_{0})$
in the interval
 $[X_{s0},X_{s1}]$
. Thus, the optimality equation becomes:
 $$\begin{eqnarray}\displaystyle \unicode[STIX]{x1D70E}_{1}\frac{\unicode[STIX]{x2202}^{2}{\mathcal{F}}}{\unicode[STIX]{x2202}X^{2}}-2\frac{\unicode[STIX]{x2202}u^{a}}{\unicode[STIX]{x2202}z}\frac{\unicode[STIX]{x2202}^{2}u}{\unicode[STIX]{x2202}Y^{2}}\frac{\unicode[STIX]{x2202}{\mathcal{F}}}{\unicode[STIX]{x2202}z}-\unicode[STIX]{x1D70E}_{1}{\mathcal{F}}=\frac{\unicode[STIX]{x2202}^{2}u^{a}}{\unicode[STIX]{x2202}z^{2}}\frac{\unicode[STIX]{x2202}u}{\unicode[STIX]{x2202}Y}-2\frac{\unicode[STIX]{x2202}u^{a}}{\unicode[STIX]{x2202}z}\frac{\unicode[STIX]{x2202}^{2}u}{\unicode[STIX]{x2202}Yz}-\frac{\unicode[STIX]{x2202}p^{a}}{\unicode[STIX]{x2202}X}\frac{\unicode[STIX]{x2202}u}{\unicode[STIX]{x2202}Y}-\frac{\unicode[STIX]{x2202}p^{a}}{\unicode[STIX]{x2202}z}\frac{\unicode[STIX]{x2202}w}{\unicode[STIX]{x2202}Y}. & & \displaystyle\end{eqnarray}$$
Appendix D. Sensitivity of the results to the streamwise resolution
In figure 22, we show the sensitivity of vortex energy distribution as a function of
 $X$
to the grid spacing in the streamwise direction (
 $N_{x}$
is the number of grid points in this direction).
Vortex energy as a function of
 $X$
calculated using different grid spacings in the
 $X$
direction.