

1. Introduction
While earlier studies on host country determinants of Foreign Direct Investment (FDI) have mainly focused on economic variables,Footnote 1 recent research begins to take into account the effect of political factors, such as military power, economic dominance, and diplomatic relations.Footnote 2 However, one of the noticeable gaps in this stream of research is that it does not consider U.S. global dominance and its impact on global FDI distribution. Despite the fact that U.S. global political dominance and its advocated economic globalization have defined the post-Cold War international political landscape,Footnote 3 the interactions between U.S. international coercive power and Chinese economic decisions have been rarely examined in the literature. Given China's emerging and unique position in the international political and economic landscape, we theorize a strong relationship between U.S. political influence and the current global distribution of Chinese outward foreign direct investment (OFDI).
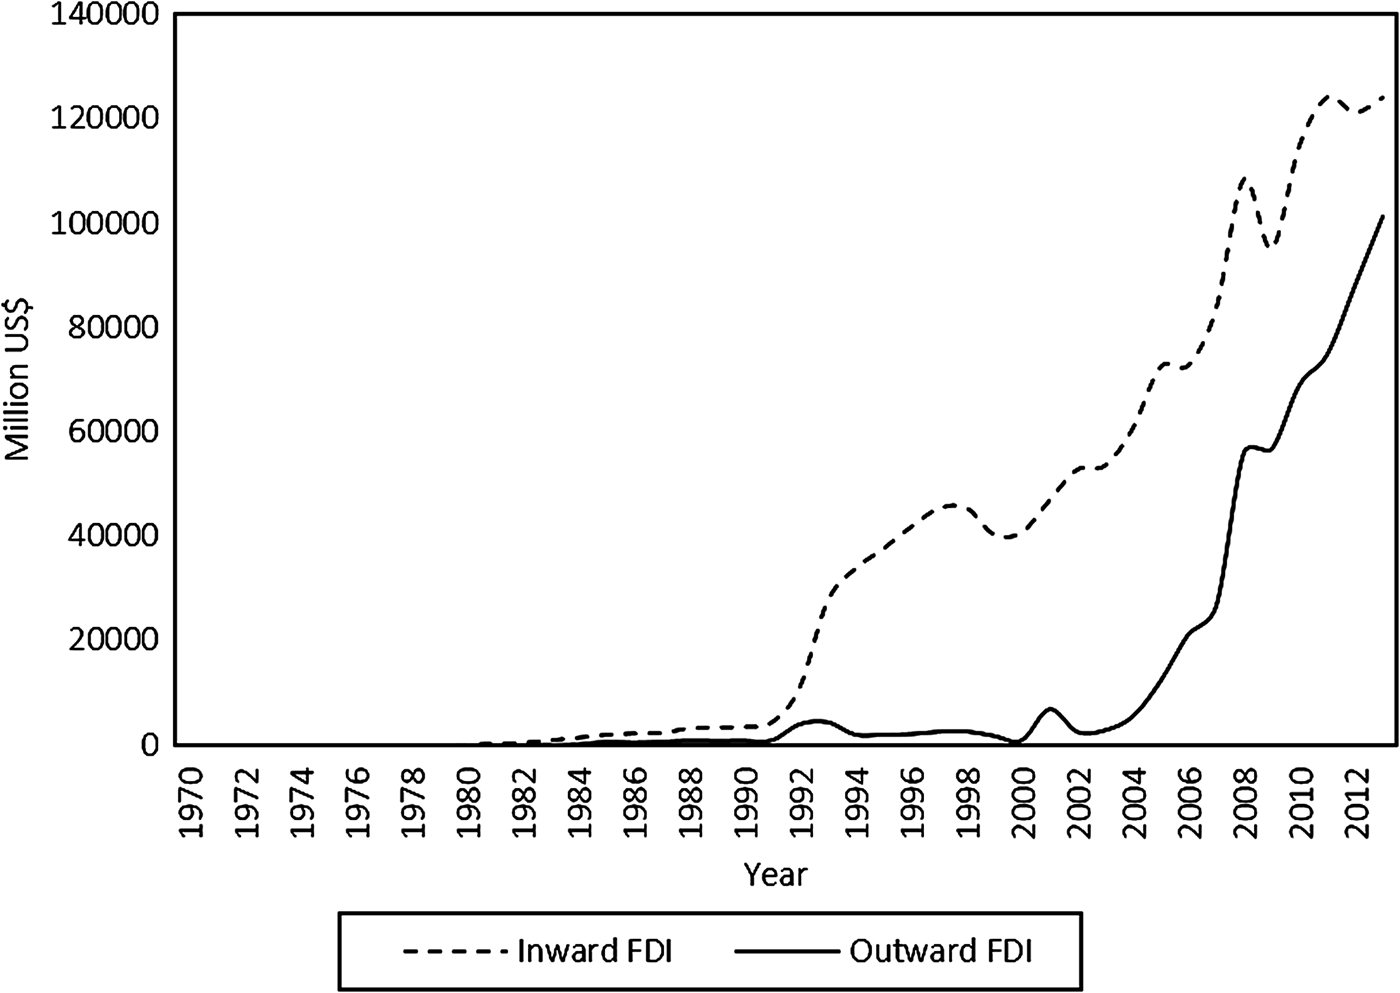
China has engaged in economic globalization in recent decades as no other country in the world has. Since 2013, it has been the largest trading country in the world, and the second largest country in terms of GDP, which makes it a central actor in understanding contemporaneous international political economy.Footnote 4 One of the components of China's growing power, as well as its increasing integration into the global economy, rests on its OFDI. Although China only recently became a source of FDI, the United Nations Conference on Trade and Development (UNCTAD) predicted that China would become the second largest source investment after the United States in 2015.Footnote 5 The official policy, labeled as the “Going Global” policy, is the result of strong political will from the central Chinese government and has shifted China from a passive receipt of inward FDI to an active source of OFDI in the last decade (Figure 1). Our period of study (2005–2010) captures the “boom” in Chinese OFDI.
Evolution of Chinese OFDI

The most widely cited literature on China's OFDI has focused on the traditional economic, institutional, and geographical factors of FDI.Footnote 6 Although the role of bilateral political relations in bilateral trade and investment flows is considered in political economy literature,Footnote 7 and in recent studies in international business literature,Footnote 8 how the global political structure, such as U.S. hegemony, may influence bilateral investment flows between two countries remains an under-studied area that links political science and international business theories.
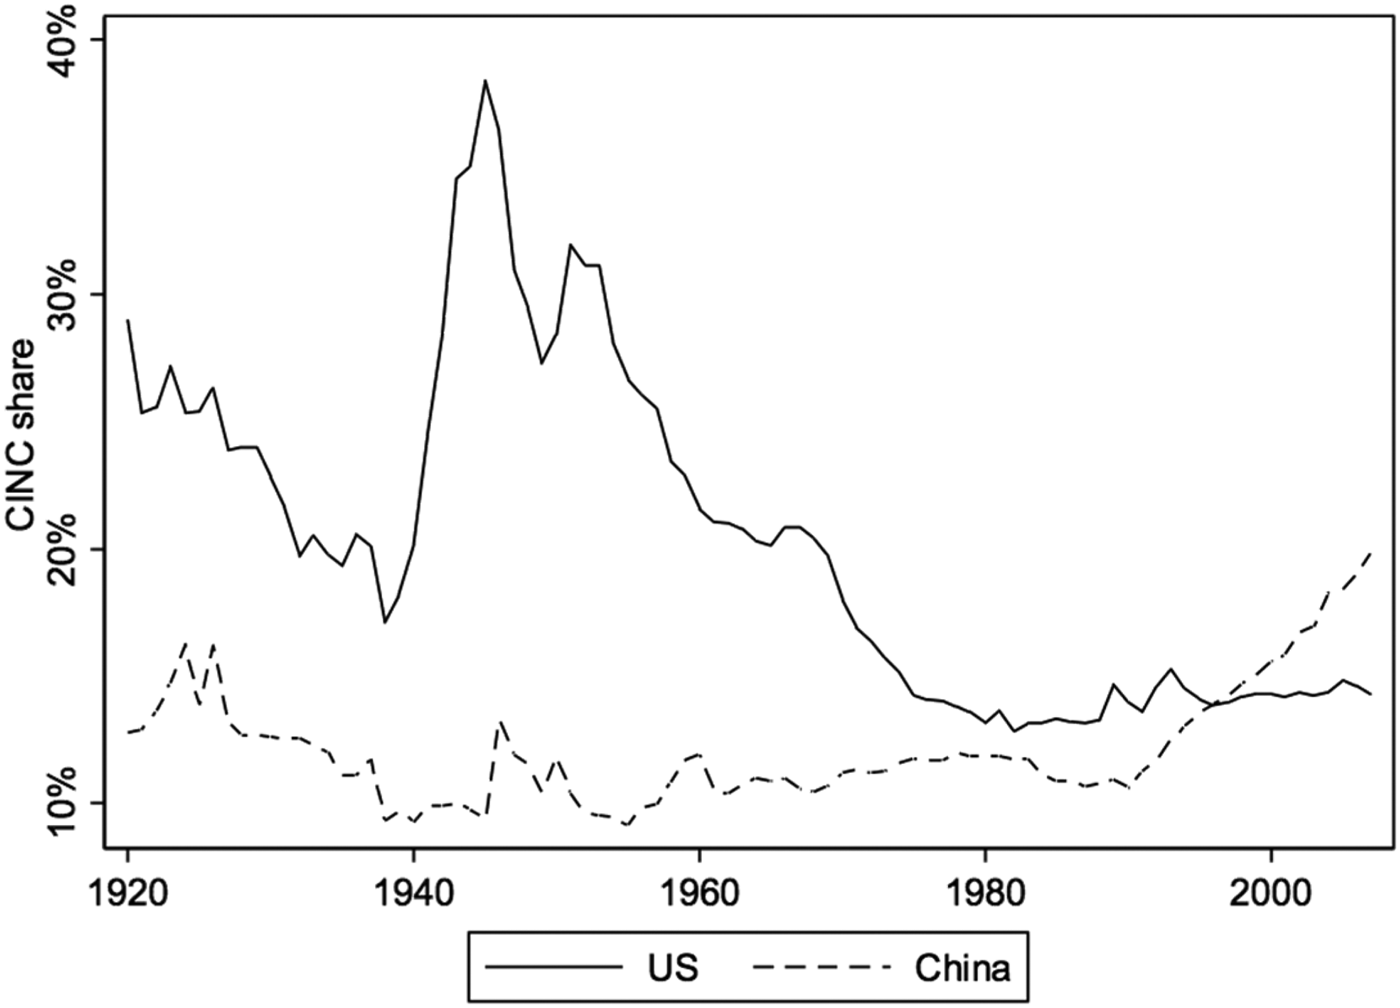
It is clear that U.S. hegemonic power has gradually declined in recent decades. For example, the Composite Index of National Capability (CINC) has demonstrated an ever-increasing converging position of China toward that of United States over the course of last sixty years (Figure 2). Although China does not have the overwhelming military means that the United States has, its growing economic power renders it a future threat to American hegemony. For example, China's One Belt, One Road project (丝绸之路经济带和 21 世) can be understood as an alternative to the Trans-Pacific Partnership (TPP) and the Transatlantic Trade and Investment Partnership (TTIP).Footnote 9 Also, the project for the construction of the Nicaragua Canal,Footnote 10 financed by a Chinese company, could be interpreted as an alternative to the Panama Canal, which is under strong influence of the United States.Footnote 11
Evolution of the CINC indicator

Theoretically, we adopt the soft balancing concept, and hypothesize that China tends to locate less (more) investment in host countries that have strong (weak) political proximity with the United States; we also contend that this tendency is stronger the larger the state control within the company. China's OFDI provides us with a unique opportunity to empirically assess the influence of the United States on the trajectories of emerging powers’ integration into the world economy, since party–business relations increasingly influence decision-making processes and policy outcomes in the Chinese polity.Footnote 12
Our finding provides empirical substance to the notion that China used foreign investment as an economic diplomacy tool as suggested in several publications.Footnote 13 We have attained supportive results using several sources of data and different model specifications. Our results are robust to two falsification tests, which we will discuss shortly.
We contribute to empirical studies on political drivers of investment in general, and those on Chinese OFDI specifically. Our evidence regarding the strategic avoidance of Chinese investment in countries under strong U.S. influence may not be generalizable to OFDI from countries at the global political periphery, but it does affirm a political economic view that considers that the role of global, political hierarchical structures on the economic expansion of large nations remains relevant, and could become more complex if U.S. hegemony continues to decline, paving the way to a multi-polar political landscape in the future.
The remainder of the paper is organized as follows. In the next section, we outline the key literature on Chinese OFDI. We then build up our hypothesis integrating the soft balancing behavior in international relations with the relationship between Chinese state control and political goals of multinational enterprises (MNEs). We explain our empirical strategy in the following section. The empirical results are then presented and discussed. We conclude the paper with theoretical reflections and policy discussions.
2. Literature review and hypothesis development
The political proximity between two countries is capable of affecting their foreign investment, which can in turn foster political proximity. According to Sauvant and Chen,Footnote 14 the Chinese government shifted from restricting to facilitating, supporting, and then encouraging OFDI. After the “Going Global” policy was formalized in March 2000 during the Third Plenum of the 9th National People's Congress, in December 2001, the State Planning Commission (SPC) released the 10th FDI Five-Year Plan.
Furthermore, in 2003, the Asset Supervision and Administration Commission of the State Council (SASAC) was established during the 10th National People's Congress as a primary government institution responsible for managing the nation's state-owned assets and leading the Chinese expansion abroad.Footnote 15 State control over MNEs is expected to produce political outcomes. Politics driving FDI is more attainable in a country with 170 large, state-owned enterprises (SOEs) controlled by a single institution and with access to public financing to expand abroad. As Naughton puts it “if we call the distinctive Chinese system that has emerged over the last three decades ‘state capitalism’, then SASAC is one of the key transmission belts in that system, since it is the institution through which the state manages its capital.” Footnote 16
However, the institutional array is more complex than just the creation of SASAC and includes national banks, local and provincial institutions, and special commissions.Footnote 17 As an illustrative example, in October 2004, China's State Development and Reform Commission (SDRC) and the Export–Import (EXIM) Bank issued a circular to promote (1) resource exploration projects to mitigate the domestic shortage of natural resources, (2) projects that encourage the export of domestic technologies, products, equipment, and labor, (3) overseas R&D centers to utilize internationally advanced technologies, managerial skills, and professional contacts, and (4) mergers and acquisitions that could enhance the international competitiveness of Chinese enterprises, accelerating their entry into foreign markets.
To stimulate these selected types of OFDI, the Chinese government offered firms preferential credit for these specifically promoted FDI.Footnote 18 Furthermore, through the nomenklatura system, the Party controls “the appointment of the CEOs and presidents of the most important of these enterprises and manages a cadre transfer system which makes it possible to transfer/rotate business leaders to take up positions in state and Party agencies.”Footnote 19 As a result, “the Chinese political leadership, which in the 1990s viewed the SOEs as a problem to be fixed, now increasingly views the same firms as convenient instruments that can help in the achievement of national goals.”Footnote 20
Following the existing political economy literature, we assume three reasons that can explain how political proximity may directly affect investment by: (a) lowering information costs,Footnote 21 (b) reducing expropriation risk,Footnote 22 and (c) lowering bureaucratic barriers.Footnote 23 In fact, these authors investigate whether bilateral political relations can explain investment and trade flows from the United States and find that countries experiencing deteriorating political relations with the United States exhibit lower FDI flows into the United States and that the United States tends to invest less in unfriendly countries.
It is likely that political proximity increased the ease and convenience of investing for Chinese MNEs because of the preferential policies established by the central government.Footnote 24 However, could political proximity to the United States work as a deterrent for Chinese investment? The objective of our research is to build on the arguments of the above mentioned authors to determine whether political proximity to the United States may act as a host-country deterrent of Chinese outward investment during the initial years of the “Going Global” policy.
The Hegemonic Stability Theory proposed by neo-realists suggests that the preponderance of power held by a state allows it to offer incentives, both positive and negative, to other states to agree to participation within a hegemonic order, thus creating international stability.Footnote 25 This stable hegemonic order disappears, however, if another state grows strong enough to challenge the hegemon. Therefore, as time passes, the “distribution of power shifts, leading to conflicts and ruptures in the system, hegemonic war, and the eventual reorganization of order so as to reflect the new distribution of power capabilities.”Footnote 26
China's growth has sparked two opposing views on its geopolitical consequences. One view is that China is a growing security threat that could eventually challenge American geopolitical dominance, first in Southeast Asia and later in other regions, such as Africa and Latin America.Footnote 27 This line of argument sees China a new USSR, and hypothesizes a geopolitical order evolving to a proto-bipolarism and increasing Chinese business in Africa and Latin America as direct challenges to U.S. global dominance.
On the other hand, there is a view that China is still preoccupied with securing a more comfortable and decent life for its people,Footnote 28 and therefore its rise will continue to be pragmatically and economically driven, prioritizing domestic-development outcomes.Footnote 29 From this perspective, the Chinese power is seen as merely economic, thus scholars often compare it not with the former USSR but with the case of Japan in the 1980s when its economic growth was thought to challenge U.S. power but eventually the concern was vanished.Footnote 30
The more recent soft balancing conceptualization offers an alternative and intermediate explanation by stating that major powers, such as China, are likely to adopt actions that do not directly challenge U.S. military preponderance but use non-military tools to delay, frustrate, and undermine aggressive unilateral U.S. politics.Footnote 31 These tactics of soft balancing are intended to distract and wear down a dominant power rather than out-muscle it.Footnote 32
Although soft balancing may be unable to prevent the United States from achieving specific military aims in the near term, “it will increase the costs of using U.S. power, reduce the number of countries likely to cooperate with future U.S. military adventures, and possibly shift the balance of economic power against the United States.”Footnote 33 These characterizations converge with other scholars’ analysis. Swaine, Daly, and Greenwood argue that China's foreign policy during this period was driven by a “calculative strategy,” characterized “by a non-ideological approach focused on market-led economic growth and the maintenance of amicable international political relations with all states, especially the major powers, to counterweigh the U.S. dominance.”Footnote 34
China has, in theory, two ways to pursue its foreign policy goals: hard balancing or soft balancing. The former implies strengthening power through domestic military buildups or through external alliance formation. This is the traditional means of balancing, also called military balancing. However, when two states enjoy a close economic relationship, hard balancing against each other would prove very costly for them. “Hard balancing will increase enmity and hostility between two states and consequently hurt economic ties and social well-being. High economic interdependence thus reduces the incentive for two states to hard balance each other”.Footnote 35 When it comes to the United States, with which it has an enormous economic interdependence (the United States is the main trading partner of China, and China holds an enormous portion of the former's foreign debt), hard balancing may prove extremely costly. “The other way for a state to increase its relative power is to undermine the power and constrain the influence of the threatening state without direct military confrontation.”Footnote 36 This type of balancing behavior can be called soft balancing, and it is the object of our paper.
In the same direction, Goldstein argues that China has built a “Grand Strategy” to engineer the country's rise to the status of a true global power that shapes, rather than simply responds to, current international systems. To do so, it has been cultivating partnerships in an attempt to cope with the constraints of U.S. power and to hasten the advent of an international system in which the United States would no longer be so dominant. “Chinese spokesmen regularly emphasized that these partnerships were both a reflection of the transition to multi-polarity,”Footnote 37 and an attempt to avoid the idea of bipolarism.
The political economy view proposed here is not common in studies of OFDI, or specific studies on that from China, which have predominantly focused on economic, institutional, and geographic factors.Footnote 38 Although a few studies have adopted a more political economy view, such as Duanmu,Footnote 39 they primarily develop their analytical framework in a bilateral context, namely, how the home-host country relationship influences investment flows, thereby ignoring how the global hierarchical political structure, i.e., U.S. international dominance, may have influenced investment behavior.
We contribute to this gap by hypothesizing that the global distribution of China's OFDI should be such that countries under greater U.S. political proximity will receive less investment because China uses FDI as a means for soft balancing. Such a strategy also enhances China's ability to craft its own model of political and economic development, and to make itself “an attractive partner,” especially in a world in which the United States is seen as an overbearing power.Footnote 40
Some examples of China's strategy are its efforts to build “strategic partnerships” with main allies that involve trade, investment and scientific cooperation,Footnote 41 and the soft-power approach in Africa, which has caught great academic attention.Footnote 42 The first hypothesis of this paper is:
H1:
Ceteris paribus, the stronger (weaker) U.S. political proximity the host country, the less (more) China's OFDI that the country received during “Going Global” policy.
Chinese firms remain substantially influenced by the political agenda of the central government,Footnote 43 although they are much more independent than they were forty years ago. State owned enterprises (SOEs) are particularly subject to political impositions because they usually operate as the spearheads of a developmental and geopolitical vision that emanates primarily from the central state.Footnote 44 We have mentioned the role that SASAC plays on SOEs as it's the primary government institution responsible for managing the nation's state-owned assets and leading Chinese expansion abroad.Footnote 45 Consequently, SOEs—in and perhaps beyond China—often carry non-economic goals in their overseas investment,Footnote 46 such as securing energy to fuel domestic economic growth,Footnote 47 accessing advanced technologies, and increasing geopolitical influence.Footnote 48
We believe that the Chinese government exerts its influence on SOEs through both positive incentives, such as those delineated in the Countries and Industries for Overseas Investment Guidance Catalogue or the nomenklatura system, and negative incentives. For instance, MOFCOM has sensitivity criteria for prohibiting investments that jeopardize bilateral diplomatic relations and/or violate bilateral agreements.Footnote 49 In addition, “MOFCOM consults Chinese embassies or consulates in host countries, and investment are reviewed if the country was on a MOFCOM ‘blacklist’ or if the proposed investment would affect the interests of a third country.”Footnote 50
In terms of positive incentives, SOEs often receive extensive support from the state government in their overseas expansion, including access to state financial and political protection for their operations in risky environments.Footnote 51 The political affiliation of SOEs with the state is likely to make their investment abroad much more sensitive to the host country's relation with the United States than in cases where the state does not impose its influence.
By contrast, Chinese privately owned enterprises (POEs), although also under political influence, are usually driven by “institutional escapism” to avoid competitive disadvantages incurred by operating exclusively in the domestic market. This view suggests that POEs are sometimes pushed abroad because of a poor institutional environment at home, including rampant corruption, regulatory uncertainty, under-developed intellectual property rights protection, and government interference, among other factors.Footnote 52 This is in stark contrast with their state counterparts, which enjoy a variety of advantages, such as easy access to strategic resources, political support and finance, and monopolistic incumbent positions at home that can support their foreign expansion.Footnote 53
Having discussed in depth the literature, we formalize the second hypothesis as follows:
H2:
The proposed relationship in H1 is stronger for firms with state control.
3. Methodology
We use both country and firm level data to investigate our hypotheses. This is mainly driven by the fact that our country level data has certain limits and potential bias, which we will discuss shortly. By using firm level data as complements, we wish to establish robustness of our analysis with data as well as a method triangulation.
3.1 Measurement of independent variables
We proxy “Political proximity with U.S.” with the share of common votes of the host country with the United States on important issues at the United Nations General Assembly (UNGA).Footnote 54 The data was retrieved from the unclassified reports to Congress from the U.S. State Department, and the criteria for differentiating important from non-important votes was defined by the State Department. We believe that important ones are those to which the State Department gave more importance, thus, they better reflect political alignments.
Gupta and Yu apply this proxy for political proximity and find a positive relationship between voting convergence and FDI flows from the United States and its partners.Footnote 55 This variable has also been analyzed in other contexts, indicating a positive, statistically significant effect on the relationship between World Bank and IMF loans and countries whose voting patterns are more similar to G7 countries.Footnote 56 In addition, a statistically significant relationship is observed between larger amounts of financial aid from the United States and recipients that voted in line with the United States at the UNGA.Footnote 57 Finally, Duanmu tests UNGA convergence with China to test whether political proximity to China lead to a larger amount of Chinese investment.Footnote 58
To measure the degree of state control over each company, we used the Chinese state's equity share, which can range from 0 to 100 percent. In our sample it has a mean of 25 percent. We used a dummy variable, which assumes the value of “1” if state equity is 50 percent or above, “0” otherwise. We use this dummy variable to make sure that we are measuring majoritarian state influence over a firm. Fifty-three percent of our firm level observations have 50 percent state equity or above.
The selection of our control variables is primarily based on Duanmu.Footnote 59 We have included country-level variables: geographical distance, GDP, exchange rate, natural resource endowments, exports to China, political proximity to China and size of the Chinese diaspora in the host country, as well as year fixed effects. Firm level variables are age, profitability, and total assets.
We outline the main rationales of these control variables in our estimation. For country level controls, domestic market size is the most commonly considered determinant of FDI and has proven to be a robust determinant across studies of Chinese FDI. A country with a large market likely attracts FDI, “as such investment promotes economies of scale in terms of production and distribution.”Footnote 60 The proxy used to test for market size is the host-country's GDP.
Natural resources have been extensively discussed to be one of the motives of China's outward FDI, although a more refined analysis shows that natural resources only matter in some resource-related industries.Footnote 61 Literature typically used host-country exports of ores and minerals.Footnote 62 We added to the exports of ores and minerals the export of oil and gas derivatives, as energy resources have proven to be key for Chinese FDI allocation.Footnote 63
Furthermore, we control for the export dependence of other countries on China, measured by the ratio of the country's export to China with its total export to the world. We draw export data from Trademap, and Mongolia scores the highest with an average value of a staggering 75 percent of export dependence on China during the period. Other countries heavily relying on the Chinese market as their export destinations include Sudan (72 percent), North Korea (54 percent), and the Democratic Republic of Congo (42 percent). A control for the exchange rate of the host country is considered because strong Yuan means greater purchasing power abroad, which could be another incentive for outbound investment.Footnote 64 We also include geographic distance as a common controller in FDI models, despite its ambiguous impact on FDI.Footnote 65
Finally, we included a control for the Chinese diasporas abroad. Literature has found that persistent ethnic network effects can be explained by their functional capabilities such as promoting information flows.Footnote 66 Additionally, we believe that the presence of Chinese ethnic networks in a host country may generate natural “legitimacy” for investors, who tend to cluster in countries/locations with their peers from the same home country, also called “country of origin agglomeration” because of the rich information flows as well as fertile collaboration opportunities.Footnote 67 It is noted that we include the control for political relations with China, proxied with the convergence in votes at UNGA with China, since it is shown to be an important antecedent of Chinese OFDI in Duanmu.Footnote 68
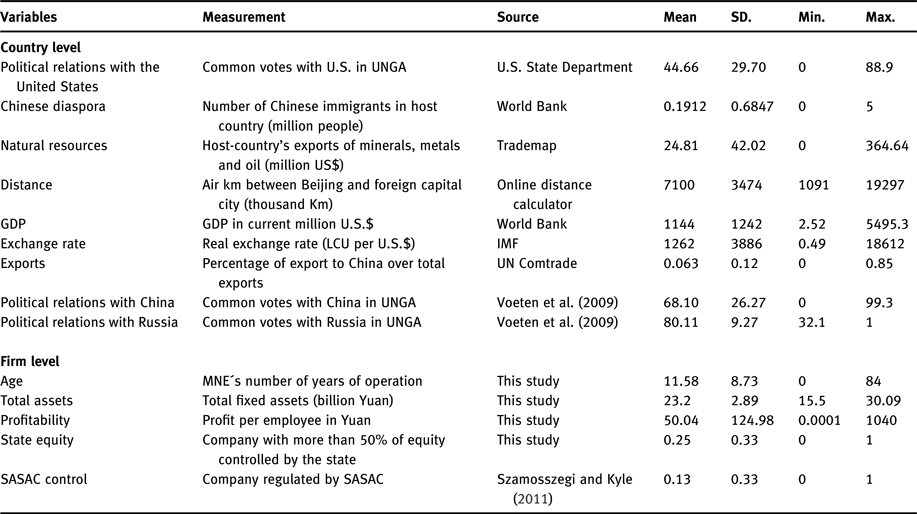
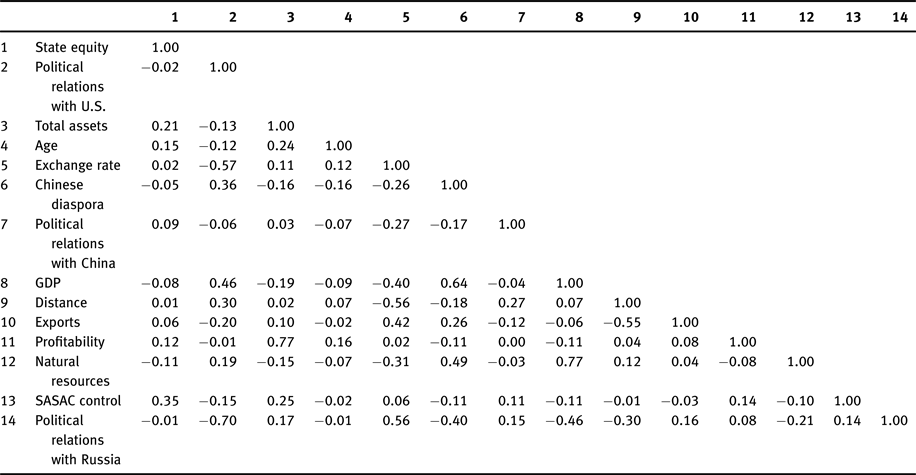
Regarding the firm-level controls, we sought parent information from Global Business, GTA Information Technology, which is a commercial database company based in Hong Kong. We matched observations for which parent information was available and included controls for MNEs’ fixed assets, years in business and profit value scaled by number of employees. Past studies have demonstrated that these factors influence the decision and the scale of FDI.Footnote 69 The summary of key variables is presented in Table 1. A correlation matrix of the key variables is presented in Table 2. We find no issue of multicollinearity in our datasets.
Descriptive statistics for the variables and their definitions

Correlations matrix of key variables

3.2 Dependent variables and model specification
3.2.1 Country level data and estimation method
First, we retrieved country-level Chinese OFDI between 2005 and 2010 from China's Global Investment Tracker compiled by the Heritage Foundation.Footnote 70 This is an open source database that excludes tax havens such as Hong Kong, the British Virgin Islands, and the Cayman Islands and only considers final destinations rather than transit points of China's OFDI. This has a significant impact on the estimates, as more than 70 percent of China's OFDI goes to tax havens.Footnote 71 There are sixty-six countries that have received positive amounts of Chinese FDI in this period; therefore, we have constructed a balanced panel data for estimations.
While data on FDI from OECD countries does not raise much concern, country-level databases on Chinese FDI is often subject to criticism as they are built not from governmental but from media reports, which can be problematic. Aware of this problem, the China's Global Investment Tracker dataset controls for the quality of information. Our source allows us to filter successful Chinese investment from failed ones, which were announced but were never completed. In this paper, we only include the projects where invested occurred.
A drawback of this database is that it only includes investment larger than U.S. $100 million. This threshold excludes hundreds of small investment, and results in over-representing large investment made. The amount of investment is strongly right skewed, with a mean amount of U.S. $1777 million a year and a median amount of U.S. $980 million.
To address the drawback, we chose to use the number of investment per country in each year as the dependent variable, capturing the country level extensive margin of FDI. Thus, we use a count variable and construct a balanced panel based on host countries and the time dimension. We use a panel Poisson specification with country and yearly fixed effects. The link of the panel Poisson function is log, the default for most statistical packages, and we do the interpretation of the coefficients observing percentage changes.Footnote 72 Our model can be written as follows:
 $$\eqalign{& {\rm Number\ of\ investments}_{{\rm t,k}} = {\beta}_{0} + {\beta}_1{\rm Political\ proximity\ with\ US_{k,t}} + \cr & \sum\nolimits_{{\rm k = 1}}^{{\rm k = 66}}{\beta}_{\rm k}\,\hbox{Country}\,\,\hbox{Controls}_{{\rm k,t}} + \sum\nolimits_{{\rm t = 2010}}^{{\rm t = 2005}} {{\omega}_{\rm y}\,{\rm Yea}{\rm r}_{\rm t}\, + \,\sum\nolimits_{{\rm k = 1}}^{{\rm k = 66}} {{\rm h}_{\rm k}\,{\rm Country}_{\rm k}{\rm + }\,\,{\rm \varepsilon}_{{\rm k,t}}} } } $$
(1) The equation models the annual number of projects in the host country k in the year t. The subscript k includes the following country-level controls: the Chinese diaspora in the host-country, the host-country's GDP, the distance between Beijing and the host-country's capital, the host-country exchange rate, the percentage of exports of the host-country to China, and the country's exports of minerals, metals and oil, as a proxy for natural resource exports. Since we cannot measure state equity at the country level, this country level model primarily focuses on H1. Therefore, the key interest is ß 1, which we expect to be statistically significant and negative to support our first hypothesis.
3.2.2 Firm level data and estimation method
To provide robustness to the results from the country-level model, and more importantly, to test the second hypothesis, we specify a firm-level model with cross sectional data of Chinese MNEs greenfield investment between 2005 and 2010. The firm-level data was drawn from FDI Markets gathered by the Financial Times. It is comprised of 720 firm-level observations in the six year period. The dependent variable here is the sum of invested capital by each firm in a particular year. This is the most direct way of capturing firm level FDI. The subscript k is comprised by the same controls as the country-level data model described in the previous paragraph. The subscript c includes the following firm-level controls: total assets, age, and the annual profit per employee. Our firm level model can be expressed as follows:
 $$\eqalign{& {\rm Capital}\,\,{\rm investe}{\rm d}_{{\rm k},{\rm c},{\rm t}} = {\beta}_0 +{\beta}_1\,\hbox{Political proximity with US}_{{\rm k,t}} + \cr & {\beta}_2\,{\rm State}\,{\rm Equit}{\rm y}_{{\rm c,t}} + {\beta}_3\,{\rm State}\,{\rm Equity \times} \hbox{Political proximity with US}_{{\rm k,c,t}} + \cr & \sum\nolimits_{{\rm k = 1}}^{{\rm k = 115}} {{\beta}_{\rm k} \hbox{ Country Controls}_{{\rm k,t}}} + \sum\nolimits_{{\rm c = 1}}^{{\rm c = 720}} {{\beta}_{\rm c}} \,\hbox{Firm Controls}_{{\rm c,t}} + \cr & \sum\nolimits_{{\rm t = 2010}}^{{\rm t = 2005}} {{\rm \omega }_{\rm y}\,{\rm Yea}{\rm r}_{\rm t} + \sum\nolimits_{{\rm k} = 1}^{{\rm k} = 115} {{\rm h}_{\rm k}\,{\rm Country}_{\rm k} + {\rm \varepsilon }_{{\rm k,c,t}}} } } $$
(2) We have 115 host countries in the sample. In this model, our key interest is ß 3. We sought firm level control variables from Global Business, GTA Information Technology, a commercial database company based in Hong Kong. We use an OLS with robust standard errors specification in the estimation.
Due to the fact that our data are drawn from two different sources, this has resulted in some sample attrition (number of observations from 875 to 261 in the full model, a reduction in 70 percent) that may not be random. We followed the same procedure as Duanmu.Footnote 73 First, to investigate potential bias, we used a simple t-test to check variables such as the amount of FDI and country-level controls. We found a small but systematic difference between the missing observations and the available observations. To correct for this bias we included zeroes in our database by creating a dyadic version of it, in which the dependent variable is dichotomous (1 if the MNE invested in the country on that year, and 0 otherwise). We now discuss this “dyadic” model.
3.2.3 Dyadic data and estimation method
Combining both previous datasets, we created a dyadic dataset that assumes the value of “1” when the Chinese MNE invests in a host-country, and “0” otherwise. This dataset allows us to combine country-level and firm-level controls, as well as to have zeroes in the database to control for potential selection biases of previous models. We employ a logit specification. Since the logit transformation allows for a linear relationship between the response variable and the coefficients, the coefficients in this model will be interpreted in terms of the log odds. The dataset is comprised of 9,669 observations, and the model is specified as follows:
 $$\eqalign{& {\rm Investmen}{\rm t}_{{\rm k,c,t}} = {\beta}_0 + {\beta}_1\,\hbox{Political proximity with US}_{{\rm k,t}} + \cr & {\beta}_2\,{\rm State}\, {\rm Equit}{\rm y}_{{\rm c,t}}{\rm + }{\beta}_{\rm 3} \hbox{State Equity} \times \hbox{Political proximity with US}_{{\rm k,c,t}} + \cr & \sum\nolimits_{{\rm k = 1}}^{{\rm k = 112}} {{\beta}_{\rm k}} \hbox{Country Controls}_{{\rm k,t}} + \sum\nolimits_{{\rm c} = 1}^{{\rm c = 609}} {{\beta}_{\rm c}\,\hbox{Firm Controls}_{{\rm c,t}} + } \cr & \sum\nolimits_{{\rm t = 2010}}^{{\rm t = 2005}} {{\rm \omega }_{\rm y}\,{\rm Yea}{\rm r}_{\rm t} + {\rm \varepsilon }_{{\rm k,c,t}}} } $$
(3) The equation models the capital invested by each Chinese firm c in the host country k in the year t. The k term is an index for the host country. The subscripts c and k use the same controls as the models specified before.
It is noted that we use greenfield investment in both the country-level and firm-level datasets, because it is more sensitive to political risk, official regulations, and political pressure than other types of FDI, such as mergers and/or acquisitions.Footnote 74 In addition, greenfield was the main market entry choice by Chinese MNEs, approximately 60 percent larger than the money invested through M&As in our sample period.Footnote 75 We do not include FDI of other market-entry modes due to data unavailability.
3.2.4 Robustness and Falsification tests
Besides Models 1–3, we propose two robustness checks. The purpose of Models 4 and 5 is to provide robustness checks for our findings by using an alternative measure of state intervention over MNEs. Model 4 has the same specification as Model 2—OLS specification, in which capital invested is the dependent variable. Model 5 has the same specification as Model 3, which uses a logit specification and a dummy variable for each investment as dependent variable, but the state equity is replaced as the independent variable by a company under the control of SASAC.
In addition, we provide two falsification tests that aim to attest the causal mechanism between political proximity with the United States and Chinese allocation of FDI. Firstly we sought to use Taiwan as a counterfactual for the role of the Chinese Government in the decision-making of its MNEs. The idea is that to establish that Chinese FDI is deterred by U.S. political dominance over the host country due to China's unique political and economic position in the world, we need to demonstrate that in a “counterfactual” world this tendency would not exist. While a perfect counterfactual is difficult to find, we feel that Taiwan's outward FDI in the same period might serve the purpose for two distinct reasons.
Taiwan was separated from China in 1949 during the Chinese Civil War in which the Communist Party of China (CPC) took power of mainland China and forced forces loyal to the Kuomintang to base in Taiwan. CPS has claimed the legitimate government of all China since then. This means that had the political event not happened, Taiwan and China would have been one country. Secondly, despite inherited similarities between the two, they have distinct political regimes, and their relationship with the United States follows very different trajectories. We use the proxy for political proximity with U.S. data of Chinese votes in UNGA because Taiwan has not belong to this International Organization since 1971 when Resolution 2758 determined that PRC is “the only legitimate representative of China to the United Nations.” If we find that Taiwan's FDI does not respond in the same way as China's FDI to the U.S. political dominance over the host country, then that would enhance our theoretical argument regarding the political mechanisms that explain the distribution of China’s FDI.
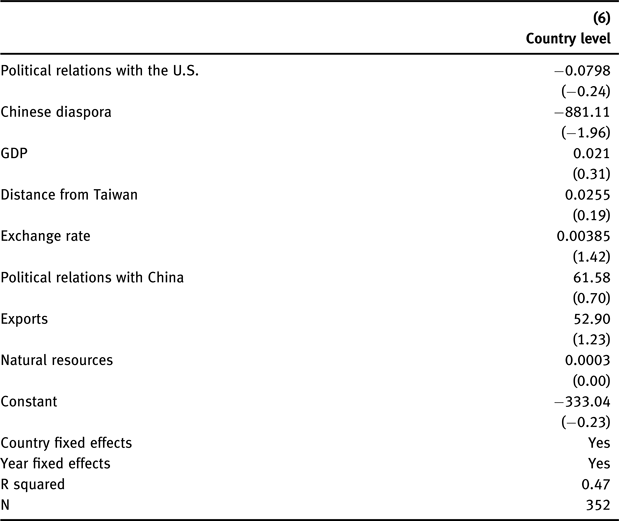
Model 6 in Table 4 is specified as an OLS and the dependent variable is Taiwan's yearly-invested capital per country:
 $$\eqalign{& {\rm Taiwan^{\prime}s}\, \hbox{ capital invested}_{{\rm k,t}} ={\beta}_0 + \cr & {\beta}_1\,{\rm Political}\,\hbox{ proximity with US}_{{\rm k,t}} + \sum\nolimits_{{\rm k} = 1}^{{\rm k} = 27} {{\beta}_{\rm k}\,{\rm Country}\,\,{\rm Control}{\rm s}_{{\rm k,t}}} + \cr & \sum\nolimits_{{\rm t = 2010}}^{{\rm t = 2005}} {{\rm \omega }_{\rm y}\,{\rm Yea}{\rm r}_{\rm t} + \sum\nolimits_{{\rm k = 1}}^{{\rm k = 27}} {{\rm h}_{\rm k}\,{\rm Countr}{\rm y}_{\rm k}{\rm + }{\rm \varepsilon }_{{\rm k,t}}{\rm }\,} } } $$
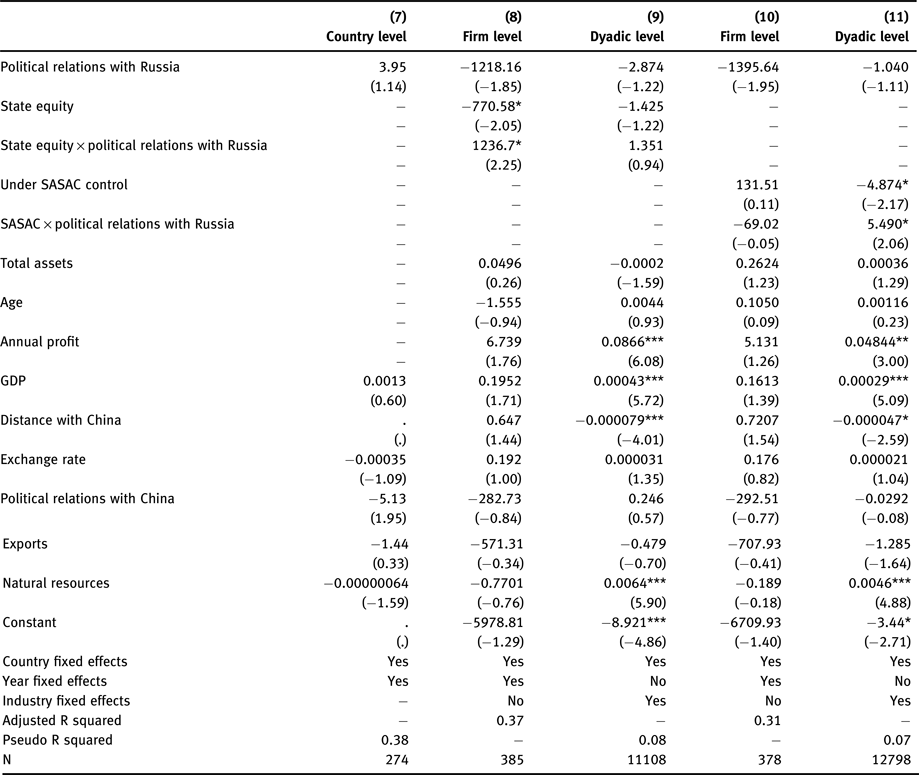
(6) Second, we replaced the independent variable: U.S. political proximity with that of Russia. We tested five models (7 to 11) as presented in Table 5, which are identical in specification and dependent variables to those in Model 1 to Model 5. The idea is that although Russia can be seen as a secondary actor in the current global hierarchy, a couple of characteristics make it a suitable setting for this falsification test. First, it is a member of the UN Security Council, just like the United States and China. Second, it is a former communist country and a member of the BRIC, a key ally of China when it comes to confronting Western international regimes regarding human rights, authoritarian rule, and nuclear power. If the results based on Russia's political relations are consistent with those where we treat the United States as the “hegemon,” then our theoretical arguments would be called into question. But if the results are inconsistent with those based on the assumption that the United States is the “hegemon,” that would then enhance our theoretical argument that it is U.S. dominance that Chinese investors try to avoid. We proceed to discuss our results in the next section.
4. Empirical results
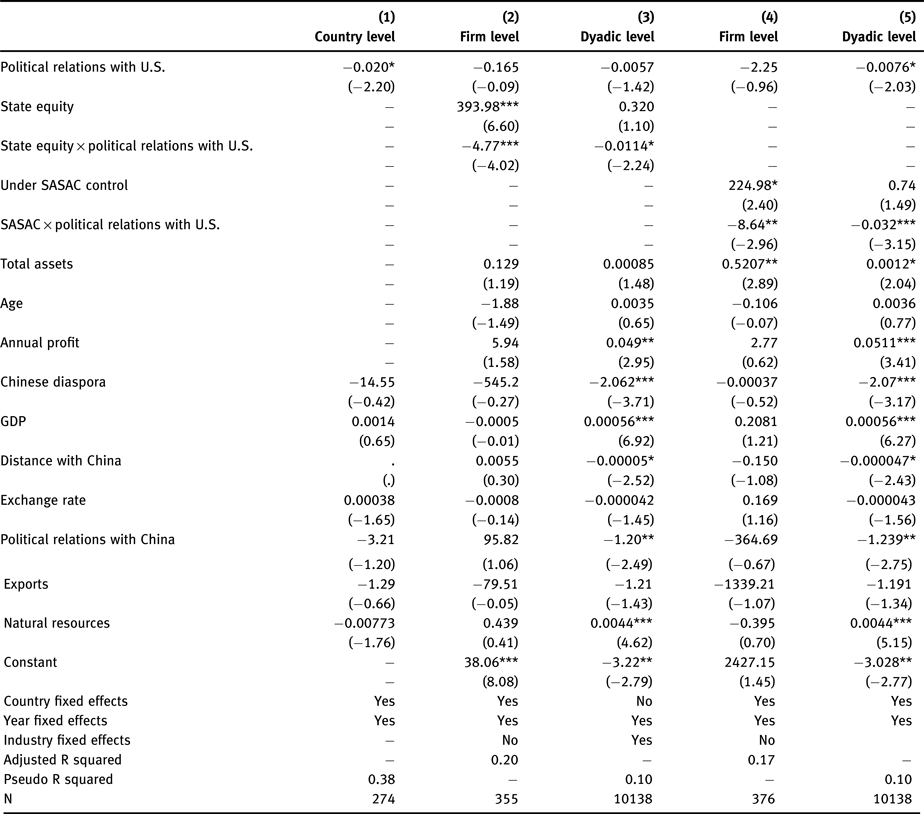
Table 3 offers the results of the three baseline models: country-level, firm-level, and dyadic-level data. In Model 1, the dependent variable is the number of greenfield investment per year at the country level. On average, each host country received less than one greenfield project a year (0.83) and only two countries received investment in every single year of the sample (Australia and Indonesia). The independent variable for political relations with the United States is statistically significant and has a negative coefficient of −0.020. The interpretation of the coefficients is made using percentage changes. This means that an increase of a percentage point in the political proximity of the host-country with the United States translates into a decrease of 2 percent in the number of projects, ceteris paribus.Footnote 76 The results in Model 1 lend support to our first hypothesis: Chinese investors locate more investment projects in countries with low political proximity with the United States.
Political Relations with the U.S. and China's FDI

Note: the table contains coefficients and t-statistics in parentheses.
Significance values: * p < 0.05, ** p < 0.01, *** p < 0.001.
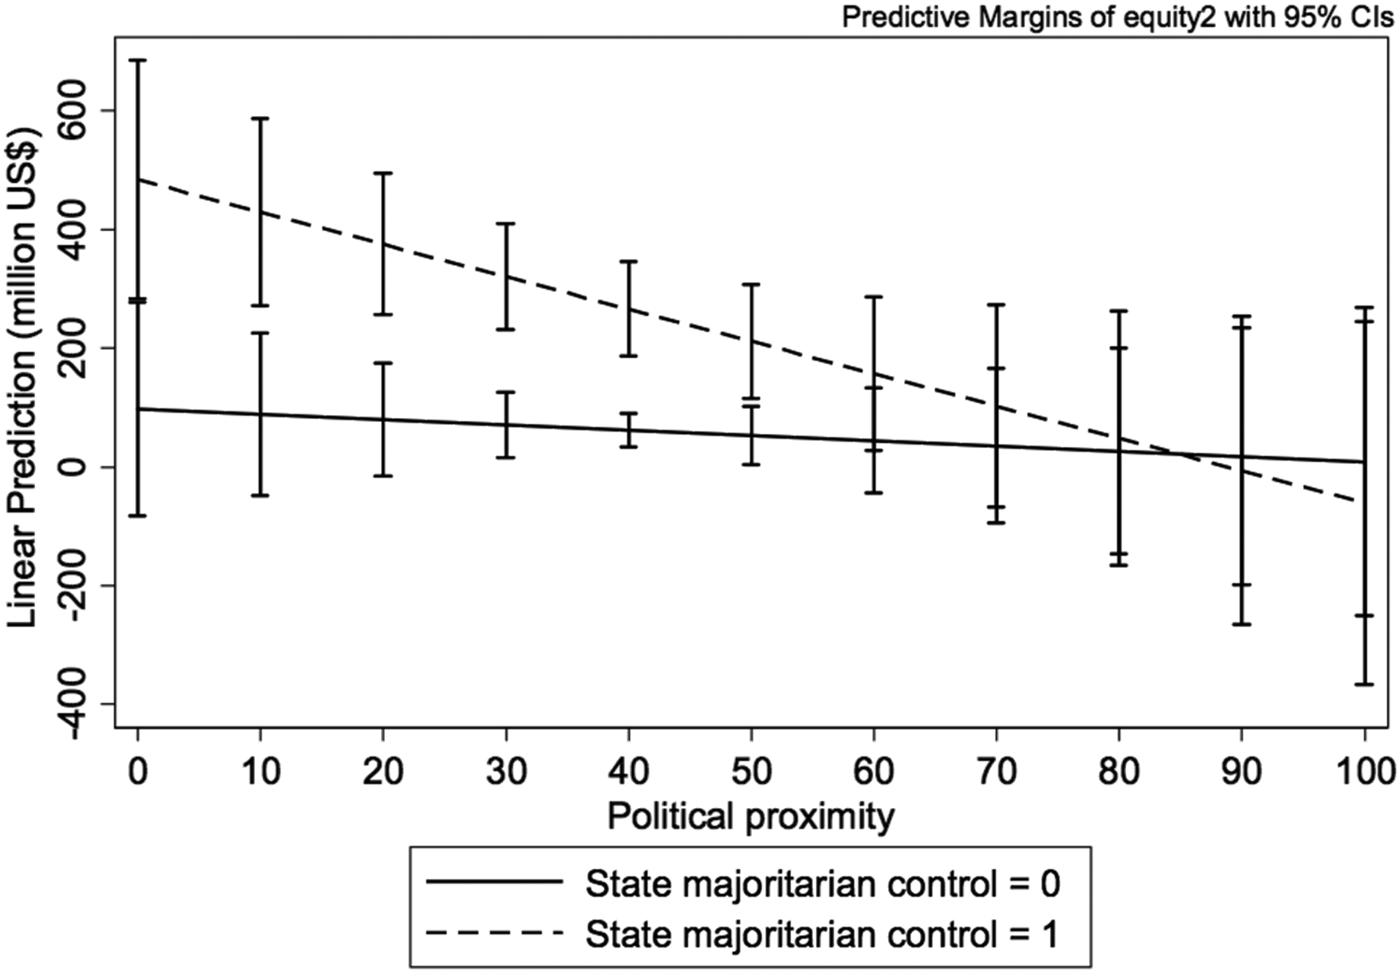
In Model 2, the dependent variable is the sum of capital invested by individual Chinese MNEs in million U.S. dollars. The results lend support to the second hypothesis, but not to the first one. The interactive variable between political proximity with the United States and state equity is statistically significant and has a negative coefficient (−4.77), but the coefficient of political relations with the United States loses statistical significance. It means that while the host country's political distance with the United States increases Chinese firms’ investment, this effect is only applicable for firms with a majoritarian level of state equity. In our sample, 71 percent of the capital invested was under the control of companies with majoritarian state control, which means that our hypotheses apply to a large portion of the sample. The magnitude of the effect can be observed in Figure 3.
Effect of the United States's political proximity on Chinese investment

In Model 3, the dependent variable is a dummy that assumes the value of “1” when the company invested in certain country/year, otherwise “0.” Once again, the interaction of the political proximity with the United States and the majoritarian state equity is statistically significant and reports a negative coefficient (−0.0114). For each unit increase in the proximity with the United States, state control results in a 0.011 unit change in the log of the odds of a Chinese investment, holding all other independent variables constant. The log of the odds can also be transformed to odds-ratios (in this case OR = e0.011 = 0.98). So we can affirm that for a one-unit increase in political proximity with the United States, we expect to see about a 2 percent decrease in the odds of the company investing in that country.
From the standpoint of the literature of international relations previously reviewed, these findings support the hypothesis that FDI is being used by the Chinese government as a soft balancing tool. Models 4 and 5 test an alternative measure for state control over the MNE: being under the control of SASAC.Footnote 77 The correlation of both state equity in the MNEs and SASAC control in the sample is of 0.35. In the sample, 45 percent of the capital invested was through companies within SASAC. Model 4 has the same specification as Model 2—and has an OLS specification—and Model 5 has the same specification as Model 3—and has a logit specification—but the state equity is replaced by control of SASAC as independent variable. We confirm our hypothesis that gives robustness to our findings.
This is a finding that concerns to a recently created domestic institution in China. As the literature has expressed, “SASAC might act as an institutional deterrent, the same way is the Countries and Industries for Overseas Investment Guidance Catalogue published by MOFCOM which has sensitivity criteria for prohibiting investment that jeopardize bilateral diplomatic relations.”Footnote 78
After establishing the main results, we assess the robustness of our findings through two different tests. The first is to use country-level OFDI data from Taiwan as counterfactual to that of China. We extracted Taiwan's FDI data from UNCTAD. Taiwan had FDI in twenty-seven countries in 2001–2012. We constructed a country-level balanced panel data. We found that U.S. political dominance had no statistically significant effect on Taiwan's FDI. The coefficient is positive but not statistically significant. The results are presented in Table 4.
Robustness checks: Political Relations with the U.S. and Taiwan FDI

Note: the table contains coefficients and t-statistics in parentheses. Significance values: * p < 0.05, ** p < 0.01, *** p < 0.001.
The second test that we performed was to replace the independent variable: U.S. political proximity with that of Russia. The results are presented in Table 5. We basically replicated all estimations that we had in Table 3, but replaced the key independent variable, U.S. political relations, with that of Russia. We find that Chinese investment does not soft balance towards this secondary (but still relevant) actor in the international arena. The political proximity for Russia is actually positively related to Chinese investment at a firm level. These findings enhance our confidence in our theoretical argument.
A falsification test: Political relations with Russia and China's FDI

Note: the table contains coefficients and t-statistics in parentheses.
Significance values: * p < 0.05, ** p < 0.01, *** p < 0.001.
5. Discussions and conclusions
We have provided theoretical arguments and empirical evidence for how political factors regarding the power distribution of the international system influenced Chinese firms’ investment. We find that distant political relations between the host and the United Stats serve as an incentive to Chinese firms’ under strong state control to invest. Our results have significant implications to theory and in practice. The political economy view has not been considered in studies of OFDI from China, which have predominantly focused on economic, institutional, and geographic factors. We incorporate theoretical concepts from international relations theory to understand this under-explored phenomenon of international business. If the United States retains its economic and military primacy under unipolarity, maintaining the power gap with other powers, then it can continue to enjoy the luxury of a unilateral policy without worrying about hard balancing from others. The best other powers can do under unipolarity “is to attempt soft balancing to constrain U.S. power rather than asserting a military challenge.”Footnote 79
Our empirical findings give substance to soft balancing theory by demonstrating that major powers are likely to adopt actions that do not directly challenge U.S. military preponderance but that use nonmilitary tools to delay, frustrate, and undermine aggressive unilateral U.S. military politics. While previous studies find that political affiliation of SOEs with the central government has played an important role in facilitating SOEs’ overseas expansion,Footnote 80 this research demonstrates that the benefits do not come without expense. What is clear is that the visible hands of the Chinese government exert significant influence on its SOEs’ OFDI. Recent, large infrastructure investments projects have shown the political variable to be highly relevant, as the projected transoceanic canal that crosses Nicaragua which is intended to compete with the Panama Canal.Footnote 81
China, furthermore, might be interested in “buying friends” through FDI, and those countries with less U.S. influence might be the easiest to seduce with large infrastructure projects. An important implication of the results is that U.S. global dominance has long been embedded in the current economic globalization that commenced after WWII. But if the world political order were to change, i.e., U.S. influence may decline as did the United Kingdom's after WWI, U.S. influence on the distribution of FDI may diminish, which does not mean that we should not consider the political economy of globalization but that we should theorize how the new political order may replace the old regime and influence the trajectories of it.
Supplementary material
To view supplementary material for this article, please visit https://doi.org/10.1017/bap.2017.5.