I. INTRODUCTION
Recent studies on the deformation behavior of ultra-fine grain materials have revealed significant differences when compared to their coarse grain counterparts.Reference Valiev, Islamgaliev and Alexandrov1 Grain size is expected to play an important role in low stacking fault energy FCC as well as HCP metals and alloys that deform extensively by twinning.Reference Christian and Mahajan2 The commotion of twinning may lead to a change in deformation texture, particularly in HCP materials where more than one twin system may be activated.Reference Noorbaksh and O’Brien3 Texture is an important microstructural aspect of deformation, as it largely influences the mechanical properties of materials. The effect is more pronounced in the case of HCP materials due to the inherent anisotropy of the unit cell. Among HCP materials, titanium and its alloys have been investigated in greater detail due to their extensive use in aerospace and biomedical applications.Reference Hanson4 The c/a ratio plays an important role in deciding the deformation mode in HCP materials, for example, (i) in materials with c/a < 1.632 (Ti, Zr, Be, etc.), a sufficient number of slip system is provided by prismatic and pyramidal slip; (ii) in materials with 1.63 < c/a < 1.73 such as Mg (c/a = 1.624), only basal slip is available; and (iii) in materials with c/a > 1.73 (e.g., Zn, Cd), deformation is accommodated by basal slip and twinning.Reference Gottstein5 In titanium, with a c/a ratio of ~1.588, the deformation at room temperature is facilitated by prismatic, pyramidal <c + a>, and basal slip along with compressive and tensile twinning.Reference Christian and Mahajan2, Reference Partridge6 The studies on evolution of deformation texture in titanium with grain size in the micron rangeReference Noorbaksh and O’Brien3, Reference Lee, Esling and Bunge7–Reference Zhong, Yin and Nagai9 revealed that the cold rolling texture does not develop monotonically with strain,Reference Lee, Esling and Bunge7 therefore no single mechanism is operative throughout the deformation. The entire deformation path is classified into twin dominated and slip dominated regimes. The interaction of twinning with normal dislocation slip plays an important role in determining the texture evolution in the low and intermediate strain regimes. However, these mechanisms and their regime of dominance are likely to be influenced by grain size.
Submicron grain size Ti and Ti alloys, produced by severe plastic deformation techniques,Reference Stolyarov, Zhu, Alexandrov, Lowe and Valev10–Reference Kim, Yoo and Lee12 exhibit high strength, lower ductility, and lower strain hardening rate than their coarse grain counterparts. It is well known that with the decrease in grain size, there is a decrease in the propensity of twinning in hexagonal materials. It has been shown that the smaller grains cannot accumulate dislocations and twin boundaries, and hence strain hardening remains very limited in UFG Ti.Reference Stolyarov, Zhu, Alexandrov, Lowe and Valev10 The evolution of crystallographic texture is likely to be influenced by these factors. In spite of the fact that texture plays an important or almost deciding role in tailoring suitable mechanical properties of HCP metals and alloys, texture evolution during rolling of SMG titanium has not been studied at all. The present investigation is an attempt to fill this gap. We have studied the evolution of texture in submicron grain size (~500 nm) produced by a combination of the severe plastic deformation method, namely equal channel angular extrusion followed by cryorolling and short term annealing. A thorough analysis of texture and microstructure has been carried out and the evolution of texture has been analyzed to explore the underlying deformation mechanisms.
II. EXPERIMENTAL
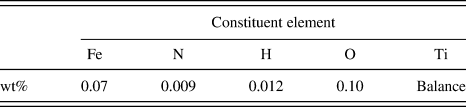
Polycrystalline commercially pure (CP) Ti billets were subjected to equal channel extrusion to obtain an average grain size of ~1 μm. The nominal chemical composition of the commercially pure titanium used in the present study is given in Table I. The details of this experiment can be found in an earlier publication by one of the authors.Reference Suwas, Beausir, Toth, Fundenberger and Gottstein13 The deformed billet (cross section 10 × 10 mm2) was sectioned along the transverse direction and further cryorolled to 3 mm. The rolled material was annealed at 150 °C for 15 min to obtain an average grain size of ~500 nm. This material was treated as the starting submicron grain (SMG) material. The so obtained SMG sample was then subjected to rolling deformation at room temperature in steps of 5% reduction per pass to a total deformation corresponding to 90% thickness reduction (ε = 2.3).
Chemical composition of the commercially pure titanium used in the present investigation.

Bulk textures were determined by measuring six incomplete pole figures, namely (0002), (10 0), (10
 1), (10
 2), (10
 3), (11
 0), and (11
 2) at the mid-thickness section using an x-ray texture goniometer based on Schulz reflection geometry. The orientation distribution functions (ODFs) were calculated from the experimental pole figures following the ADC (arbitarily defined cells) method using Labotex software (Labosoft s.c., Krakow, Poland). An orthorhombic sample symmetry was imposed while calculating the ODF; and the volume fraction of various deformation texture components was estimated using the single counts in overlap areas approach.Reference Pawlik14 The microstructures were examined by electron back scattered diffraction on a field emission gun scanning electron microscope (FEG-SEM) FEI-SIRION (FEI, USA). The samples for EBSD were prepared by electropolishing in a solution of 60 mL perchloric acid in 600 mL methanol and 400 mL butycellosolve. A step size of 50 nm was used for the deformed samples while for the 90% deformed sample, a scan with step size of 10 nm was used. Data acquisition and analysis was carried out using TSL-OIM software due to TexSEM laboratory. The samples for transmission electron microscopy (TEM) were prepared by mechanical thinning followed by twin jet electropolishing using the same electrolyte as mentioned above. Transmission electron microscopy was carried out on a 300 kV FEG transmission electron microscope FEI-Tecnai. The Vicker microhardness test was carried out on equipment provided by Zwick-Roell Germany using a load of 100 g for 10 s.
III. RESULTS
A. Starting material
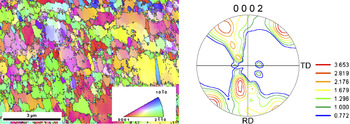
The microstructure of the starting SMG titanium sample (obtained by ECAE + cryorolling + short term annealing) as revealed through the inverse pole figure (IPF) map generated by EBSD is shown in Fig. 1. Although the analysis of the microstructure indicated an average grain size ~530 nm, grains above 1 μm size were also present in the microstructure. The initial texture of the SMG sample exhibited a shear type texture, as observed in ECAE processed materials, plus some orientations tilted from the center of the basal pole figure. The overall texture was not very sharp.
Inverse pole figure map and the (0002) pole figure of the starting SMG titanium sample.

B. Deformation texture
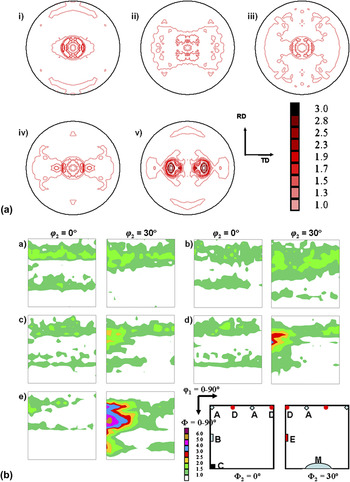
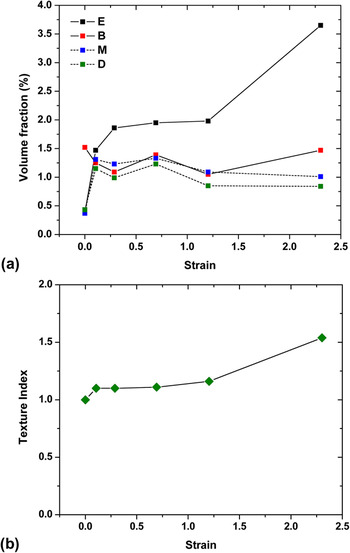
The (0002) pole figure for the deformed SMG titanium samples is shown in Fig. 2(a). The pole figures of the rolled materials clearly displays a T-type texture, that is, the splitting of the basal poles along the TD around ND. To get a quantitative estimate of texture evolution, the complete ODFs were calculated for each of the samples using the measured incomplete pole figures. A key figure displaying the locations of important deformation texture components in the respective ODF sections is also given along with and the corresponding Miller indices in Table II.Reference Zhong, Yin and Nagai9 The B component (φ2 = 0°) is initially weak in the ODFs while the E component (φ2 = 30°) strengthens with an increase in deformation. The volume fractions of various deformation texture components in SMG Ti show a unique trend [Fig. 3(a)]. There is an increase in the volume fraction of the E component while that of the B component fluctuates with increasing strain. On the other hand, the volume fractions of the M and D components tend to saturate beyond a strain of ε = 0.1. Note that the volume fraction of all the deformation texture components is not very high for SMG Ti, that is, the overall textures are weaker. However, a gradual increase in the value of the texture indexReference Bunge17 with increasing strain was noted [Fig. 3(b)].
(a) (0002) pole figures and (b) φ2 = 0° and 30° sections of the ODF for SMG Ti samples rolled to a strain of (i) 0.10, (ii) 0.29, (iii) 0.69, (iv) 1.2, and (v) 2.3.

Evolution of (a) volume fractions of different texture components and (b) texture index for the deformed samples.

Deformation texture components in rolling of titanium.Reference Zhong, Yin and Nagai9

C. Evolution of microstructure
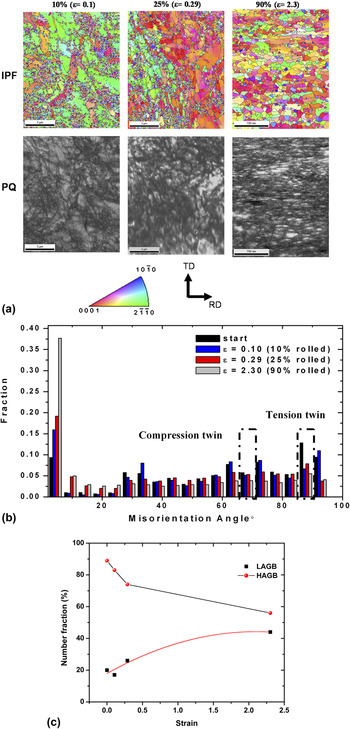
A detailed study of microstructural evolution in the SMG titanium was carried out using EBSD. Figure 4(a) displays the inverse pole figure map with boundaries with misorientation >5° and the pattern quality map for three different strain levels. Further microstructural analysis has been done by plotting the misorientation distribution. It was found that the initial material itself was characterized by the same twins that were probably formed during annealing. However, there was no occurrence of twinning as a result of deformation. The {11 2} compressive twins in titanium are characterized by a misorientation of 64.62° about the {10
 0} axis, while a misorientation of 84.78° about the {11
 0} axis corresponds to the {10
 2} tensile twin. The fraction of these boundaries would indicate the twin activity in titanium. The presence of twins in the starting SMG sample is shown by a higher fraction of boundaries at these misorientations. It was found that with the increase in strain, there was a decrease in the fraction of the boundaries corresponding to twinning near 65° and 85° [Fig. 4(b)]. In addition, the misorientation plots indicate that the fraction of the low angle grain boundaries (LAGB) increased with increasing strain to 2.3 corresponding to 90% reduction [Fig. 4(c)]. The IPF map showed the refined microstructure for the 90% rolled sample [Fig. 3(a)].
(a) Inverse pole figure map with boundaries >5° with pattern quality map, (b) misorientation distribution chart, and (c) variation of low angle and high angle grain boundaries (LAGB and HAGB) with increasing strain for the SMG titanium samples rolled to different reductions.

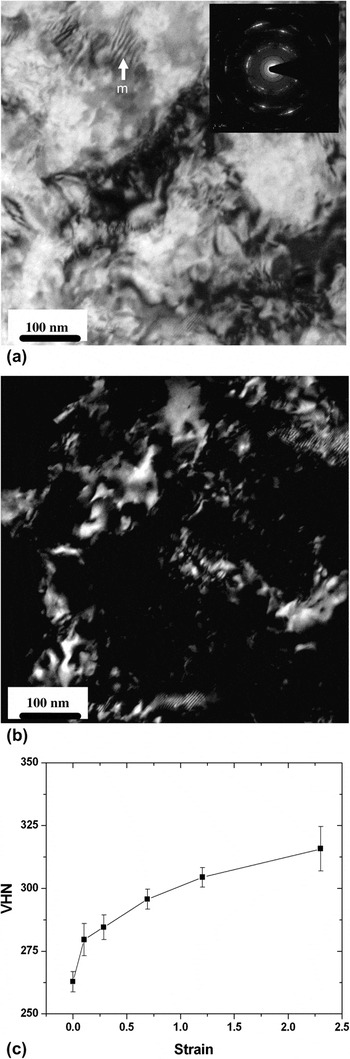
A detailed microstructural investigation was performed by TEM. The TEM bright field and dark field images [Fig. 5(a)] clearly show extensive grain refinement after 90% deformation (ε = 2.3). The Moiré fringes (marked m) observed at the top left part of Fig. 5(a) indicate the presence of overlapping nanocrystalline grains. The presence of nanocrystalline grains is even clearer in the dark field image [Fig. 5(b)]. The diffraction pattern obtained from a large area aperture is shown in the insert [Fig. 5(a)]. It shows a discontinuous ring pattern, a characteristic of fine grain material with a strong texture.
(a) Bright field image (with diffraction pattern), (b) dark field image from the 90% rolled (ε = 2.3) SMG Ti sample, and (c) evolution of Vickers hardness with rolling reduction for SMG Ti.

The Vickers microhardness measurements carried out on the rolled samples showed a parabolic increase in hardness with strain. The hardness of SMG titanium sample was much higher (~263 VHN) compared to titanium with microcrystalline grain size (~180 VHN). There was a further increase in hardness [Fig. 5(c)] with deformation and no saturation was observed until ε = 2.3 (90% reduction).
IV. DISCUSSION
A. Overall deformation mechanism
The deformation of SMG titanium led to a typical T-type rolling texture as observed in titanium with microcrystalline grain size which is a stable end orientation and generally develops at higher strains during rolling.Reference Philippe15 Such textures are reported to form by combined action of prismatic, pyramidal <c + a>, basal slip, and compressive/tensile twinning. However, the sequence of texture evolution in SMG titanium is different from microcrystalline grain size titanium. In microcrystalline titanium, there is an increase in certain texture components, namely the M {01 0} <2
 2 > and D {0001} <11
 0 > at low strains until ε = 0.51 (40% reduction) followed by a decrease and finally disappearance at very large strains.Reference Chun, Yu, Semiatin and Hwang8, Reference Zhong, Yin and Nagai9, Reference Singh and Schwarzer16 In the case of an initial strong basal texture, (as observed in hot rolled titanium), R-type texture forms until ε = 0.51 due to extensive compressive twinning while at higher reduction, pyramidal <c + a> slip dominates and eventually leads to a T-type texture.Reference Chun, Yu, Semiatin and Hwang8 Therefore, deformation of titanium is characterized by two important regimes: (i) the low and intermediate strain regime (ε = 0.51, 40% reduction): twin and slip; and(ii) the high strain regime (ε > 0.51, 40% reduction): only slip.
The deformation texture evolution in titanium follows a typical path with a change in orientation from the B component to M to D and finally to E.Reference Zhong, Yin and Nagai9 It is well known that twinning in hexagonal metals and alloys is strongly dependent on the direction of stress along the c axis. In titanium, tensile {10 2} <10
 1 > twinning is operative if there is a tensile stress along the c axis while the compressive {11
 2} <11
 3 > is operative when there is compressive stress along the c axis. In microcrystalline grain size titanium with T-type texture, the compressive twinning reorients the c-axis in such a way that there is tensile stress along the reoriented c axis of the twinned grains. Therefore, in microcrystalline grain titanium, the deformation mechanism during rolling is characterized by compressive twinning followed by tensile twinning. The onset of compressive twinning followed by tensile twinning leads to a particular path for texture evolution. It has been shown that the B component undergoes compressive twinning to form the M component that in turn undergoes tensile twinning to form the D component. Therefore, one would expect evolution of the E component at the expense of the B component accompanied by an increase in the M and D components as long as twinning is active. Though the initial texture in the present investigation was different from that of conventional microcrystalline material by Zhong et al.,Reference Zhong, Yin and Nagai9 tensile twinning is still favorable for the initial orientation in SMG titanium. However, after an increase in the M and D components beyond a strain of ε = 0.1, there was no significant change in volume fraction of these components. In the present investigation, the ODF sections clearly show the absence of these components for any level of rolling deformation [Fig. 2(b)].
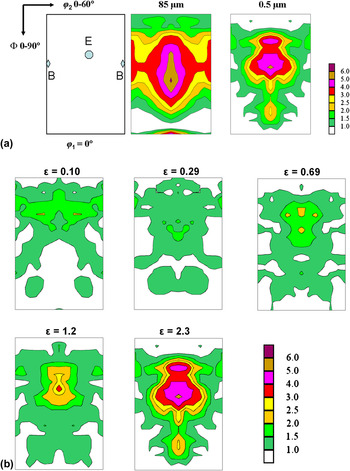
This clearly indicates the absence of twinning in SMG titanium. Note here that the propensity of twinning is dependent on the oxygen content and a higher oxygen content can also suppress twinning in titanium. To eliminate the effect of oxygen, we carried out a similar study on texture evolution during cold rolling in microcrystalline titanium that was used to prepare the SMG titanium sample. In this case, twinning was observed as reported in the literature at low strains and therefore a significant amount of M and D components appeared [Fig. 6(a)]. The texture of microcrystalline titanium shows the B and E components, while the SMG sample shows only the E component. The Φ1 = 0° section of the ODF for different amounts of deformation in SMG titanium [Fig. 6(b)] samples clearly shows that there was an increase in the E component with little change in the B component. The continuous increase in the texture index,Reference Bunge17 which gives a quantitative measure of the overall texture strength, can explain the evolution of texture with strain.
(a) Comparison of the φ1 = 0° section of the ODF for ε = 1.2 (70% rolled) microcrystalline and SMG titanium and (b) evolution of B and E components as seen in the φ1 = 0° section of the ODF with strain for SMG titanium.

The results of EBSD analysis for rolled SMG titanium clearly indicate an increase in fraction of the LAGBs with an increase in strain. This is accompanied by a decrease in fraction of the boundaries corresponding to twinning; and an increase in strain. The decrease in the fraction of boundaries corresponding to well known specific twinning systems indicates the negligible contribution of tensile and compressive twinning to the plastic deformation of SMG titanium. The monotonic increase in the LAGBs until ε = 2.3 (90% reduction) indicates slip dominated mechanisms in this grain size range. Low angle grain boundaries are expected to form from mobile dislocations during the deformation process. The contrast within nanocrystalline grains as revealed by TEM clearly indicates dislocation activity at the nanometer length scale [Fig. 5(a)]. However, twins were not observed in any of the deformed samples. This further corroborates the analysis of bulk texture measurement and EBSD.
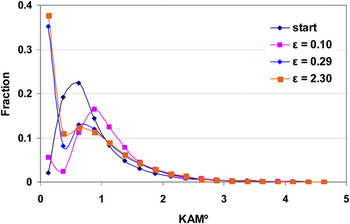
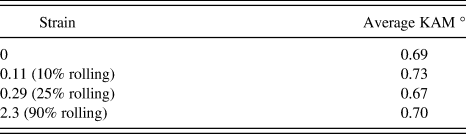
A more detailed analysis of the EBSD data was carried out by calculating the kernel average misorientation, which is the average misorientation of a point with all of its neighbors, with the provision that misorientations exceeding some tolerance value (generally 5°) are excluded from the averaging calculation. It is a measure of the evolution of local misorientations in the microstructure. A low value of KAM with a log normal distribution indicates a low dislocation density and uniform distribution of dislocations in the microstructure. On the other hand, a higher average value of KAM with a broader distribution indicates a higher dislocation density and heterogeneous dislocation structure. To study the substructure evolution during rolling of SMG titanium, a KAM distribution was carried out from the EBSD data. The initial SMG Ti material shows a very low value of KAM and a log normal distribution of KAM values (Fig. 7). This is an indication of uniformly distributed local strain, a characteristic of annealed samples with no dislocation activity.Reference Zhong, Yin, Sakaguchi, Nagai and Yang18 For a strain of ε = 0.1, the peak of KAM distribution shifts to the right, indicating an increase in the local strain due to dislocation activity. Further, there is an increase in the fraction of very low KAM values (<1°) in the sample. This could be attributed to regions of high local strain, that is, high dislocation density. Thus, the deviation from log normal distribution in the region of low KAM values indicates the evolution of a heterogeneous dislocation substructure in the material. The heterogeneity of substructural evolution is clearly manifested in the KAM distributions for the samples rolled to strain of ε = 0.29 and ε = 2.3 (Fig. 7). A further increase in the fraction of the low KAM value is quite evident for the higher level of deformation. The KAM results corroborate the continuous increase in LAGB at the expense of HAGB in SMG titanium. Another important outcome of the KAM analysis was that the average KAM value was almost constant irrespective of amount of deformation (Table III). This indicates that in addition to normal dislocation based plasticity, the deformation is also accommodated by processes that do not involve dislocations, for example, grain boundary sliding.
Evolution of the kernel average misorientation distribution for the SMG titanium samples with increasing rolling reduction.

Average KAM values for the SMG titanium samples with increasing rolling reduction.

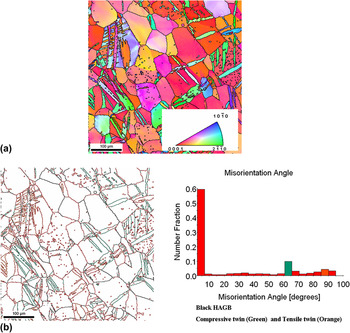
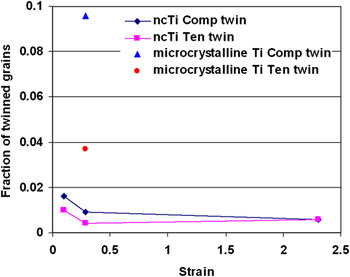
Additional evidence regarding deformation mechanism can be obtained by examining the hardness curve. The hardness value for the rolled samples of SMG Ti [Fig. 5(b)] follows a parabolic trend with values increasing continuously with strain. In contrast, the investigation by InagakiReference Inagaki19 has revealed that microcrystalline titanium displays a three step hardening which has been attributed to extensive twinning at low and intermediate strains. InagakiReference Inagaki19 observed an increase in the hardness was observed with strain up to ε = 0.51; followed by an almost constant hardness until ε = 0.92. The hardness at higher reductions for the microcrystalline titanium sample increased further. InagakiReference Inagaki19 attributed the initial increase in hardness to twinning while the hardening observed after the saturation stage was attributed to the activation of the hard pyramidal slip system. The absence of three stage hardening in SMG titanium strengthens the argument that twinning does not occur during the deformation of SMG titanium. The microcrystalline grain size titanium specimen extracted from same initial material subjected to a similar deformation level showed extensive twinning [Fig. 8(a)], in contrast to the SMG titanium sample. The difference can be further appreciated by comparing the misorientation distribution plot [Fig. 8(b)]. Clustering of orientations near 65° misorientation indicates compressive twinning, while misorientation of 85° corresponds to tensile twinning. EBSD data was used to identify the fraction of untwinned grains as well as parent and daughter grains. The fraction of daughter grains for tensile and compression twinning in microcrystalline and SMG titanium clearly indicates lack of twinning in the latter (Fig. 9). Thus, the parabolic hardening, evolution of crystallographic texture, and microstructural features obtained using electron backscatter diffraction (EBSD) clearly indicate the absence of twinning in SMG Ti.
(a) Inverse pole figure map. (b) Blank map with boundaries and misorientation distribution plot for microcrystalline titanium sample deformed to ε = 0.3 showing conspicuous twinning. The black lines correspond to high angle grain boundaries (HAGB) while the green boundaries correspond to compressive twin and orange boundaries to tensile twin.

Fraction of the twinned (daughter) grains corresponding to compressive and tensile twins in microcrystalline and SMG titanium samples.

Although the analysis of KAM values indicate the possibile occurrence of grain boundary sliding as an operative accommodating mechanism, its contribution might not be significant. Myshlyaev et al.Reference Myshlyeav and Mironov20 has shown the absence of twinning and grain boundary sliding or grain boundary diffusion (Coble creep) in deformation of submicron grained titanium. In the present case, a continuous increase in the texture index value with strain further rules out a significant contribution of grain boundary sliding to deformation.
B. Explaining the absence of twinning
The results from the bulk texture measurement, microstructural examination from EBSD, and the microhardness measurements indicate the absence of twinning in SMG titanium. The grain size dependence of twinning is well documented and it is known that that the twin nucleation stress increases with the decrease in grain size, thereby reducing the propensity of twinning at smaller grain sizes. According to the Hall-Petch relation, σ = σ0 + kd –α, where σ is the yield strength for grain size d, σ0 and k are size independent constants, and α is the grain size exponent with a value between 0.5 and 1. It is well known that the k value for deformation twinning is much higher than that for normal slip; while the value of α is 0.5 and 1 for critical resolved shear stress (CRSS) of slip and twinning,Reference Meyers, Vohringer and Lubarda21, Reference El-Danaf, Kalidindi and Doherty22 respectively. Therefore, although the CRSS for tensile/compressive twinning is lower than that of pyramidal <c + a> slip system initially, the CRSS of the pyramidal <c + a> slip system may become comparable with the decrease in grain size.
Recently, Yu et al.Reference Yu, Shan, . Li, Huang, Xiao, Sun and Ma23 have shown a complete absence of twinning in submicrometer size Ti pillars and attributed the deformation behavior solely to normal dislocation activity. It is well known that twinning in BCC and HCP metals occur by the pole mechanism, wherein the movement of partial screw dislocations about a pole dislocation leads to the formation of a twin. For HCP titanium, the onset of the two most common twin systems, namely the tensile {10 2} and compressive {11
 2} twin systems, is achieved by the motion of <10
 1 > and <11
 3 > zonal partial dislocations, respectively. The zonal dislocations are necessary for pyramidal <c + a> slip, however, for twinning, a coordinated movement of zonal partial dislocations is required on parallel planes. Wang et al.Reference Wang, Hirth and Tome24 carried out topological studies and molecular dynamics simulations to study {10
 2} twinning in hexagonal close packed metals with different c/a ratios. They showed that {10
 2} twinning can occur only by the zonal twinning mechanism rather than the normal twinning mechanism as the former is energetically more favorable due to a smaller Burgers vector. The motion of the zonal dislocation leads to shuffling of atoms and requires a pole mechanism with the Burgers vector of the pole dislocation equal to three interplanar {11
 2} planes and two rumpled {10
 2} planes for the propagation of compressive and tensile twinning, respectively. Yu et al.Reference Yu, Shan, . Li, Huang, Xiao, Sun and Ma23 have proposed that at the submicron length scale, the adjacent slip planes are weakly coupled by threading pole dislocations and hence the movement of screw dislocations on the adjacent planes is hindered, thereby suppressing twinning. The similarity in the deformation behavior of nanocrystalline nickel (~20 nm) and micropillars of single crystalline Ni (~500 nm) studied by Zhan et al.Reference Shan, Mishra, Syed Asif, Warren and Minor25 has already been shown by the present authors.Reference Gurao and Suwas26 The above discussion leads to the understanding that the lack of coordinated movement of the partials in hexagonal titanium leads to absence of twinning. In SMG titanium, the higher grain boundary area acts as a sink for the dislocations and hence the coordinated movement of partial dislocation is not possible. This accounts for the absence of twinning and the activity of the pyramidal <c + a> slip system in SMG titanium in addition to the prismatic and basal slip systems.
V. CONCLUSIONS
The deformation texture of SMG titanium during rolling led to monotonic evolution of texture. This has been attributed to the absence of twinning. The lack of coordinated movement of the partials participating in the pole mechanism of twinning due to annihilation at the grain boundaries led to suppression of twinning. The imposed deformation was therefore expected to be accommodated by the activity of the pyramidal <c + a> slip system along with prismatic and basal slip systems over the entire strain regime in SMG titanium.
ACKNOWLEDGMENTS
The authors acknowledge the Department of Science and Technology, Government of India, for partial funding of this program. The work involved the use of the facilities setup at the Indian Institute of Science, Bangalore, India, under the Institute Nanoscience Initiative as well as the Institute X-ray facility.
 012} Twinning nucleation mechanisms in hexagonal-close-packed crystals