INTRODUCTION
Soil is an important component of the global carbon cycle because it is the major organic carbon pool in terrestrial ecosystems. In particular, soil organic carbon (SOC) is the major component of soil organic matter (SOM), which has a great capacity for storage and exchange with atmospheric carbon dioxide (CO2) through plant photosynthesis. It is recognized as a fundamental indicator of soil quality and agricultural sustainability due to its capability to improve soil aggregation, permeability and soil water-holding capacity. The quality of SOM is defined as the ease of biodegradation and depends on its chemical composition and its physical structure (Rovira et al. Reference Rovira, Kurz-Besson, Coûteaux and Vallejo2008). The SOC is stabilized in soils by its physical protection within aggregates, resulting in longer decomposition rates of SOM (Adu & Oades Reference Adu and Oades1978; Six et al. Reference Six, Conant, Paul and Paustian2002). Soil aggregate formation is an indicator of soil stability and erodibility (Bryan Reference Bryan1971) and it provides SOC storage and stability (Thevenot et al. Reference Thevenot, Dignac and Rumpel2010).
Soil management practices can determine whether soils behave as sources or sinks of atmospheric CO2. Forests play an important role in carbon exchange with the atmosphere and represent primary soil carbon sinks (Zhang et al. Reference Zhang, Zhang, Liang, Jiang, Dai, Wang and Han2011). Changes in land use from forest soils to cultivated arable land produce a decrease in the SOC content and can reduce soil aggregation and stability, increasing the erosive processes (VandenBygaart et al. Reference Vandenbygaart, Gregorich and Angers2003).
Soil organic matter is a heterogeneous mixture of organic components such as plant, animal and microbial residues in different stages of decomposition (Post & Kwon Reference Post and Kwon2000). Soil organic carbon can be divided into two main fractions, according to its chemical stability and turnover times: (i) the most bioreactive fraction is less stable and easily decomposable with rapid turnover rates, consisting of organic components that are subjected to rapid biological transformation (Coleman et al. Reference Coleman, Crossley and Hendrix1996) and (ii) a more stable carbon fraction which is highly resistant to microbial and chemical decomposition and has slower turnover rates (Falloon & Smith Reference Falloon and Smith2000). The characterization and distribution of SOC into different carbon fractions plays an important role in the dynamics of the global carbon cycle and soil carbon sequestration (Cheng et al. Reference Cheng, Leavitt, Kimball, Pinter, Ottman, Matthias, Wall, Brooks, Williams and Thompson2007) and it is important to assess the processes that affect organic carbon availability for microbial decomposition and storage in soils.
Soil erosion is an environmental problem at a global scale that contributes to the reduction of SOC content at surface soil layers: i.e., the loss of SOC may be related to erosion (Li et al. Reference Li, Zhang, Reicosky, Bai, Lindstrom and Li2006). Recent studies have examined the relationship between the patterns of SOC and soil redistribution processes using the 137caesium (Cs) technique (Ritchie et al. Reference Ritchie, McCarty, Venteris and Kaspar2005; Navas et al. Reference Navas, Gaspar, Quijano, López-Vicente and Machín2012). Soil redistribution processes (i.e., erosion and deposition) play a significant role in understanding SOC patterns at field and landscape levels. As redistribution of 137Cs across the landscape is mainly due to physical processes, this radioisotope can be used as a radiotracer to assess soil redistribution and quantify erosion and deposition rates (Navas et al. Reference Navas, Machín and Soto2005a).
The introduction of 137Cs into the stratosphere and global distribution happened as a result of the atmospheric thermonuclear weapons tests which took place from the mid-1950s to the early 1970s or from nuclear accidents (i.e., Chernobyl and Fukushima). Most of the 137Cs fallout occurred at the beginning of the 1960s with a peak in 1963. De Cort et al. (Reference De Cort, Dubois and Fridman1998) indicated that total 137Cs deposition normalized on 10 May 1986 after the Chernobyl accident in the Iberian Peninsula and was lowest in Europe, estimated at <10 kBq/m2. The 137Cs technique has been applied successfully to quantify medium-term soil erosion rates under different Mediterranean agroecosystems in Spain (Navas & Walling Reference Navas, Walling, Walling, Davies and Hasholt1992; Navas et al. Reference Navas, López-Vicente, Gaspar and Machín2013, Reference Navas, López-Vicente, Gaspar, Palazón and Quijano2014). Once 137Cs fallout reaches the earth's surface from the atmosphere, predominantly through rainfall, it is largely adsorbed by clay minerals and organic matter in the surface soil (Walling et al. Reference Walling, He, Quine and Leibundgut1995). The spatial distribution of 137Cs is mainly due to the physical movement of the soil particles (Ritchie & McHenry Reference Ritchie and McHenry1975); thus 137Cs can be a useful tracer to describe the redistribution patterns of SOC and sediment particles.
Greater knowledge of SOC storage and dynamics within Mediterranean agricultural landscapes in different environmental conditions is needed to improve soil carbon sequestration and to mitigate soil degradation, which is vital to ensure sustainability of fragile Mediterranean mountain agroecosystems.
Furthermore, in order to understand SOC dynamics, it is important to know how carbon pools are distributed in different environments and to identify which are more active and physically available and which are more passive and physically protected. Several studies have focused on this subject in agricultural soils (Sherrod et al. Reference Sherrod, Peterson, Westfall and Ahuja2005), but there is a lack of data on forest soils (Rovira et al. Reference Rovira, Jorba and Romanyà2010). Moreover, the relationships between land use change, soil redistribution processes and SOC fractions are not well known in mountain agricultural lands (Bornemann et al. Reference Bornemann, Herbst, Welp, Vereecken and Amelung2011). The characterization of SOC fractions and analysis of the factors that affect its spatial distribution is needed to elucidate SOC dynamics in Mediterranean agroecosystems and to promote soil sustainability. The objectives of the present study were to estimate SOC content and characterize the active and the stable carbon fractions (ACF and SCF, respectively) in 23 soil profiles along a mountain toposequence representative of the main land uses in Mediterranean agroecosystems (forest, abandoned arable land and cultivated arable land).
Additionally, SOC, ACF and SCF contents of the soil samples were compared according to soil type, land use and soil conservation status to examine their variability along the toposequence and to determine the relationship between SOC content, soil management practices and soil redistribution processes. Knowledge of SOC dynamics comparing agricultural, abandoned arable land and forest soils along a Mediterranean toposequence can help to promote SOC sequestration and improve soil productivity.
MATERIALS AND METHODS
Study area
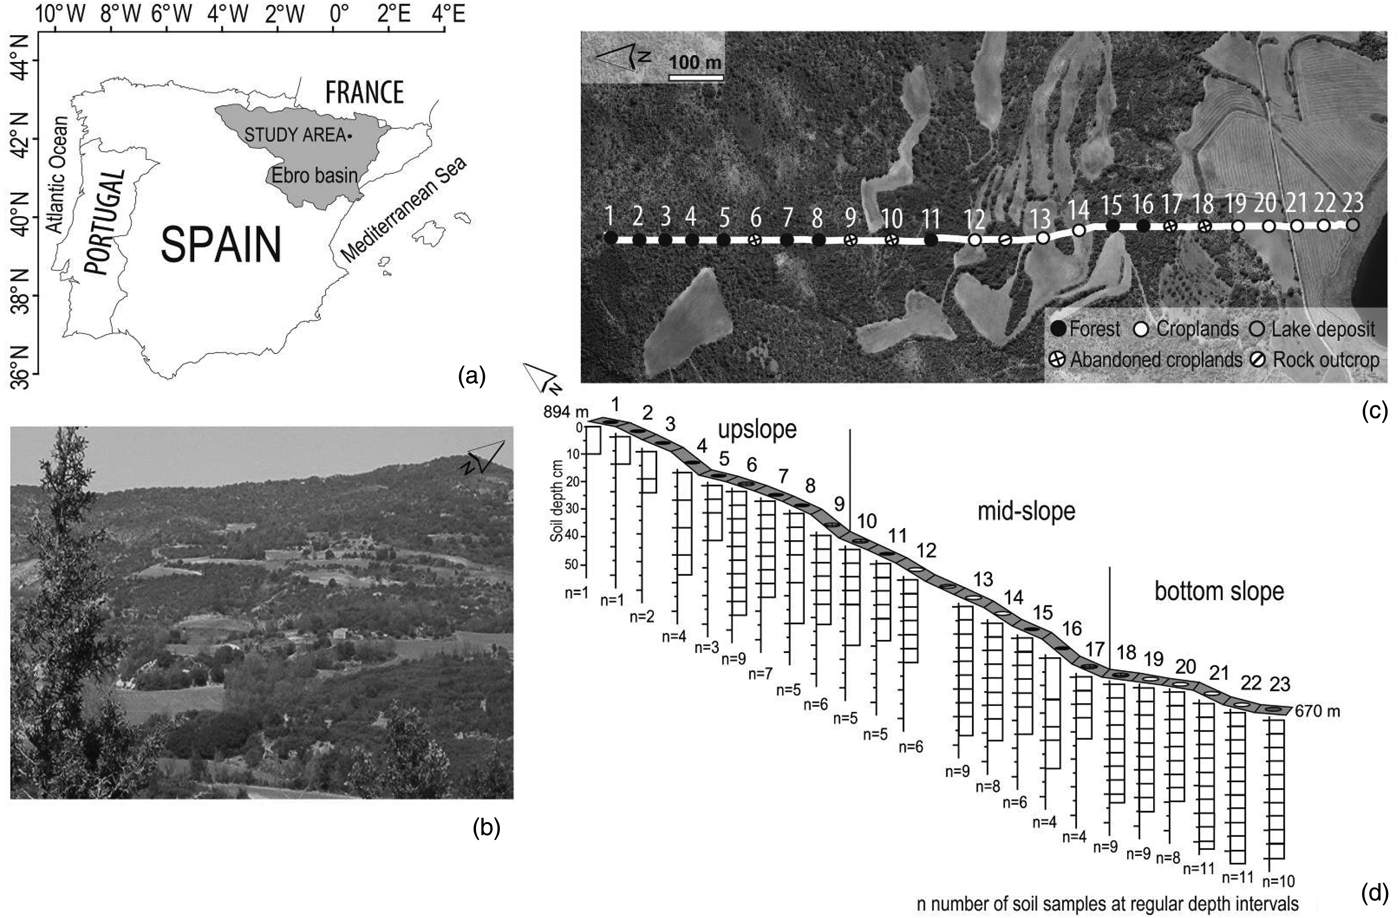
The study was conducted along a representative toposequence in the central part of the pre-Pyrenees in northeast Spain (42°2′N, 0°31′E, 738 m a.s.l.) (Figs 1(a) and (b)). The climate is continental Mediterranean, characterized by dry summers. The mean annual temperature is 12·8 °C ranging from 4·2 °C in January to 21·6 °C in June. The mean annual rainfall is around 500–550 mm and heavy rainfall events occur mainly in spring (April and May) and autumn (September and October) with large inter-annual and inter-monthly variations (López-Vicente et al. Reference López-Vicente, Navas and Machín2008). The mean potential evapotranspiration (calculated using the CropSyst simulation model version 4.04.14) is 1011 mm/year (López-Vicente Reference López-Vicente2008).
(a) Location of the study area in the central part of the pre-Pyrenees (NE Spain). (b) View of the study area, (c) and (d) the position, land use and number of soil samples of the soil sampling sites along the toposequence.

A north to south transect from previous research by Gaspar et al. (Reference Gaspar, Navas, Walling, Machín and Gómez Arozamena2013a) was selected. It was 1250 m long and run from the divide to the valley floor of a characteristic Mediterranean mountain agrosystem with different soil types and land uses. Soils were stony with an average stone proportion of 0·28, reaching as much as 0·76, and soil depths did not exceed 60 cm. Five soil types were identified (Machín et al. Reference Machín, López-Vicente, Navas, Benavente and Gracia2008) belonging to Entisol and Inceptisol orders (Soil Survey Staff 1999). Lithic Xerorthent and Calcixerollic Xerochrept (Leptosols and Calcisols, respectively, according to WRB 2014) were associated with limestones and Gypsic Xerochrept, Typic Xerorthent and Typic Fluvaquent (Gypsisols, Regosols and Gleysols, respectively, according to WRB 2014) were developed on Keuper facies. The predominant soils in the toposequence were Calcixerollic Xerochrept and Typic Xerorthent. Lithic Xerorthent and Calcixerollic Xerochrept were located at the upper part of the slope under a Quercus forest. Gypsic Xerochrept occupied mid-slope positions and were used to cultivate cereals. Typic Xerorthent also appeared on the middle slope but predominated at the bottom slope, where cereals were grown under a traditional tillage system. Typic Fluvaquent were located at the bottom of the toposequence, bordering a karstic lake, and were covered by dense riparian vegetation.
Sampling sites
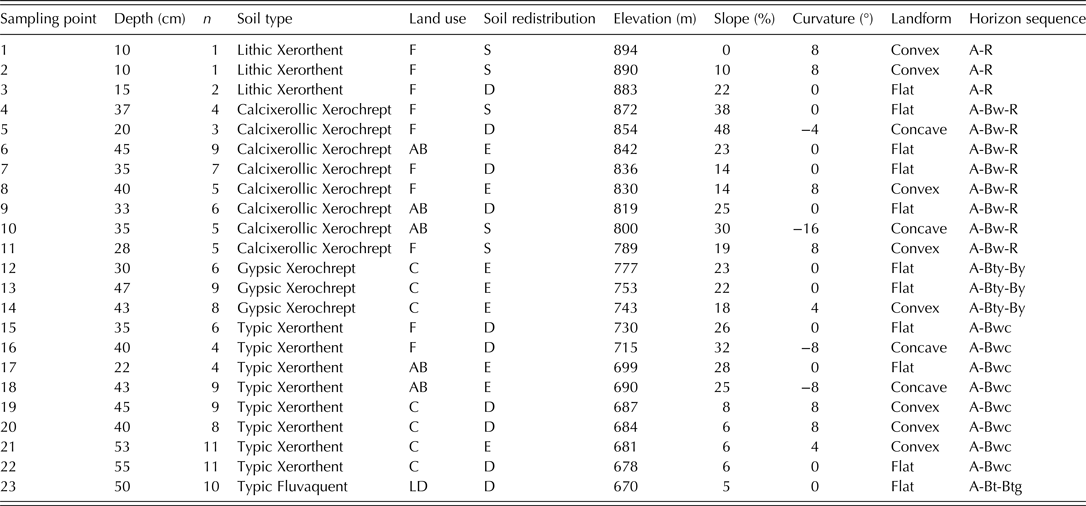
A total of 24 sampling sites were established along the south-facing slope transect with a mean slope value of 21%; and the sampling points were located 50 m apart. However, in the middle of the transect, a sampling site located on a thick Muschelkalk outcrop with no soil was not sampled (Fig. 1(c)), so that only 23 soil depth profiles were actually sampled from the 24 sites. According to the physiographic characteristics of the transect (Table 1) it was divided into three parts, namely, upper slope, mid-slope and bottom slope (Fig. 1(d)). Soil redistribution patterns, assessed by means of 137Cs-derived estimates along the slope transect from a previous study by Gaspar et al. (Reference Gaspar, Navas, Walling, Machín and Gómez Arozamena2013a) were used to identify and classify the 23 soil depth profiles as stable, eroded and depositional sites (Table 1). The 137Cs reference inventory for the study area is 1570 ± 80 Bq/m2. Soil profiles with 137Cs values lower than the 137Cs reference inventory indicated that soil was affected by erosion processes, whereas higher values of 137Cs inventory indicated soil deposition.
Characteristics of the sampling points along the toposequence
F, forest; AB, abandoned arable lands; C, cultivated arable lands; LD, Lake Deposit; S, stable; E, eroded; D, depositional.
n, number of soil samples at regular depth intervals.
A, the top layer of a soil profile with high accumulation of organic matter; Bt, subsurface horizon with accumulation of silicate clay; Btg, subsurface horizon with accumulation of silicate clay and changes in the colour indicating the presence of redox processes; Bty, subsurface horizon with accumulation of silicate clay and gypsum; Bw, subsurface horizon with a minimal amount of illuviation; Bwc, subsurface horizon with a minimal amount of illuviation and accumulation of secondary carbonate concretions; By, subsurface horizon with accumulation of gypsum; R, bedrock.
The study area was not affected by 137Cs fallout from the Chernobyl nuclear accident (García-León et al. Reference García-León, Manjón and Sánchez-Angulo1993) and there was no evidence that might contribute to spatial differences in its initial deposition. In contrast to the heterogeneity found by Niemann et al. (Reference Niemann, Jahnke and Feige1989) in West Germany after the Chernobyl accident and data showing higher 137Cs interception in forests than in agroecosystems (Schimmack et al. Reference Schimmack, Bunzl, Kreutzer and Schierl1991; Proehl & Hoffman Reference Proehl and Hoffman1994), for the climate conditions and characteristics of Mediterranean forests (Navas et al. Reference Navas, Walling, Quine, Machín, Soto, Domenech and López-Vicente2007) (both regarding tree size and density of vegetation cover), no differences were found in 137Cs reference inventories in relation to the different land uses in the study area (Gaspar & Navas Reference Gaspar and Navas2013; Gaspar et al. Reference Gaspar, Navas, Walling, Machín and Gómez Arozamena2013a).
Fifteen sampling sites were under a Mediterranean forest with natural vegetation that included Quercus coccifera, Quercus rotundifolia, Buxus sempervirens, Juniperus oxycedrus and scrubland (Thymus vulgaris, Rosmarinus officinalis, Lavandula latifolia and Echinospartum boissieri). Seven sampling sites were on agricultural land given over to cereal cultivation (Hordeum vulgare L.). Sampling point 23, located at the final end of the toposequence, had riparian vegetation (Typha angustifolia, Typha latifolia, Phragmites australis and Juncus ssp.).
Forest soils (soil profiles from 1 to 9) were located upslope in the toposequence where the mean slope was 24%, soil profiles 6 and 9 were on old abandoned arable land that had naturally re-vegetated with Q. coccifera, B. sempervirens, J. oxycedrus, R. officinalis and L. latifolia. The age of abandonment of arable land was around the middle of the 20th century. On the mid-slope section with a mean slope of 21%, soil profiles 10–17 had a mix of land uses: forest soils (soil profiles 11, 15 and 16), old abandoned arable land that had naturally re-vegetated (soil profiles 10 and 17) and fields cultivated for cereals (soil profiles 12, 13 and 14). The land has been cultivated since at least the 19th century using traditional practices and mechanical tillage commenced in the 1960s. Average annual cereal production is around 3000–3500 kg/ha. At the bottom of the slope with a mean value of 15%, most sampling points were on arable land (soil profiles 19, 20, 21 and 22): point 18 was on old abandoned arable land under forest and point 23 was a lake deposit with riparian vegetation.
One soil depth profile was taken at each sampling location. A total of 23 soil profiles were collected at different depths. The depth of sampling was selected to ensure the entire 137Cs depth profile was retained. However, depending on the soil thickness, the sampling depth varied from shallow soils where the bedrock was reached (profiles 1–11) to deeper soils where sampling depth extended up to 55 cm in cultivated arable land (profile 22). An 8·0-cm diameter hand-operated core sampler was used for shallow and stony soils and a 7·2-cm automated core-driller for deeper soils.
In order to study vertical distribution of 137Cs, SOC and carbon fractions, soil profiles were sectioned at regular 5-cm depth intervals, although some depth intervals were greater than 5 cm due to stoniness that caused difficulties when sectioning the soil cores. The number of soil samples from each soil profile depended on the sampling depth. The number of depth intervals varied from a minimum of one soil sample (profiles 1 and 2) to 11 soil samples (profiles 21 and 22) (Fig. 1(d)).
Soil organic carbon analysis
A total of 143 soil samples of a known volume, collected at regular depth intervals, were air-dried and weighed. Soil bulk density was calculated (g/cm3) by the core method, dividing the total weight by the known volume for each interval. Then soil samples were passed through a 2-mm sieve in order to separate the coarse fraction (>2 mm) from the fine fraction (<2 mm). The coarse fraction was manually and gently cleaned with a brush to avoid including fine soil particles and aggregates in the >2 mm fraction. Because it is mainly composed of carbonate rock fragments, the coarse fraction does not retain 137Cs (Navas et al. Reference Navas, Walling, Quine, Machín, Soto, Domenech and López-Vicente2007). The fine fraction was used for radionuclide and carbon analyses and for the calculation of 137Cs and SOC inventories.
Soil organic carbon was analysed by the dry combustion method using a LECO RC-612 multiphase carbon analyser (LECO Corporation, St. Joseph, MI, USA) designed to differentiate forms of carbon by oxidation temperature (Rabenhorst Reference Rabenhorst1988; LECO 1996; Nelson & Sommers Reference Nelson, Sommers, Sparks, Page, Helmke, Loeppert, Soltanpour, Tabatabai, Johnston and Sumner1996; Torbert et al. Reference Torbert, Potter and Morrison1998; Wang & Anderson Reference Wang and Anderson1998). A soil sub-sample of the <2 mm fraction (0·1500 g) was ground to a very fine powder with a mortar and pestle and placed in a quartz boat. The LECO RC-612 was equipped with a tube furnace into which the quartz boat with the soil sample was inserted and combusted in a flow of oxygen. The carbon forms present in the soil samples were converted to CO2 according to a specific temperature programme. The carbon oxides that evolved were detected by an infrared detector and the amount of carbon was quantified and its content expressed as a weight percentage (%). Soil organic carbon inventory or stock (kg/m2) was calculated as the product of the organic carbon content (%) by the weight of the <2 mm fraction contained in the volume of the core and divided by the cross section of the core sampler.
Chichester & Chaison (Reference Chichester and Chaison1992) performed the total organic carbon combustion at 550 °C. According to López-Capel et al. (Reference Lopez-Capel, Krull, Bol and Manning2008) the decomposition of the most thermally labile components of SOC is released at approximately 300–350 °C during thermal decomposition because they are burnt rapidly and easily, while decomposition of more refractory and stable carbon occurs at higher temperatures (420–550 °C). The temperature of the furnace was programmed in two stages, at 350 and 550 °C, to oxidize the active and stable carbon fractions, respectively. The contents of active and stable carbon fractions were expressed in percentages (%) and converted into inventory or stock values (kg/m2).
A wide range of biological, chemical and physical procedures has been used to isolate, characterize and evaluate the distribution of the different SOC fractions. Acid hydrolysis is a common technique to isolate and quantify the more resistant carbon fraction of SOC by chemical extraction. This procedure has been applied in several SOC fractionation studies that found that acid hydrolysis is a useful method for obtaining estimates of the recalcitrant SOC pool (Xu et al. Reference Xu, Cheng, Koskinen and Molina1997).
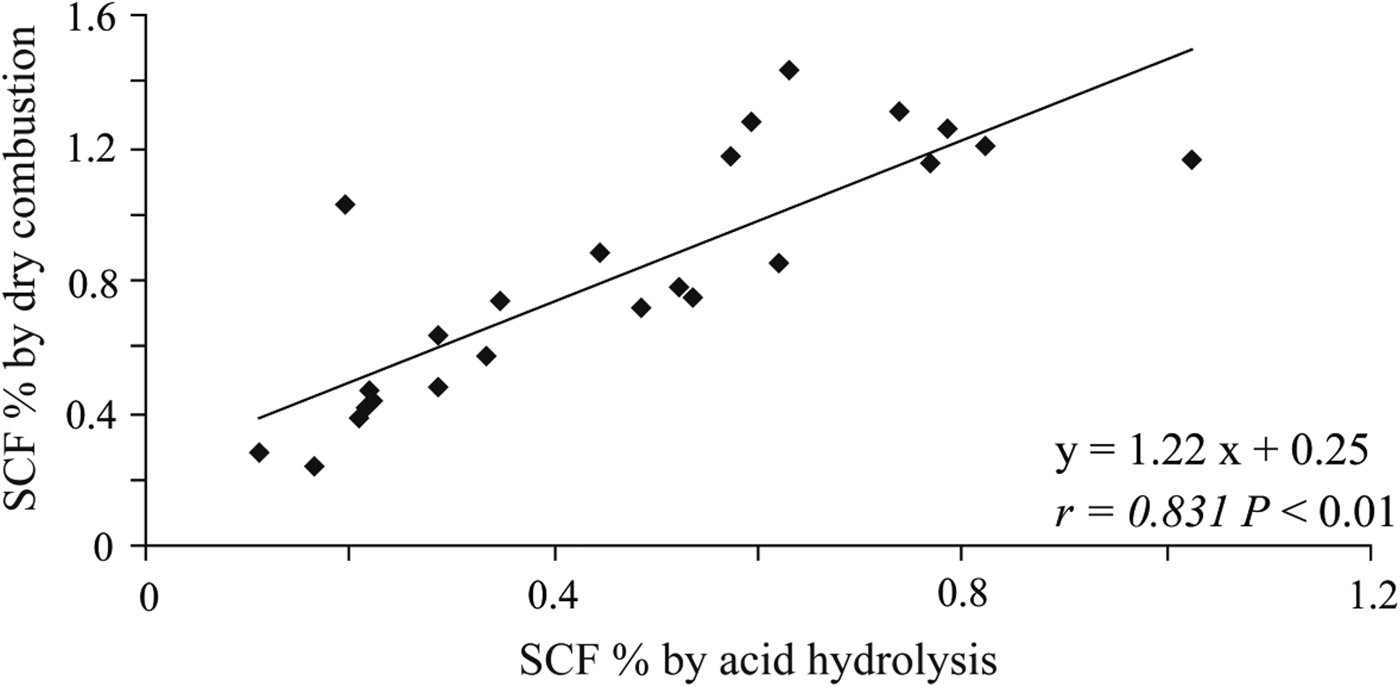
In the present study, acid hydrolysis has been used to check, evaluate and compare the results obtained by the dry combustion method. The SCF was determined in a total of 24 soil samples to include a wide range of SOC content. Acid attack with 6 M hydrochloric acid for 18 h at 105 °C removed the more chemically reactive carbon fraction and the un-hydrolysed residue was washed in deionized water with repeated centrifugation and decantation, then dried at 60 °C (Silveira et al. Reference Silveira, Comerford, Reddy, Cooper and El-Rifai2008) and analysed for carbon using a LECO RC-612 multiphase carbon analyser (LECO Corporation, St. Joseph, MI, USA). The high Pearson's correlation coefficient between stable carbon fractions measured with the dry combustion method and after acid hydrolysis (r = 0·831, P < 0·01) showed that the dry combustion method used in the present study was effective to characterize and assess the stable carbon fraction (Fig. 2).
Linear regression between the SCF content (%) measured by the dry combustion method and SCF content (%) measured by the acid hydrolysis technique.
Data analysis
Data were analysed using SPSS 19.0 (SPSS Inc., Chicago, IL, USA). One-way analysis of variance (ANOVA) was used to analyse differences between the means of 137Cs, SOC and SOC fractions. The effects of land use and soil redistribution on the dependent variables SOC, ACF and SCF content were tested using Fisher LSD tests. Pearson correlation matrix was established to determine the statistical significance of the relationships between SOC, SOC fractions and 137Cs activity and inventory. Soil profile 23, which is a lake deposit with riparian vegetation, was excluded from the statistical analyses.
RESULTS
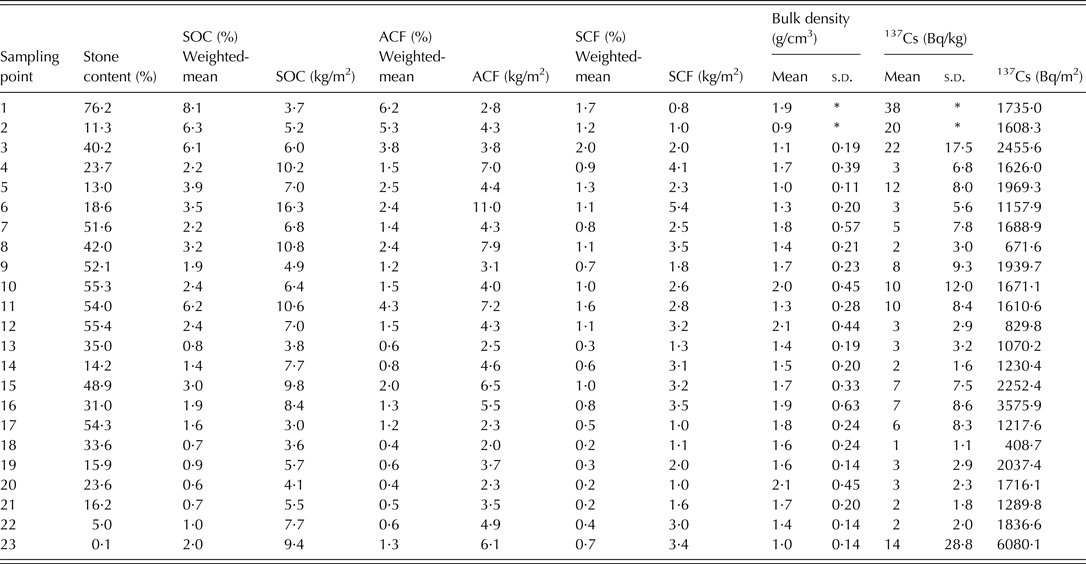
In the toposequence study the mean contents of SOC, ACF and SCF for all soil samples (n = 143) were 21, 14 and 7 g/kg (ranging from 0 to 79, 62 and 23 g/kg), respectively. The basic statistics of stone content, depth-weighted means (%) and total inventories (kg/m2) of SOC, ACF and SCF, bulk density and 137Cs content and inventories for each soil profile are presented in Table 2. All soil profiles were characterized by a higher ACF mean than SCF mean.
Basic statistics of stone content (by weight), SOC, ACF and SCF content and inventory, bulk density and 137Cs activity and inventory for each sampling point. For sampled depth at each sampling point, see Table 1
s.d., standard deviation.
* Sampling points 1 and 2 were on shallow Leptosol and only one soil sample was obtained; therefore there is no s.d. for these points.
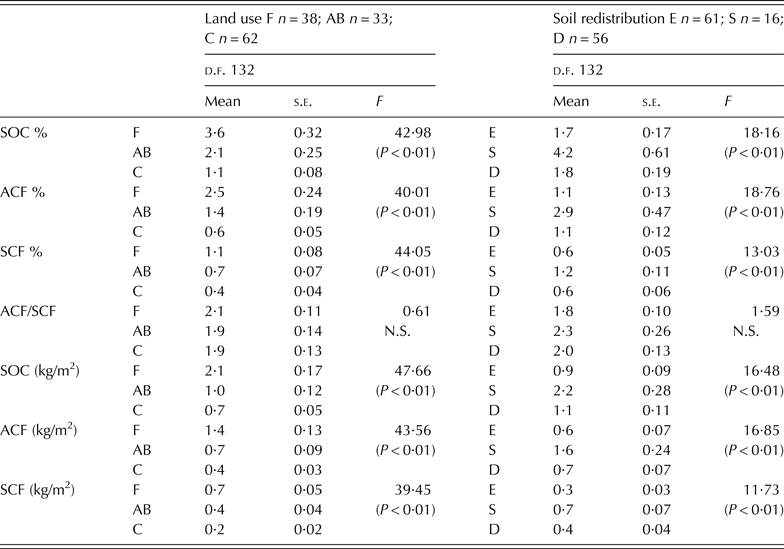
The means of SOC content by land use were 36 ± 20·2, 21 ± 14·3 and 11 ± 6·3 g/kg for forests, abandoned arable land and cultivated arable land, respectively, and there was a significant difference (P < 0·01) between them (Table 3). The means of bulk density were 1·4 ± 0·4, 1·6 ± 0·2 and 1·7 ± 0·3 g/cm3 in forests, abandoned arable land and cultivated arable land, respectively. Cultivated arable land had higher bulk densities than the other land uses although differences were not statistically significant.
ANOVA tests of SOC, ACF and SCF content and inventory and ACF/SCF ratio by land use and soil redistribution
F, forest; AB, abandoned arable lands; C, arable lands; S, stable; E, eroded; D: depositional.
s.e., standard error of the mean; d.f., total degrees of freedom.
P < 0·01 significance at the 99% confidence level; P < 0·05 significance at the 95% confidence level; N.S.: not significant.
Distribution of soil organic carbon
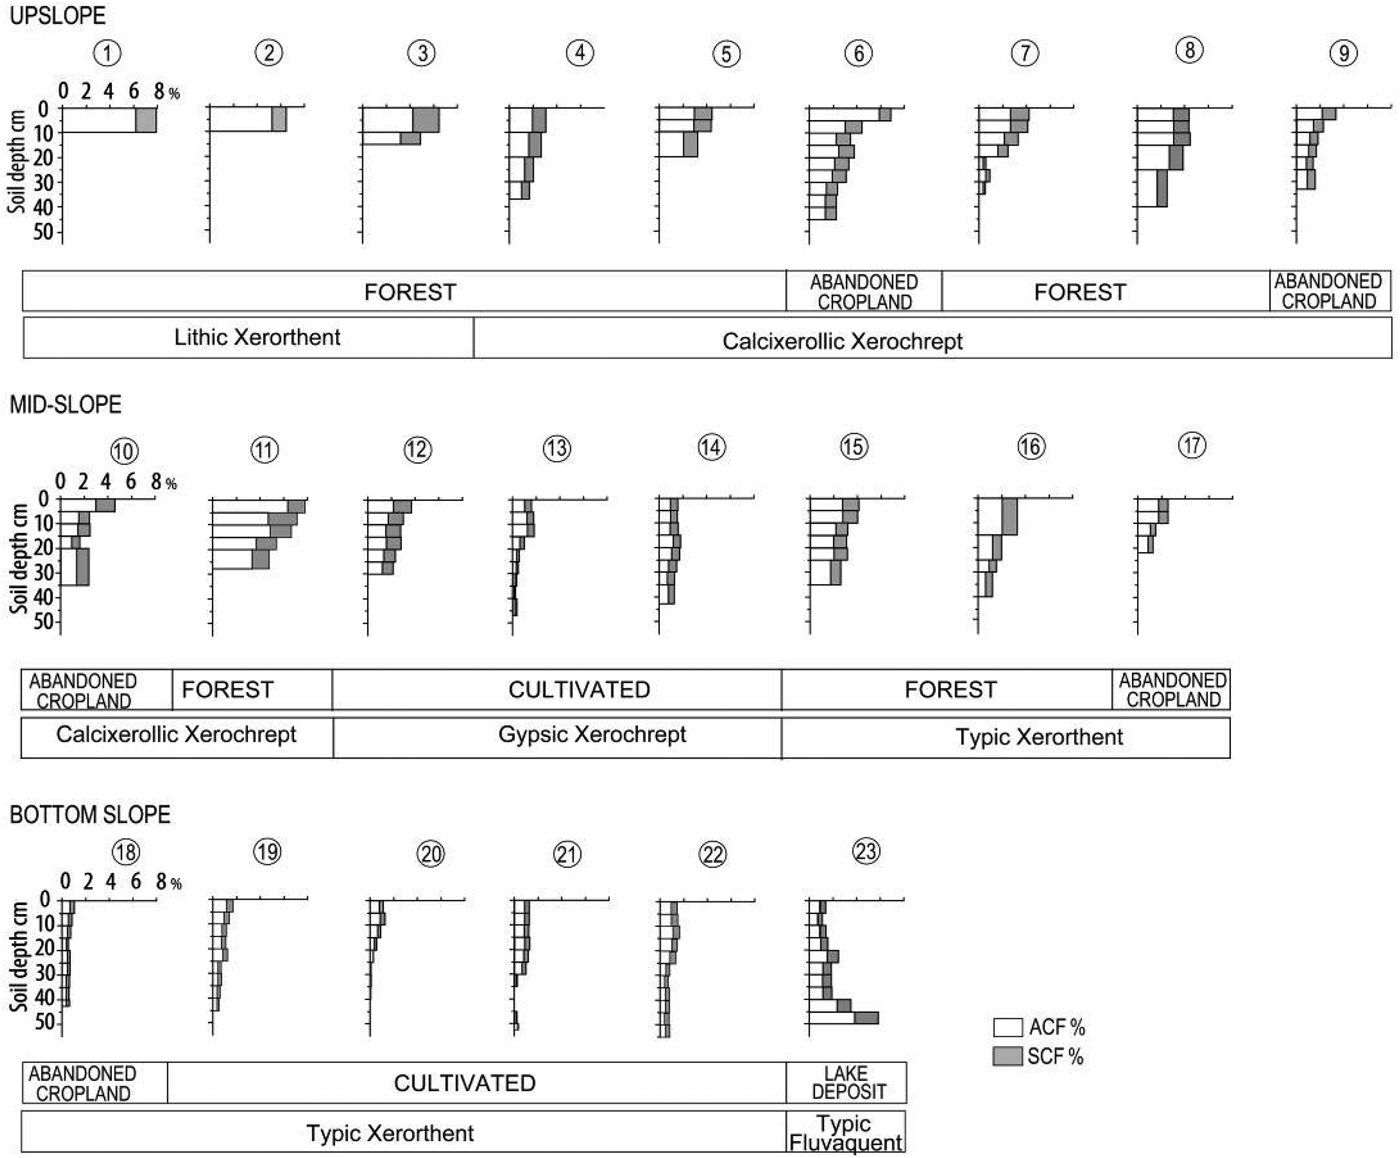
The distribution of SOC content in each soil profile showed that, as expected, surface layers were most rich in SOC, with the exception of sampling point 23 (lake deposit) where there was an increase of SOC with depth (Fig. 3).
Depth distribution of ACF and SCF content (%) in the soil profiles of the upper, middle and bottom slope parts of the study toposequence.
Variations in SOC content with depth were non-linear and a general exponential decrease of SOC was found in the soil profiles. In forest profiles that maintained the original vegetation, ACF and SCF content decreased gradually from the soil surface to deeper soil layers, whereas in disturbed abandoned and cultivated arable land profiles the ACF and SCF content were more uniformly distributed, due to tillage. These patterns are in agreement with that of the 137Cs (Bq/m2) depth distributions (Figs 4 and 5).
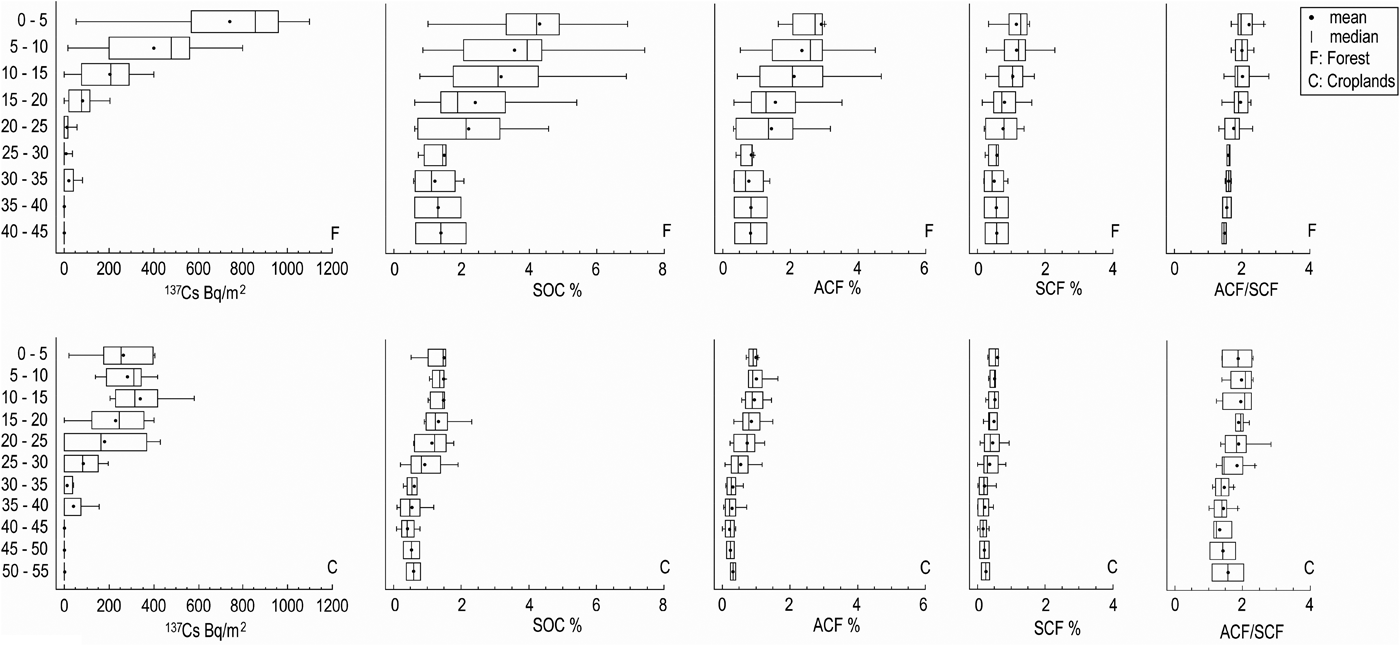
Depth distribution of 137Cs inventory (Bq/m2), SOC, ACF and SCF contents (%) and ACF/SCF ratio by land use/land cover (forest and arable lands profiles).
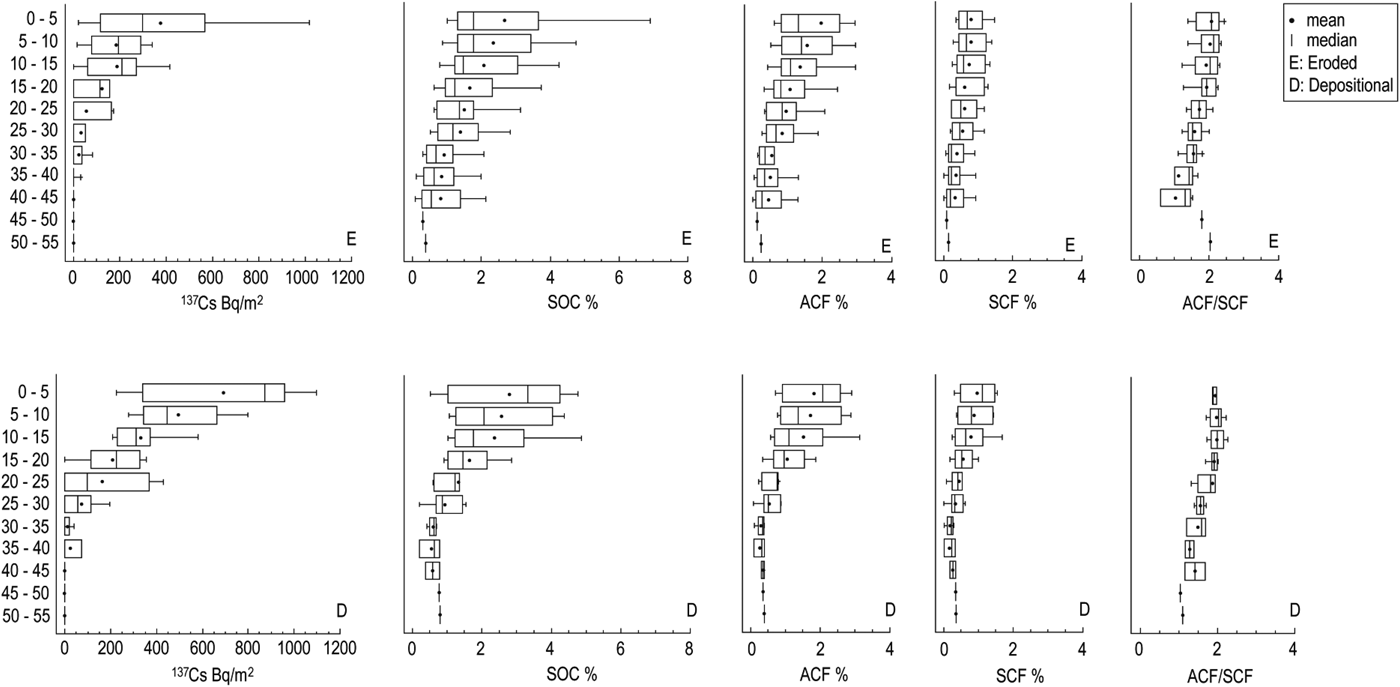
Depth distribution of 137Cs inventory (Bq/m2), SOC, ACF and SCF contents (%) and ACF/SCF ratio by soil redistribution processes (eroded and depositional profiles).
In the toposequence studied, the mean SOC content in topsoil (0–20 cm) was 28 ± 19·1 g/kg, which was significantly higher (P < 0·05) than the mean SOC content (11 ± 8·6 g/kg) in the subsoil (20–55 cm). The percentage of SOC content in the first 20 cm ranged between 50 and 88% of the total SOC in the whole soil profile.
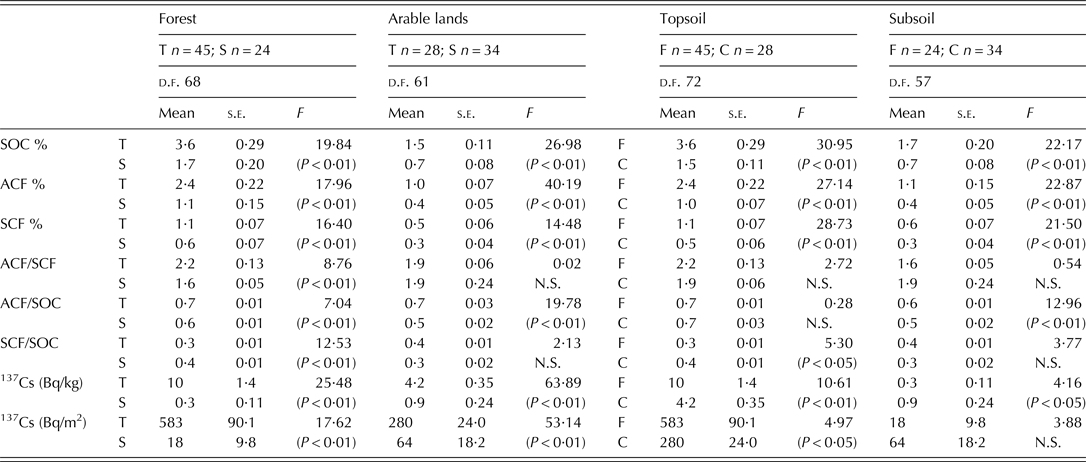
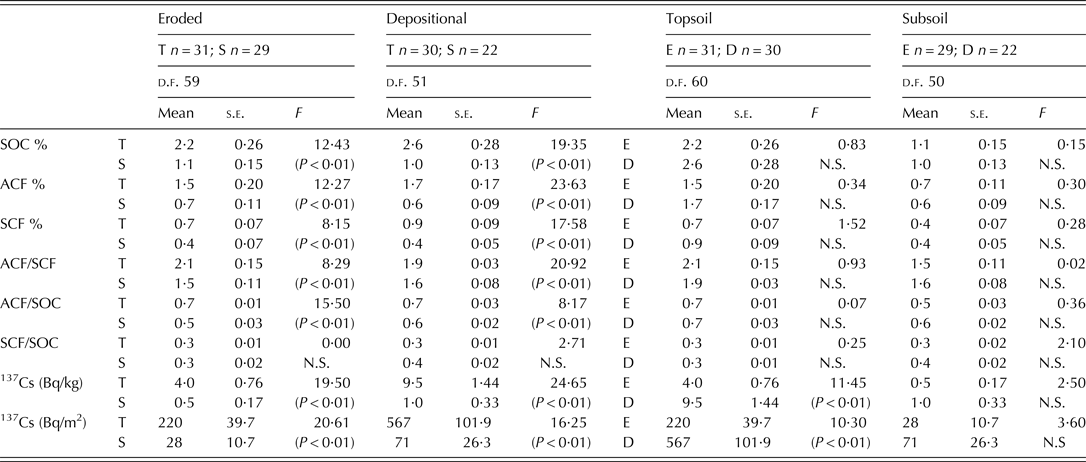
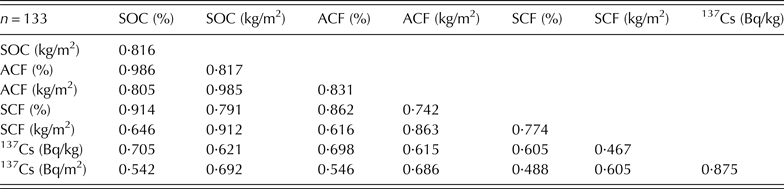
The sampling sites on old abandoned arable land were considered within the forest soil group because the 137Cs profiles (Gaspar & Navas Reference Gaspar and Navas2013) indicated that they had been undisturbed since the 1950s, and over recent decades they have recovered their natural vegetation. In topsoil samples the mean content of SOC, ACF and SCF were significantly higher (P < 0·01) than in sub-soils according to land use/land cover (forest and cultivated) (Table 4) and soil redistribution processes (eroded and depositional) (Table 5). Similarly, topsoils had significantly higher 137Cs activity and inventories than subsoils. The ACF and SCF pattern distributions were similar to the depth distribution of the 137Cs inventory in both the forest soils and cultivated arable land of the toposequence. The correlations between SOC, ACF and SCF and 137Cs were positive and statistically significant (P < 0·01) (Table 6).
ANOVA tests of SOC, ACF and SCF content, ACF/SCF, ACF/SOC, SCF/SOC ratios and 137Cs activity and inventory by land use and soil depth
T, topsoil; S, subsoil; F, forest; C, arable lands.
s.e., standard error of the mean; d.f., total degrees of freedom.
P < 0·01 significance at the 99% confidence level; P < 0·05 significance at the 95% confidence level; N.S., not significant.
ANOVA tests of SOC, ACF and SCF contents, ACF/SCF, ACF/SOC, SCF/SOC ratios and 137Cs activity and inventory by soil redistribution and soil depth
T, topsoil; S, subsoil; E, eroded; D, depositional.
s.e., standard error of the mean; d.f., total degrees of freedom.
P < 0·01 significance at the 99% confidence level; P < 0·05 significance at the 95% confidence level; N.S., not significant.
Pearson correlation coefficients between the content of SOC, SOC fractions and 137Cs activity and inventory
ACF, active and decomposable fraction; SCF, stable carbon.
All correlations significant at P < 0·01.
The box plots in Fig. 4 show the vertical distribution of 137Cs inventory, SOC, ACF and SCF content for all forest and cultivated profiles. In forest soils a steep decrease of 137Cs inventory, SOC, ACF and SCF content was observed with increasing depth, within the first 25 cm, whereas below this depth 137Cs inventory, SOC, ACF and SCF content were more homogeneous. The vertical distribution of 137Cs inventory, SOC, ACF and SCF (%) in cultivated arable land showed that below the ploughing depth, 20–25 cm in the study area, the depletion of 137Cs, SOC, ACF and SCF was evident, while above this depth ploughing evened out SOC content distribution.
The relative contribution of ACF to total SOC was slightly higher and significantly different in topsoil compared to subsoil in both forest and cultivated arable land (Table 4). However, when ACF/SOC values were compared in forest and cultivated topsoil, a similar contribution of ACF to total SOC was found, while in cultivated subsoil the contribution of ACF to SOC was significantly smaller (P < 0·01) than in forest subsoil. In forest soils, the relative contribution of SCF to total SOC was significantly higher (P < 0·01) in subsoil than in topsoil, whereas the ACF/SCF ratio was significantly lower (P < 0·01) in subsoil than in topsoil (Table 4). Therefore, forest subsoils had a higher proportion of stable carbon fraction. On the other hand, there was a relatively lower contribution of SCF to SOC in cultivated subsoils compared to forest subsoils.
When comparing eroded (6, 8, 12, 13, 14, 17, 18 and 21) and depositional soil profiles (3, 5, 7, 9, 15, 16, 19, 20 and 22), 137Cs inventory, SOC, ACF and SCF content decreased gradually with depth (Fig. 5). In depositional profiles there was a marked decrease in SOC content with depth whereas in the eroded ones this trend was less evident. The eroded soils presented a lower 137Cs inventory and slightly lower SOC, ACF and SCF content in the topsoil than in the depositional soil profiles but had slightly higher SOC, ACF and SCF content in the subsoil than in depositional soils (Table 5). However, mean of SOC, ACF and SCF content were not statistically different between eroded and depositional soils for both topsoil and subsoil.
Similar values of the relative contributions of ACF and SCF to SOC were found in eroded and depositional soils. Furthermore, the relative contribution of ACF to total SOC and the ACF/SCF ratio were slightly higher and significantly different (P < 0·01) in topsoil compared to subsoil. However, there were no differences in the relative contribution of SCF to SOC in topsoil and subsoil of both eroded and depositional soils.
Lateral distribution of soil organic carbon
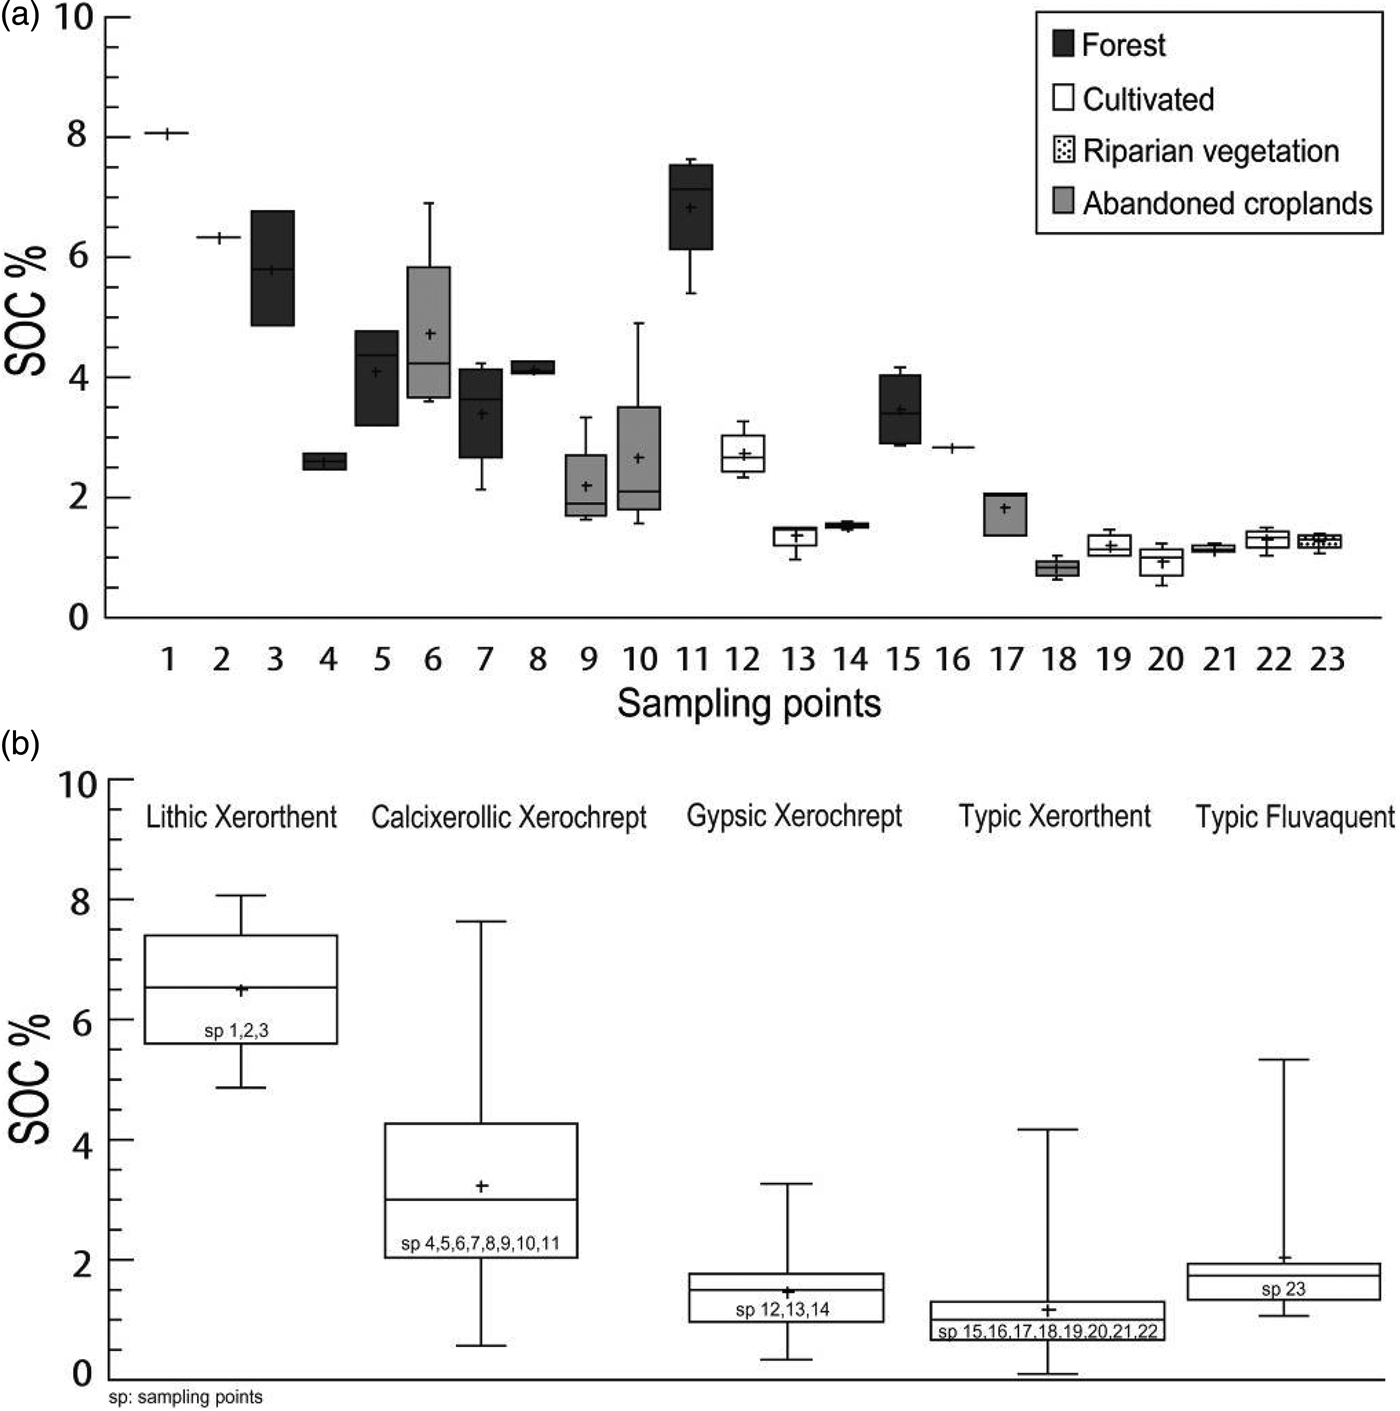
Figure 6(a) shows the lateral variability of topsoil SOC content along the toposequence. There was great spatial variability but, in general, forest soils had higher SOC content and lower SOC content were found in cultivated arable land (profiles 12, 13, 14, 19, 20, 21 and 22) and also in abandoned arable land (profiles 6, 9, 10, 17 and 18).
(a) Box-plots of topsoil SOC contents (%) along the toposequence. (b) Box-plots of SOC contents (%) by soil type along the toposequence.
Most forest soil profiles were on Lithic Xerorthent and Calcixerollic Xerochrept located upslope that had the highest SOC mean content, 65 ± 13·2 and 32 ± 17·9 g/kg, respectively. On the other hand, most cultivated profiles were on Gypsic Xerochrept and Typic Xerorthent with lower mean SOC content of 15 ± 7·6 and 12 ± 8·5 g/kg, respectively. The SOC content varied along the toposequence (Fig. 6(b)), from the upper part of the slope where Lithic Xerorthent were located, to the mid-slope consisting of Calcixerollic Xerochrept and Gypsic Xerochrept, to the bottom slope where Typic Xerorthent were found and finally Typic Fluvaquent at the bottom end of the toposequence.
The soil type is linked to land use, therefore the lateral distribution of SOC, ACF and SCF were examined in relation to two main factors: (i) land use and (ii) soil redistribution processes. The means of soil carbon fractions and SOC (% and kg/m2) were significantly different (P < 0·05) between the different land uses (Table 3). The SOC content in forest and abandoned arable land were more than 3 and 2 times, respectively, the concentration in cultivated arable land.
The means of SOC, ACF and SCF content (%) and inventories (kg/m2) on eroded sites were slightly lower than on depositional sites although a statistically significant difference was not found. However, the mean content and inventories of SOC on stable sites were 2·5 and 2·3 times higher and significantly different (P < 0·01) from eroded and depositional soil samples, respectively, and similar results were observed for ACF and SCF content (Table 3).
DISCUSSION
The decrease with depth of SOC and SOC fractions in forest, abandoned arable land and cultivated profiles is commonly found in several environments (Jiménez et al. Reference Jiménez, Lal, Leblanc and Russo2007; Ritchie et al. Reference Ritchie, McCarty, Venteris and Kaspar2007). Furthermore, topsoils richer in SOC and SOC fractions than subsoils are in agreement with results found by Novara et al. (Reference Novara, La Mantia, Barbera and Gristina2012) when comparing the SOC content between topsoil and subsoil for different land uses in a Mediterranean agroecosystem.
Along the toposequence the differences in the vertical distribution of SOC, ACF and SCF content with depth were associated with land use history. The changes in SOC content after cultivation influences a number of soil properties and have an effect on the distribution of SOC within the soil profile (Gregorich et al. Reference Gregorich, Greer, Anderson and Liang1998). One of the most relevant changes triggered by tillage is the decline observed in SOC content compared to those in forest soils, despite the remaining forests being altered woods, more or less intensively managed by man, that often correspond to different stages of regressive succession of the original forest (Scarascia-Mugnozza et al. Reference Scarascia-Mugnozza, Oswald, Piussi and Radoglou2000).
Forest soil profiles showed a marked exponential decrease of SOC, ACF and SCF content with depth typical of undisturbed sites. These findings are in agreement with those of a forested toposequence in the Spanish Pyrenees, where a clear decrease of organic matter content with depth was found. A sharp decrease occurred within the first 15, cm whereas below 20 cm the mean contents were more homogeneous with <1% of variation (Navas et al. Reference Navas, Machín and Soto2005b).
The degradation of these forests is due to human pressure associated particularly with deforestation, grazing, forest fires and land use changes (Valbuena-Carabaña et al. Reference Valbuena-Carabaña, López de Heredia, Fuentes-Utrilla, González-Doncel and Gil2010). In contrast, cultivated profiles showed more homogeneous distribution of SOC, ACF and SCF with depth, whereas SOC profiles in abandoned arable land represent an intermediate state between forest and cultivated arable land, indicating the relationship between SOC distribution with depth and land use.
The vertical distribution of SOC content compares well with that of 137Cs. Similarly, the 137Cs concentration decreases exponentially with soil depth in forest and abandoned arable land profiles. This is because 137Cs is concentrated in the upper soil layers (Gaspar & Navas Reference Gaspar and Navas2013) and its vertical migration is mainly due to physical processes related to redistribution processes (Walling & Quine Reference Walling and Quine1990). In cultivated profiles the 137Cs concentration was distributed homogeneously throughout the plough layer. Tillage processes mix the relatively low organic carbon and 137Cs concentration in deeper soil layers with that of surface soil layers that have higher organic carbon and 137Cs concentration. In this way SOC and 137Cs are uniformly distributed within the plough layer in cultivated profiles.
The positive and statistically significant correlations between SOC, SOC fractions and 137Cs suggest that both 137Cs and SOC distribution takes place following similar soil processes. In agreement with these findings, several authors have related the spatial and vertical distribution of 137Cs with the content of SOC (Guoxiao et al. Reference Guoxiao, Yibo and Yanlin2008) and have concluded that 137Cs and SOC are strongly and significantly correlated.
Along the toposequence, the lateral distribution of SOC showing lower SOC content in cultivated arable land than in abandoned arable land and forest soils confirm that SOC is sensitive to changes in land use and cultivation practices. As indicated by Rumpel (Reference Rumpel, Lemaire, Hodgson and Chabbi2011), SOC shows a relatively rapid response to human intervention. In line with findings by Boix-Fayos et al. (Reference Boix-Fayos, De Vente, Albaladejo and Martínez-Mena2009) in semi-arid Mediterranean agroecosystems, conversion from forest to cultivation causes changes in the type of vegetation cover that may have an influence on SOC content and distribution. In addition, land use changes from forest to cultivated arable land appear to be related to the decline of SOC and therefore past soil management practices may be reflected by SOC content (Collins et al. Reference Collins, Elliott, Paustian, Bundy, Dick, Huggins, Smucker and Paul2000). The decline of SOC observed in the cultivated arable land of the present study is probably related to a faster degradation of organic matter due to tillage, which improves soil aeration by the physical disruption of macro-aggregates in the plough layer, favouring the decomposition of the more bioreactive carbon fraction (Haynes Reference Haynes2005). In this way, the relative contribution of SCF to SOC increases in cultivated topsoils compared to forest topsoils, which is in line with the findings of Blanco-Moure et al. (Reference Blanco-Moure, Gracia, Bielsa and López2013) for other Mediterranean soils.
Lorenz et al. (Reference Lorenz, Lal and Shipitalo2011) found that most of the chemically and physically stabilized SOC pool occurred in the forest subsoil, as was also observed in the present study. The higher proportion of stable carbon fraction in forest subsoils can be associated with an increase of the turnover time with increasing soil depth. The SOC pool in forest subsoils plays an important role in the carbon cycle for carbon sequestration and long-term SOC storage. On the contrary, lower SOC content was found in cultivated subsoils, which can be related to the effect of tillage compaction. Higher bulk density values in cultivated arable land indicate low soil porosity and soil compaction, as tillage practices reduce water infiltration into the soil and increase physical soil compaction. Thus, tillage causes changes in the physical properties of soils and affects the distribution of soil carbon pools (Hamza & Anderson Reference Hamza and Anderson2005).
The observed different contributions of active and stable carbon fractions to SOC resulted from changes in land use and may provide an early indication of soil degradation. The ACF changes substantially after management (Coleman et al. Reference Coleman, Crossley and Hendrix1996) and it may be the fraction that was preferentially lost when soils under forest were converted to cultivated arable land. Because ACF is responsible for much of the biological activity in soil and has the greatest influence on soil quality, it may serve as sensitive indicator of soil quality (Islam & Weil Reference Islam and Weil2000).
Lower SOC, ACF and SCF content in eroded than in depositional profiles might suggest that soil redistribution processes affect SOC content and distribution of SOC pools. The decrease of SOC content with depth found in eroded profiles was not as marked as in depositional profiles. This difference may be related to soil erosion, which removes soil carbon from topsoil to deposition sites on the landscape (Ritchie & McCarty Reference Ritchie and McCarty2003), thus exposing the sub-surface layers with lower SOC content at the eroded site. Hence, erosion may be a significant factor in explaining the spatial variability of organic carbon content in these agroecosystems. Furthermore, cultivation affects soil structure by disrupting aggregates and exposing physically protected organic carbon, thus increasing soil erodibility. Consequently, cultivated arable land is more susceptible to soil degradation, as found along the study toposequence by Gaspar et al. (Reference Gaspar, Navas, Machín and Walling2013b) where soil erosion was predominant on steep cultivated sites, whereas lower rates occurred in forest soils, thus evidencing control by land use.
The results of the present study suggest that a combination of anthropogenic and environmental factors, such as land use and soil redistribution processes influenced the distribution of SOC and SOC fractions along the study toposequence.
CONCLUSIONS
The spatial variability of SOC content along a representative toposequence of Mediterranean agroecosystems was affected mainly by land use, which was closely related to soil type. Results show that a change in land use management from forest to cultivated arable land was related to a decline in SOC. The soils studied were characterized by higher contents of the active carbon fraction than of the stable carbon fraction. Both active and stable carbon fraction contents were higher and significantly different in topsoils than in subsoils, although the relative contribution of the stable carbon fraction in forest subsoils was higher than in cultivated subsoils. Tillage improves soil aeration, which encourages the decomposition of ACF and hence cultivated topsoils showed a significantly higher contribution of SCF to SOC compared to forest topsoils. The pattern of SOC and its fraction pools in the soil profiles was similar to that of 137Cs. The topsoil was richer in SOC, ACF and SCF than the subsoil, as was the case with 137Cs content. Vertical distributions were mainly due to physical processes related to redistribution processes and tillage practices. Moreover, 137Cs content was positively correlated with SOC suggesting that they followed the same redistribution pattern along the toposequence. The fine soil particles in the surface soil layers, which are relatively rich in organic carbon, are removed primarily by erosion processes as supported by the slightly higher amount of SOC in depositional profiles, compared with that found in the eroded ones.
Determining the amount and the distribution of the different carbon pools is useful for understanding SOC dynamics in Mediterranean agroecosystems and it is also essential for assessing the effects of management and land use on carbon fluxes and soil productivity. The results of the present study may help to improve the current scarce knowledge of SOC dynamics in Mediterranean agroecosystems and to highlight the need for further research into mechanisms that can explain why soil characteristics, land use and redistribution processes are factors that determine the differences in enrichment or depletion of SOC.
The current work was funded by the CICYT project EROMED (CGL2011-25486).