I. INTRODUCTION
Metal nanoparticle (NP) dispersed nanooxide films have attracted much attention for decades due to their enhanced nonlinear optical properties benefiting the fundamental studies and practical applications. The enhanced nonlinear optical properties are induced from the surface plasmon of resonance (SPR) of metal particles, and the optical absorption peak can be controlled in the visible range by adjusting the content, size, and shape of the particles.Reference Kreibig and Vollmer1, Reference Sella, Chenot, Reillon and Berthier2 Specially, silver NPs dispersed silica dioxide (Ag/SiO2) nanocomposite, which exhibit enhanced nonlinear optical properties in the visible range, have inspired growing interest on account of their potential applications in nonlinear optics,Reference Kreibig and Genzel3, Reference Persson4 photonic devices,Reference Stucky and Mac Dougall5, Reference Scalisi, Compagnini, D’Urso and Puglisi6 and fluorescence enhancement.Reference Guo, Guan, Lin, Zhang and Chen7 Nowadays, the methods available to prepare Ag/SiO2 composite film include chemical approach,Reference Scalisi, Compagnini, D’Urso and Puglisi6 ion beam mixing process,Reference Gangopadhyay, Kesavamoorthy, Nair and Dhandapani8 ion implantation,Reference Liu, Li, Feng, Ren and Wang9 magnetron sputtering,Reference Yang, Liu, Wang, Shi, Li and Zhang10, Reference Tanahashi, Yoshida, Manabe and Tohda11 and sol–gel method.Reference Babapour, Akhavan, Moshfegh and Hosseini12, Reference Jiao, Zhang, Ding, Chen and Zhang13 Among them, magnetron sputtering and ion implantation techniques can easily yield high-quality film but need high cost and vacuum conditions for preparation, as well as difficult to control component radio of the composite film and retain high mental content. Although chemical approach can easy to form Ag/SiO2 composite film with low cost, it is also hard to realize high mental content, which limits their optical absorption properties further enhancing. Sol–gel technique is one of the most common methods and provides many advantages over other methods because of their low formation temperature, high degree of homogeneity, high yield, small processing time, possibility of coating on large area substrates, easy to control component radio of the composite film, cost-effective, and environment friendly.Reference Babapour, Akhavan, Moshfegh and Hosseini12–Reference Chatterjee and Naskar14 Therefore, sol–gel technique is widely used in preparing Ag/SiO2 composite film. However, to the best of our knowledge, the forming mechanism of the Ag NPs dispersed SiO2 composite films prepared by sol–gel method has received less investigation. In this study, the structural transition, the formation, and the optical absorption property along with the relevant band gap of the Ag/SiO2thin films obtained by sol–gel method during the annealing process were investigated.
II. EXPERIMENTAL
The Ag/SiO2 composite thin film with 50 wt% Ag was prepared by a sol–gel spin-coating method. Tetraethyl orthosilicate [Si(OC2H5)4] and silver nitrate (AgNO3) were used as raw materials and 2-ethoxyethanol (CH3OCH2CH2OH) as a solvent. The concentration of precursor solutions was controlled at 0.445 mol/L. Volume ratio of CH3OCH2CH2OH to water was 1:8. Si(OC2H5)4, CH3OCH2CH2OH, and distilled water were mixed and stirred for 7 h at room temperature. Several drops of nitric acid were added before stirring as hydrolysis catalysis for adjusting the pH value of solution between 2 and 3. After dissolving silver nitrate in the above solution with a weight ratio of Ag/(Ag + SiO2) = 50 wt%, the solution was further stirred for 5 h. A transparent and colorless Ag/SiO2precursor solution was obtained.
The Ag/SiO2 nanofilms were spin coated on a glass substrate at a spin speed of 3000 rpm. After each coating, the precursor film was preheated at 150 °C for 30 s to remove the solvent and a small amount of water. Then, these sequences of coating and pretreatment were repeated 2 times for the absorption measurement and 10 times for the x-ray diffraction (XRD) analysis, respectively. The annealing temperature of Ag/SiO2nanofilms was carried out in the range from 200 to 600 °C for 30 min.
The thermal analysis was performed on the gel-dried powders using thermogravimetry–differential thermal analysis (TG–DTA; HCT-1, Beijing Optical Instrument Inc., China) analyzer with a heating rate of 10 °C/min. The crystal structure was analyzed using x-ray powder diffraction with a Cu Kα radiation (λ = 0.15406 nm) filtered through a Ni foil (RAD-B system; Rigaku, Tokyo, Japan). The average size of Au particle was calculated using the (111) reflection by the Scherrer equation D = Kλ/βcosθ, where D is the average particle size, K the Scherrer constant 0.89, λ the x-ray wave length 0.154 nm, and β the full width at half maximum (FWHM) of the XRD peak. The microstructure was observed by transmission electron microscopy (TEM; JEM-100CXП, JEOL, Tokyo, Japan). Fourier transform infrared (FTIR) transmission spectra were recorded using a FTIR spectrometer. Ultraviolet–visible absorption spectra of the films were measured in the range of 350–800 nm using a UV2800 spectrophotometer (UNICO Instruments Co., Ltd., China).
III. RESULTS
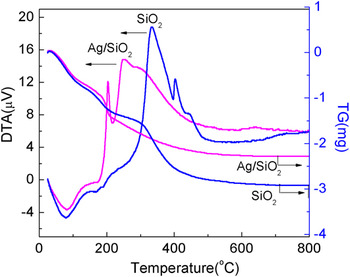
Figure 1 shows the DTA and TG curves of pure SiO2 and Ag/SiO2 powders, which were prepared by drying the precursor solution at 60 °C in air for a week. For the pure SiO2 powder sample, the weight loss occurs at three stages: namely, (i) below 200 °C, (ii) between 200 and 350 °C, and (iii) from 350 to 600 °C. Evidently, DTA curve corresponds to that of TGA, i.e., the two endothermic peaks and three exothermic peaks are just in the range of the significant weight loss, which is between 200 and 350 °C and from 350 to 600 °C. The big endothermic peak at 78 °C and the weak endothermic peak at 177.8 °C corresponding to a weight loss of 15% are due to the evaporation of both water and ethanol, which come from the hydrolysis and condensation reactions of Si(OC2H5)4 as indicated in the reactions [Eqs. (1) and (2)]Reference Monsivais-Gámez, Ruiz and Martínez15:
 $${\rm{Si}}({\rm{OC}}_2 {\rm{H}}_5 )_4 + {\rm{H}}_2 {\rm{O }} \to \!({\rm{OC}}_2 {\rm{H}}_5 )_3 {\rm{Si}}-{\rm{OH}} + {\rm{C}}_2 {\rm{H}}_5 {\rm{OH\quad,}}$$
 $$({\rm{C}}_2 {\rm{H}}_5 {\rm{O}})_3 {\rm{Si}}-{\rm{OH}} + {\rm{HO}}-{\rm{Si}}({\rm{OC}}_2 {\rm{H}}_5 )_3 \to ({\rm{C}}_2 {\rm{H}}_5 {\rm{O}})_3 {\rm{Si}}-{\rm{O}}-{\rm{Si}}({\rm{OC}}_2 {\rm{H}}_5 )_3 + {\rm{H}}_2 {\rm{O}}{\rm{\quad.}}$$
DTA–TG curve of gel powders for the pure SiO2 and Ag/SiO2. (color online)

The exothermic peak at 345 °C is attributed to the pyrolysis of the residual oxyethyl groups (–OC2H5).Reference Parashar, Raman and Bahl16 And the peaks at 413 and 455 °C may be ascribed to the combustion of residual carbon in the matrix and organic compounds.Reference Stefanescu, Stoia and Stefanescu17, Reference Que, Zhou, Lam, Chan, Tan, Tan and Kam18 While in this process, SiO2 was finally obtained after decomposition reaction of SinOn(OH)4−n, which was formed through the dehydration and condensation reactions after the −OH replaced the −C2H5O group of (C2H5O)3Si–O–Si(OC2H5)3. Such reaction may continue until 700 °C since the weight loss ended till this temperature. However, for the Ag/SiO2 powder sample, a similar trace below 200 °C and an obvious difference over 200 °C are observed in Fig. 1 compared with the SiO2 powder sample. The three exothermic peaks at 203, 250, and 280 °C, respectively, indicate that the pyrolysis reaction and removal of residual organic compounds were accelerated by adding AgNO3 into the SiO2 precursor solution. However, no peaks around 440 °C resulting from the decomposition of silver nitrate were detected,Reference Liu, Li, Feng, Ren and Wang9 indicating that the Si(OC2H5)4and silver nitrate should react below 345 °C, which will be discussed later.
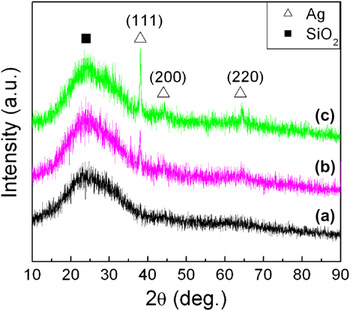
Figure 2 shows XRD patterns of the as-deposited Ag/SiO2 thin film and the annealed counterparts. A broad diffraction peak at 25° for all the samples corresponds to the amorphous SiO2 matrix and/or the glass substrate.Reference Colthup, Daly and Wiberiey19 No diffraction peaks of Ag crystal appear in the as-deposited sample. When the thin film was annealed at 300 °C, three diffraction peaks are observed at 38.1°, 44.4°, and 64.6°, which attribute to the Ag (111), (200), and (220) planes, respectively, demonstrating the formation of Ag particles in SiO2matrix. Furthermore, those three diffraction peaks intensify with raising annealing temperature from 300 to 500 °C, suggesting the improvement of crystalline Ag particles. Besides, the mean sizes of the Ag particles calculated by the Scherrer equation increase from 10 to 20 nm as the annealing temperature raises from 300 to 500 °C.
XRD patterns of as-deposited (a) Ag/SiO2thin film and the annealed counterparts at 300 °C (b) and 500 °C (c). (color online)

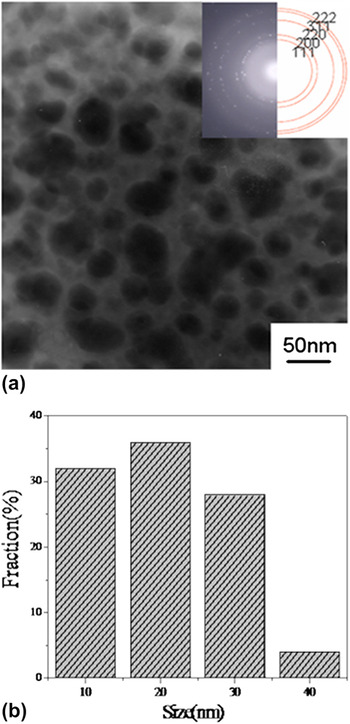
Figure 3(a) shows the bright field TEM micrograph and the corresponding selective area electron diffraction pattern of Ag/SiO2 thin film annealed at 500 °C. As shown in the inset of Fig. 3(a), the diffraction rings from inner to outer correspond to Ag crystal faces (111), (200), (220), (311), and (222) of Ag/SiO2 thin film, respectively, which coincide well with that of the XRD analysis. The bright field TEM micrograph indicates that Ag particles are basically spherical and dispersed in the SiO2 matrix. Figure 3(b) shows the corresponding particle size distribution histogram of the Ag particles. As can be seen that the size of Ag particles is in the range of 10–40 nm, and the maximum size is 40 nm. However, according to our calculation by the method of Soderlund et al.,Reference Soderlund, Kiss, Niklasson and Granqvist20 the distribution does not obey lognormal distribution function, maybe resulting from the different growth mechanism.
(a) TEM micrograph and the selected area electron diffraction patterns of Ag/SiO2thin film annealed at 500 °C. (b) The particle size distribution histogram of the sample corresponding to (a). (color online)

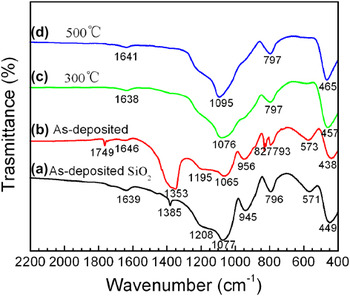
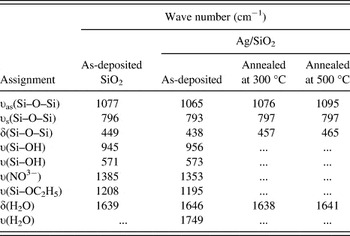
FTIR transmission spectra of the as-deposited Ag/SiO2 film, the corresponding samples, which were annealed at 300 °C (c) and 500 °C (d), respectively, and the as-deposited pure SiO2 are included in Fig. 4 for comparison. For the pure SiO2 sample, there are eight absorption peaks at 1077, 796, and 449 cm−1 for Si–O–Si bonds,Reference Karmakar, De and Ganguli21–Reference De, Kundu, Karmakar and Ganguli23 at 945 and 571 cm−1 for Si–OH bonds,Reference Monsivais-Gámez, Ruiz and Martínez15, Reference Jeon, Yi and Oh24 at around 1200 cm−1 for Si–OC2H5 bands,Reference Wang, Zhang and Feng25 at 1385 cm−1 for O–N–O bands,Reference Colthup, Daly and Wiberiey19 and at 1639 cm−1 for H–O–H bound,Reference Stefanescu, Stoia and Stefanescu17 respectively. The Si–O–Si band centered at 449 cm−1 is assigned to transverse–optical rocking motions, and the Si–O–Si band centered at 796 cm−1 is due to transverse–optical symmetric stretching of the O atom. The highest frequency band near 1077 cm−1 with the highest intensity is associated with the asymmetrical O–Si–O stretch motion in which adjacent O atoms move in phase with each other.Reference Innocenzi26, Reference Martinez, Ruiz, Vorobiev, Pérez-Robles and González-Hernández27 The Si–OH vibrations detected at 571 and 945 cm−1 are probably due to silanol groups. The Si–OC2H5 band around 1200 cm−1 can be assigned to the incomplete hydrolysis of Si(OC2H5)4. The O–N–O band at 1385 cm−1 is attributed to NO3− ions. The band of 1639 cm−1 is due to the H–O–H deformation, which indicates the presence of water incorporated in the silica matrix.Reference Stefanescu, Stoia and Stefanescu17 The assignments and the wave number values of the bands observed for all the samples are listed in Table I.
FTIR spectra of the as-deposited SiO2 thin film (a) as well as the as-deposited Ag/SiO2thin films (b) and their annealed samples at 300 °C (c) and 500 °C (d). (color online)

Vibrational bands assignment and wave number (cm−1) of the as-deposited SiO2, as-deposited, and annealed Ag/SiO2at 300 and 500 °C.

When silver nitrate was added to the Si(OC2H5)4 precursor solution, all Si–O–Si bands shift to lower wave number from 1077, 796, and 449 cm−1 to 1065, 793, and 438 cm−1, respectively, along with a decreased intensity as shown in Fig. 4(b). The decreased wave numbers imply a reduction in the vibrational energy,Reference Parler Caroline, Ritter James and Amiridis Michael28 and the weakened original silica gel network may be attributed to the addition of silver nitrate. However, both Si–OH stretching bands shift to higher wave number from 945 and 571 cm−1 to 956 and 573 cm−1, and the intensity of the 945 cm−1 peak becomes weaker. A fact is that the frequency position of Si–OH bands is related to the degree of hydrogen bonding in the film; therefore, the peak shift to a high wave number could be attributed to an increase in the Si–OH force constant.Reference Niznansky and Rehspringer29 And the O–N–O band at 1385 cm−1 is intensified because of the adding of NO3−. Besides those, a special feature for the Ag/SiO2 sample is the appearance of new absorption peaks at 827 and 1749 cm−1, which are considered as the Si–O–Ag bond vibrations and a hydrophilic silica xerogel structure that can form by absorbing water from air, respectively.
When the Ag/SiO2 film was annealed at 300 and 500 °C, the Si–O–Ag band at 827 cm−1, two Si–OH bands at 945 and 571 cm−1, and O–N–O band at 1385 cm−1 along with absorption band at 1749 cm−1 disappear as shown in Figs. 4(c) and 4(d). All the Si–O–Si bands intensified and shift to higher wave number, to 1076, 797, and 457 cm−1 for the 300 °C annealed sample and to 1095, 797, and 465 cm−1 for the 500 °C annealed sample. This shift reflects an increased rigidity of the Si–O–Si network during the condensation process, and the increased intensity is due to the intensified structural disorder of SiO2 thin film by raising temperature.Reference Yamane and Klein30–Reference Lan, Gnappi and Montenero32 However, the FWHM of the peak narrows when the annealing temperature increases from 300 to 500 °C, which may be due to the densification of the film as the stretching of Si–O–Si bond at 500 °C is less than that one at 300 °C. The decreased intensity of the Si–OC2H5 with increasing temperature from 0 to 500 °C may be attributed to the partial decomposition of Si–OC2H5 into Si–OH. The band intensity of 1639 cm−1 owing to the bending of the absorbed water molecules decreases with increasing temperature because of the removal of water. The disappearance of O–N–O band after annealing above 300 °C reveals the formation of the nitrogen oxide gases in acidic SiO2 sol.Reference Karmakar, De and Ganguli21 The dehydration of the hydrophilic silica xerogel structure by annealing induces the absence of the band at 1749 cm−1.
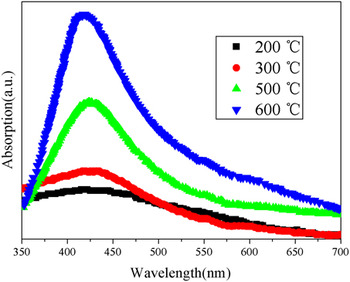
Figure 5 shows the optical absorption spectra of Ag/SiO2 thin film, which were annealed at different temperatures. All the samples exhibit an obviously enhanced optical absorption property at 420 nm due to the SPR effect of Ag nanoparticles (NPs) except for the sample annealed at 200 °C, which reveals that Ag particles were formed above 200 °C. This fact is also in well agreement with the results of DTA curve (Fig. 1) and XRD pattern (Fig. 2). The samples annealed at 300 °C showed a broader absorption peak with a low intensity while exhibited an intensified absorption peak with a narrowed bandwidth along with a blueshift trend as the annealing temperature was increased to 500 and 600 °C. For further understanding the behavior of the optical absorption, the energy band gap (E g) was estimated by the method of Zhao et al.Reference Zhao, Zhang and Shang33 (Fig. 6). The dependence of  $({\rm{\alpha }}h\upsilon )^2$ in Fig. 6 as a function of photon energy hv indicates that all samples are the directly allowed nature of band-to-band transitions. The E g in the plot of
 $({\rm{\alpha }}h\upsilon )^2$ and hv is 1.80, 2.05, and 2.23 eV for the Ag/SiO2 nanocomposite films annealed at 300, 500, and 600 °C, respectively. The E gis gradually widened with increasing the annealing temperature as a result of blueshift of the SPR peaks, which is in agreement with the optical absorption spectra survey mentioned above.
Optical absorption spectra for the Ag/SiO2thin films annealed at different annealing temperatures. (color online)

Relationship between  $({\rm{\alpha }}h\upsilon )^2$ and hv for Ag/SiO2thin film. (color online)

IV. DISCUSSION
The Ag NPs in the SiO2 film not only affect the optical properties (Fig. 5) of the Ag/SiO2 thin films but also change the xerogel structure (Figs. 1 and 4). In the pure SiO2 xerogel, the condensation reaction (2) of silicate groups usually occurs initially at room temperature and accelerated with increasing temperature from room temperature to 177.8 °C.Reference Piękoś, Wesołowski and Teodorczyk34 When AgNO3 was added in the sol, the vibrational absorption peak of the Si–O–Ag bond appears at 827 cm−1 in the as-prepared Ag/SiO2 film as shown in Fig. 4(b). This result indicates that except for the reaction (2), the reaction (3) for the formation of (C2H5O)3Si–O–Ag compound as indicated in the following should occur at room temperatureReference Allen and Matijevic35:
 $$({\rm{C}}_2 {\rm{H}}_5 {\rm{O}})_3 {\rm{Si}}-{\rm{O}}-{\rm{H}} + {\rm{Ag}}^ + = {\rm{ }}({\rm{C}}_2 {\rm{H}}_5 {\rm{O}})_3 {\rm{Si}}-{\rm{O}}-{\rm{Ag}} + {\rm{H}}^ + \quad.$$
As the reaction (3) processes, the number of Si–OH band (956 cm−1) taken in reaction (2) should decrease, resulting in all the Si–O–Si bands weaken at about 1076–1095, 793–797, and 438–465 cm−1 of the as-prepared Ag/SiO2 film. However, the peak at 827 cm−1 of Si–O–Ag band disappears after annealing at 300 and 500 °C as shown in Figs. 4(b)–4(d), indicating that the Si–O–Ag bonds can decompose completely at 300 °C, while AgNO3 usually decomposes over 440 °C. Hence, the appeared exothermal peak in the Ag/SiO2 powder at 203 °C in Fig. 1 can be attributed to the decomposition of Si–O–Ag into the metal Ag particles. Furthermore, XRD analyses in Fig. 2 and the optical absorption spectrum also confirm that Ag particles were formed below 300 °C. On the one hand, when the Ag/SiO2 film was annealed at 300 and 500 °C, the peaks at 945 and 571 cm−1 of Si–OH bands disappear in Figs. 4(c) and 4(d), suggesting the end of the reactions (3) and (2). As a result, the Si–O–Si bands at about 1076–1095, 793–797, and 438–465 cm−1(Fig. 4) intensify with increasing temperature. On the other hand, when the annealing was carried out on the Ag/SiO2 film below 200 °C, no essential absorption in the visible region of spectrum was observed given by the absence of the metal Ag particles because (C2H5O)3Si–O–Ag compound begins to decompose at about 203 °C (Fig. 1). A relatively weaker absorption peak appears in the sample annealed at 300 °C due to the incomplete decompose of (C2H5O)3Si–O–Ag compound (Fig. 5).
V. CONCLUSIONS
Ag/SiO2 nanocomposite films were prepared by a sol–gel method. The FTIR transmission spectra and DTA–TG curve exhibited that the Si–O–Ag bonds formed at room temperature by the interaction between (OC2H5)3Si–OH and AgNO3 and then decomposed into Ag particle at above 200 °C. XRD results and TEM micrograph confirmed that the spherical Ag particles with 10–20 nm in diameter were dispersed in the Ag/SiO2 nanofilms after annealing at 300 °C and above 300 °C. The enhanced optical absorption property with increasing the annealing temperature over 200 °C is due to the formation and the growth of the Ag particles, whereas the high dispersion of Ag particles results in the blueshift of the SPR peaks and E gwith increasing the annealing temperature.
ACKNOWLEDGMENTS
The authors thank Mr. Xi-Zhen Ding (graduate student of USTB) for a part of his experiments. This work was supported by Major State Basic Research Development (Grant No. 2007CB613301), the National Natural Science Foundation of China (Grant No. 50972012), and Specialized Research Fund for the Doctoral Program of Higher Education (Grant No. 20090006110010).