





1. Introduction
Single-bubble dynamics has been intensively investigated theoretically, experimentally and numerically during the past century (Rayleigh Reference Rayleigh1917; Plesset & Prosperetti Reference Plesset and Prosperetti1977; Blake & Gibson Reference Blake and Gibson1987; Leighton Reference Leighton1994; Brennen Reference Brennen1995; Feng & Leal Reference Feng and Leal1997; Lauterborn et al.
Reference Lauterborn, Kurz, Mettin and Ohl1999). Of particular interest have been, and still are, spherical bubbles, as their collapse results in a highly localized energy concentration (Gaitan et al.
Reference Gaitan, Crum, Church and Roy1992; Putterman & Weninger Reference Putterman and Weninger2000; Akhatov et al.
Reference Akhatov, Lindau, Topolnikov, Mettin, Vakhitova and Lauterborn2001; Brenner, Hilgenfeldt & Lohse Reference Brenner, Hilgenfeldt and Lohse2002; Suslick & Flannigan Reference Suslick and Flannigan2008; Lauterborn & Kurz Reference Lauterborn and Kurz2010; Schanz et al.
Reference Schanz, Metten, Kurz and Lauterborn2012). However, spherical-bubble collapse requires isotropic bubble surroundings and inherent stability conditions to be fulfilled with respect to spherical shape (parametric and Rayleigh–Taylor instability) (Plesset Reference Plesset1954; Strube Reference Strube1971; Hilgenfeldt, Lohse & Brenner Reference Hilgenfeldt, Lohse and Brenner1996; Ohl, Lindau & Lauterborn Reference Ohl, Lindau and Lauterborn1998; Lauterborn et al.
Reference Lauterborn, Kurz, Mettin and Ohl1999; Ohl et al.
Reference Ohl, Kurz, Geisler, Lindau and Lauterborn1999; Lin, Storey & Szeri Reference Lin, Storey and Szeri2002; Koch et al.
Reference Koch, Kurz, Parlitz and Lauterborn2011). The interaction of a bubble with its environment generically establishes an asymmetry that, for strong interaction, leads to jet formation, whereby the bubble pierces itself with a high-speed liquid jet. In the case of a bubble collapsing in a stationary liquid near a solid boundary, the jet is directed towards the boundary and reaches velocities of the order of
 $100~\text{m}~\text{s}^{-1}$
(Benjamin & Ellis Reference Benjamin and Ellis1966; Plesset & Chapman Reference Plesset and Chapman1971; Lauterborn & Bolle Reference Lauterborn and Bolle1975; Blake, Taib & Doherty Reference Blake, Taib and Doherty1986; Tomita & Shima Reference Tomita and Shima1986; Blake & Gibson Reference Blake and Gibson1987; Vogel, Lauterborn & Timm Reference Vogel, Lauterborn and Timm1989; Zhang, Duncan & Chahine Reference Zhang, Duncan and Chahine1993; Shaw et al.
Reference Shaw, Jin, Schiffers and Emmony1996; Tong et al.
Reference Tong, Schiffers, Shaw, Blake and Emmony1999; Brujan et al.
Reference Brujan, Keen, Vogel and Blake2002; Popinet & Zaleski Reference Popinet and Zaleski2002; Lindau & Lauterborn Reference Lindau and Lauterborn2003; Johnsen & Colonius Reference Johnsen and Colonius2009; Ochiai et al.
Reference Ochiai, Iga, Nohmi and Ikohagi2011). Jet formation is also observed with bubbles compressed by a shock wave (Bowden Reference Bowden1966; Dear, Field & Walton Reference Dear, Field and Walton1988; Bourne & Field Reference Bourne and Field1992, Reference Bourne and Field1999; Antkowiak et al.
Reference Antkowiak, Bremond, Le Dizès and Villermaux2007; Hawker & Ventikos Reference Hawker and Ventikos2012). Depending on the strength of the incident shock wave, jet velocities of the order of
 $1000~\text{m}~\text{s}^{-1}$
are reported.
Jetting, furthermore, leads to fluid transport and to a local concentration of energy away from the site of bubble inception. The physical action of liquid jets is frequently discussed with respect to surface damage and erosion (Benjamin & Ellis Reference Benjamin and Ellis1966; Tomita & Shima Reference Tomita and Shima1986; Isselin, Alloncle & Autric Reference Isselin, Alloncle and Autric1998; Philipp & Lauterborn Reference Philipp and Lauterborn1998), but a beneficial effect of jetting can also be reached if sufficient control over the effect is established. In particular, directed fluid transport over short distances or micro-manipulation of adjacent objects are attractive perspectives. While solid, free, elastic or composite interfaces and bubble manipulation with acoustic or shock waves might be considered as a means of control of individual jetting bubbles (Chahine Reference Chahine1977; Blake & Gibson Reference Blake and Gibson1981; Gibson & Blake Reference Gibson and Blake1982; Blake et al. Reference Blake, Taib and Doherty1986; Blake, Taib & Doherty Reference Blake, Taib and Doherty1987; Shima et al. Reference Shima, Tomita, Gibson and Blake1989; Brujan et al. Reference Brujan, Nahen, Schmidt and Vogel2001a ,Reference Brujan, Nahen, Schmidt and Vogel b ; Robinson et al. Reference Robinson, Blake, Kodama, Shima and Tomita2001; Tomita et al. Reference Tomita, Robinson, Tong and Blake2002; Wolfrum et al. Reference Wolfrum, Mettin, Kurz and Lauterborn2002, Reference Wolfrum, Kurz, Mettin and Lauterborn2003; Ohl et al. Reference Ohl, Arora, Ikink, de Jong, Versluis, Delius and Lohse2006; Wang & Blake Reference Wang and Blake2010, Reference Wang and Blake2011), their use can be problematic owing to the introduction of additional constraints and the need for proper placement. Generation of a single asymmetric bubble (Lim et al. Reference Lim, Quinto-Su, Klaseboer, Khoo, Venugopalan and Ohl2010) or of a bubble pair (Lauterborn Reference Lauterborn1974; Lauterborn & Vogel Reference Lauterborn and Vogel1984; Lauterborn & Hentschel Reference Lauterborn and Hentschel1985; Testud-Giovanneschi, Alloncle & Dufresne Reference Testud-Giovanneschi, Alloncle and Dufresne1990; Tomita, Shima & Sato Reference Tomita, Shima and Sato1990; Blake et al. Reference Blake, Robinson, Shima and Tomita1993; Jungnickel & Vogel Reference Jungnickel, Vogel, Blake, Boulton-Stone and Thomas1994; Tomita, Sato & Shima Reference Tomita, Sato, Shima, Blake, Boulton-Stone and Thomas1994; Fong et al. Reference Fong, Adhikari, Klaseboer and Khoo2009; Sankin, Yuan & Zhong Reference Sankin, Yuan and Zhong2010) with predetermined jetting behaviour by means of optical breakdown in the bulk of transparent liquids appear as a less invasive and more versatile tool for control and optimization of jet properties.
While single asymmetric bubbles with well-defined shape are difficult to produce, it is fairly easy to generate two initially spherical bubbles that interact to form jets. A number of researchers have already investigated this interaction experimentally (Tomita et al.
Reference Tomita, Sato, Shima, Blake, Boulton-Stone and Thomas1994; Bremond et al.
Reference Bremond, Arora, Dammer and Lohse2006; Fong et al.
Reference Fong, Adhikari, Klaseboer and Khoo2009; Sankin et al.
Reference Sankin, Yuan and Zhong2010; Chew et al.
Reference Chew, Klaseboer, Ohl and Khoo2011) and numerically (Blake et al.
Reference Blake, Robinson, Shima and Tomita1993; Bremond et al.
Reference Bremond, Arora, Dammer and Lohse2006; Fong et al.
Reference Fong, Adhikari, Klaseboer and Khoo2009; Hsiao et al.
Reference Hsiao, Choi, Singh, Chahine, Hay, Ilinskii, Zabolotskaya, Hamilton, Sankin, Yuan and Zhong2013). The jetting direction is determined by the direction of the axis connecting the bubble centres, and thus can easily be adjusted. For reasons of momentum conservation, always two jets with opposite direction are formed that propagate either towards or away from each other. Parameters governing bubble dynamics and jetting are the size (or energy) of the two bubbles, given by their maximum radii,
 $R_{max1}$
and
 $R_{max2}$
, their initiation distance,
 $d$
, and the time difference,
 ${\rm\Delta}t$
, between the generation of bubbles 1 and 2. These are the main parameters in the bulk of the liquid. When there are boundaries nearby, more parameters enter the problem depending on the type of boundary (free, solid or other) and its geometry.
Through adjusting the bubble parameters, the jetting direction and strength can be controlled, as well as the relative speed of the jets propagating in opposite directions. Assuming that the momentum of the fluid motion is largely contained in the respective jet flows, it is to be expected that the relation
 $m_{jet1}v_{jet1}=m_{jet2}v_{jet2}$
holds because of conservation of momentum, where
 $m_{jeti}$
and
 $v_{jeti}$
denote the mass and velocity of the jet from bubble
 $i$
(
 $i=1,2$
), respectively. This implies the possibility of achieving a combination of a massive and slow jet opposed by a thin and fast jet that could be useful for various applications, for instance micropumping and opto-injection for cell transfection (Dijkink & Ohl Reference Dijkink and Ohl2008; Stevenson et al.
Reference Stevenson, Gunn-Moore, Campbell and Dholakia2010). The use of laser-based methods for introducing genetic materials or other substances into living cells has become a very active area of research, and various techniques for opto-poration of the cell membrane have been developed (Tirlapur & König Reference Tirlapur and König2002; Vogel et al.
Reference Vogel, Noack, Huettmann and Paltauf2005; Baumgart et al.
Reference Baumgart, Bintig, Ngezahayo, Willenbrock, Murua Escobar, Ertmer, Lubatschowski and Heisterkamp2008; Stevenson et al.
Reference Stevenson, Gunn-Moore, Campbell and Dholakia2010; Antkowiak et al.
Reference Antkowiak, Torres-Mapa, Stevenson, Dholakia and Gunn-Moore2013a
,Reference Antkowiak, Torres-Mapa, Witts, Miles, Dholakia and Gunn-Moore
b
; Davis et al.
Reference Davis, Farrar, Nishimura, Jin and Schaffer2013). They usually rely on creating one or several small holes in the cell membrane, and share the drawback that material transport into the cell relies on diffusion, which is a slow process. Mechanical injection via a micro-pipette (Diacumakos Reference Diacumakos1973; Pepperkok et al.
Reference Pepperkok, Zanetti, King, Delia, Ansorge, Philipson and Schneider1988) is an efficient method for injecting a bolus of desired mass into the cell, but it is tedious, time-consuming and bears the risk of contamination. Jetting from laser-produced cavitation bubbles could be a fast and versatile non-contact alternative.
The following question is investigated experimentally and numerically: Which combinations of bubble size, distance and initiation time of laser-induced bubble pairs are best suited for achieving particularly thin and high-speed liquid jets that may be used for micropumping and opto-injection? High-speed photography is used for visualizing bubble pair dynamics and fast jet formation. The experimental results are then used as a benchmark for the validation of numerical calculations using open-source computational fluid dynamics (CFD) software. The numerical calculations portray not only the changes in bubble shape but also the evolution of the pressure distribution and of the magnitude and direction of the fluid flow velocity. These distributions are used to explain the jetting and bubble-wall penetration dynamics. In the last part of the study, the numerical tools are used to create maps of the parameter dependence of the jet speed that are used to identify optimum conditions for opto-injection.
2. Experimental and numerical methods
Parameters governing bubble dynamics and jet formation of bubble pairs are the size of the two bubbles given by their maximum bubble radius,
 $R_{max1}$
and
 $R_{max2}$
, their initiation distance,
 $d$
, and the time difference,
 ${\rm\Delta}t$
, between the generation of bubble 1 and of bubble 2. For normalization, the relative size of the bubbles,
 ${\it\rho}$
, the relative initiation distance,
 ${\it\gamma}$
, and the relative temporal difference of their initiation,
 ${\it\tau}$
, are introduced. Thereby, the four-dimensional parameter space
 $\{(R_{max1},R_{max2},d,{\rm\Delta}t)\}$
of real variables can be reduced to a three-dimensional parameter space
 $\{({\it\rho},{\it\gamma},{\it\tau})\}$
of normalized variables to be defined below and illustrated in figure 1.
Illustration of parameters governing laser-induced bubble pair dynamics. Bubble 1 is produced first, bubble 2 after a delay time
 ${\rm\Delta}t$
. Time
 $T_{exp1}$
is the expansion time of bubble 1 after which it reaches its maximum radius
 $R_{max1}$
.

The relative bubble size,
 ${\it\rho}$
, is defined as
 $$\begin{eqnarray}{\it\rho}=\frac{R_{max2}}{R_{max1}}.\end{eqnarray}$$
In experiments, the maximum bubble radii must be determined beforehand with single spherical bubbles in the bulk of the liquid via the relation of laser pulse energy to the acquired maximum radius, because, in particular, bubble 2, when generated delayed with respect to bubble 1, is deformed during expansion and its maximum radius,
 $R_{max2}$
, cannot be determined during the bubble pair experiment. Thus the radius values are given as they would be if the bubbles were single in the bulk of the liquid and remained spherical.
The measurement of the maximum radii is a tedious task that can be simplified in the following way. In the case of millimetre-sized bubbles (surface tension to be neglected) in low-viscosity liquids (damping to be neglected), it holds that
 $$\begin{eqnarray}{\it\rho}=\frac{R_{max2}}{R_{max1}}=\frac{T_{osc2}}{T_{osc1}},\end{eqnarray}$$
where
 $T_{osc1}$
and
 $T_{osc2}$
are the times from bubble generation to their respective first collapse, again for the case of the bubbles being single in the bulk of the liquid and remaining spherical. These times are important because they can be measured precisely through the shock waves emitted at bubble generation and at bubble collapse (Hentschel & Lauterborn Reference Hentschel and Lauterborn1982), allowing for a precise determination of
 ${\it\rho}$
.
Relation (2.2) implies a proportionality between
 $R_{max}$
and
 $T_{osc}$
. It can be derived from the Rayleigh collapse time,
 $T_{coll}$
(Rayleigh Reference Rayleigh1917), the time from bubble maximum to the next minimum for an empty bubble collapsing in a liquid of density
 ${\it\rho}_{liq}$
under the external pressure
 $p_{stat}$
:
 $$\begin{eqnarray}T_{coll}=0.915R_{max}\sqrt{\frac{{\it\rho}_{liq}}{p_{stat}}}.\end{eqnarray}$$
In the case of water, the water vapour pressure,
 $p_{v}$
, constitutes an often not negligible pressure opposing the outer static pressure,
 $p_{stat}$
. Inclusion of the vapour pressure, considered constant to first approximation (evaporation and condensation considered as fast enough processes), leads to the collapse time
 $$\begin{eqnarray}T_{coll}=0.915R_{max}\sqrt{\frac{{\it\rho}_{liq}}{p_{stat}-p_{v}}}.\end{eqnarray}$$
When there is an appreciable amount of gas in the bubble that is compressed during collapse, the collapse time is altered again and must be determined numerically according to the equation of state (EOS) of the bubble contents. The same is even more true when the surface tension and the viscosity of the liquid are considered. Curves for collapse times as a function of
 $R_{max}$
of bubbles containing a polytropic gas and including surface tension have been calculated by Lauterborn (Reference Lauterborn1968).
Assuming that the time from generation to the first maximum of a spherical bubble, the expansion time
 $T_{exp}$
, matches the time from maximum to its first minimum, the collapse time
 $T_{coll}$
(suggested by symmetry arguments when there is negligible damping), the relation
 $T_{exp}=T_{coll}$
is obtained (Lauterborn Reference Lauterborn1974; Hentschel & Lauterborn Reference Hentschel and Lauterborn1982). In this case, the following relation holds:
 $$\begin{eqnarray}T_{osc}=2T_{coll}=2T_{exp}.\end{eqnarray}$$
Thus, with (2.3) or (2.4),
 $R_{max}\sim T_{osc}$
, leading to relation (2.2) when applied to both bubbles. The approximate validity of relation (2.5) and of the Rayleigh collapse time (2.4) has been shown for millimetre-sized laser-induced bubbles in bulk water (Lauterborn Reference Lauterborn1974). Relation (2.5) together with (2.4) allows for a precise determination of
 $R_{max}$
with just a hydrophone (Hentschel & Lauterborn Reference Hentschel and Lauterborn1982; Vogel et al.
Reference Vogel, Hentschel, Holzfuss and Lauterborn1986; Vogel & Lauterborn Reference Vogel and Lauterborn1988; Venugopalan et al.
Reference Venugopalan, Guerra, Nahen and Vogel2002; Hutson & Ma Reference Hutson and Ma2007), without the need for high-speed photography, through the determination of
 $T_{osc}$
from the shock waves emitted at generation (time
 $t_{g}$
) and at collapse (time
 $t_{c}$
). Alternatively,
 $T_{osc}$
can be determined by detecting the deflection of a probe laser beam (Vogel et al.
Reference Vogel, Linz, Freidank and Paltauf2008). This method works even for very small bubbles, for which acoustic transients cannot be detected. One obtains
 $R_{max}$
via
 $T_{osc}=t_{c}-t_{g}$
and
 $$\begin{eqnarray}R_{max}=\frac{1}{1.83}T_{osc}\sqrt{\frac{p_{stat}-p_{v}}{{\it\rho}_{liq}}}.\end{eqnarray}$$
It must be considered, however, that (2.6) is not correct for bubble sizes below a few micrometres because it neglects surface tension. Surface tension,
 ${\it\sigma}$
, produces a pressure
 $2{\it\sigma}/R$
scaling inversely proportional to the bubble radius,
 $R$
, which adds to the hydrostatic pressure. A correction factor is presented by Vogel et al. (Reference Vogel, Linz, Freidank and Paltauf2008).
The relative initiation bubble distance,
 ${\it\gamma}$
, is defined as
 $$\begin{eqnarray}{\it\gamma}=\frac{d}{R_{max1}+R_{max2}},\end{eqnarray}$$
where
 $d$
is the initiation distance (laser-induced breakdown distance) between the two bubbles. A relative (normalized) distance has first been introduced in calculations of single-bubble collapse in front of a solid boundary in the form of
 ${\it\gamma}=d/R_{max}$
, where
 $d$
is the distance of the bubble centre to the solid wall and
 $R_{max}$
is the maximum radius attained if the bubble were to stay spherical throughout its expansion (Plesset & Chapman Reference Plesset and Chapman1971). This definition has been chosen because the dynamics has been found to be the same for the same
 ${\it\gamma}$
in the cases investigated (empty bubbles and surface tension neglected). Because the case of two equal-sized bubbles generated simultaneously with centre distance
 $d_{bb}$
is the same as the case of a single bubble in front of a solid wall with a distance
 $d_{bw}=(1/2)d_{bb}$
(except for a boundary layer in the case of a solid wall), the normalization is given relative to the sum of both bubble maximum radii. Then the normalized distance
 ${\it\gamma}$
is the same for the two cases with identical dynamics. This is valid for all
 ${\it\gamma}$
provided the bubbles are of equal size (
 ${\it\rho}=1$
) and are generated simultaneously.
The relative initiation time difference,
 ${\it\tau}$
, is defined as
 $$\begin{eqnarray}{\it\tau}=\frac{{\rm\Delta}t}{T_{exp1}},\end{eqnarray}$$
where
 ${\rm\Delta}t$
is the time difference between the initiation of bubble 2 and of bubble 1, and
 $T_{exp1}$
is the expansion time of bubble 1, i.e. the time from bubble generation to the first maximum of bubble 1 were it to stay spherical. In view of (2.5) and definition (2.8), one can write
 $$\begin{eqnarray}{\it\tau}=\frac{{\rm\Delta}t}{T_{exp1}}=\frac{2{\rm\Delta}t}{T_{osc1}}.\end{eqnarray}$$
Again, this is valid for larger bubbles only, where surface tension and damping by viscosity can be neglected, as valid for millimetre-sized laser-induced bubbles in water, the case considered here first. For bubbles in aqueous media, surface tension and damping by viscosity start to become relevant for bubble sizes below a few tens of micrometres. The case when the second bubble is generated at the maximum of the first, called an anti-phase bubble pair, is given by
 ${\it\tau}=1$
. For this to be true also in cases where
 $T_{coll}>T_{exp}$
, the expansion time of the first bubble,
 $T_{exp1}$
, has been chosen as in definition (2.8). The case when the second bubble is generated simultaneously with the first one, called an in-phase bubble pair, is given by
 ${\it\tau}=0$
. For equal-sized bubbles, additionally
 ${\it\rho}=1$
. The variables
 ${\it\gamma}$
,
 ${\it\rho}$
and
 ${\it\tau}$
define an orthogonal basis of parameters that, in their dimensional form, are directly observable. We favour this approach compared to a parameter space consisting of
 ${\it\gamma}$
,
 ${\it\rho}$
and a phase difference
 ${\rm\Delta}{\it\theta}$
, as used by Chew et al. (Reference Chew, Klaseboer, Ohl and Khoo2011). The phase difference is not an independent parameter but contains both
 ${\it\tau}$
and
 ${\it\rho}$
, which renders the link to experimental conditions difficult.
2.1. Experimental arrangement
The experimental arrangement for investigating the dynamics of laser-induced bubble pairs is depicted in figure 2. The bubbles were generated by Q-switched Nd:YAG lasers emitting pulses of 1064 nm wavelength with 6 ns duration and energies of up to 250 mJ. Laser 1 was a Continuum YG 671-10 system with approximately Gaussian beam profile, and laser 2 was a Spectron SL 404 system with multimode beam profile. Pulse-to-pulse energy fluctuations were less than 10 % for both devices. The laser beams were first expanded by a telescope consisting of a biconcave lens (
 $f=-40~\text{mm}$
) and a Nd:YAG laser achromat (
 $f=200~\text{mm}$
), and then focused into a water cell (
 $50\times 50\times 50~\text{mm}^{3}$
) by a second Nd:YAG laser achromat (
 $f=120~\text{mm}$
). This optical arrangement leads to a large focusing angle (
 $28^{\circ }$
full angle in water), together with a large distance between laser focus and cuvette walls. The large convergence angle of the laser beam allowed the production of compact plasmas and, hence, spherical bubbles. The expanded bubbles had a radius of
 $R_{max}\sim 1$
mm. Owing to the different quality of the transverse beam profile, the conversion rate of laser energy into mechanical energy differs, and pulse energies of 7 mJ and 20 mJ were needed to produce such bubbles with lasers 1 and 2, respectively.
Experimental arrangement for high-speed photography of laser-induced bubble pairs.
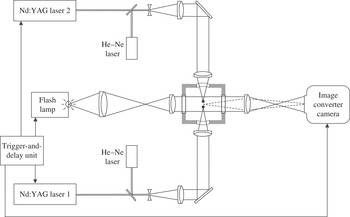
Achromats were used for beam collimation and focusing to minimize spherical aberrations, and, for the same purpose, custom-made curved glass windows were built into the cuvette walls on either side of the cell (Vogel et al.
Reference Vogel, Nahen, Theisen, Birngruber, Thomas and Rockwell1999a
). For zero distance
 $d$
between the two laser foci, their location coincided with the centre of curvature of the windows. During the experiments,
 $d$
was varied between 1.5 and 4.5 mm by moving the laser beams slightly up and down (this movement in the direction perpendicular to the plane of the paper could not be depicted in figure 2, where, for the sake of simplicity, the foci are separated in the direction of the optical axis). Aiming was facilitated by helium–neon laser beams coupled into the beam paths of the Nd:YAG lasers.
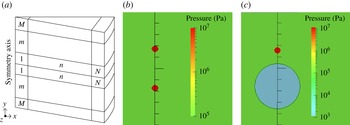
Model geometry and numerical settings for the axisymmetric bubble pair problem with a sketch of the mesh used (a) and two examples of initial pressure conditions for an in-phase bubble pair (b) and an anti-phase bubble pair (c). Here
 $N$
and
 $M$
are the number of steps in the
 $x$
direction and in the positive and negative
 $y$
direction, respectively. Typical values used for both
 $N$
and
 $M$
are 300, giving a total number of volume elements of 180 000. This mesh is rotated about the symmetry axis in small steps (
 $5^{\circ }$
) to give hexahedral wedges. Because of the axial symmetry, there is no flux through the front and back faces of any volume element. Along the symmetry axis, two bubbles are inserted in-phase or anti-phase with conditions that can be read from the diagrams. The static pressure (100 kPa) is always kept at the same colour (light green) for reference, whereas the extrema may change.
The dynamics of the bubble pairs was recorded with a high-speed image converter camera (Hadland Photonics, Imacon 792). In this type of camera, the optical image is converted into a spatial distribution of photoelectrons that are accelerated by a high voltage and imaged electronically on a fluorescent phosphor screen. The object is continuously illuminated, and image separation is achieved by appropriate deflection of the bunch of accelerated electrons. This way, a time-separated sequence of individual optical images is created at the fluorescent screen. The exposure time for each frame always amounts to one-fifth of the inter-framing time. A framing rate of 50 000 frames per second was chosen for taking image series of the bubble motion at twice the original magnification. For illumination, a flash lamp with
 $400~{\rm\mu}\text{s}$
flash duration was used that covered the most relevant part of the two-bubble interaction. The images on the fluorescent screen of the image converter camera were recorded on Kodak T Max 400
 $4\times 5$
inch sheet film with a sensitivity of 400 ASA. They were digitized at 6400 pixels per inch using a photo-scanner (Epson V700), and inverted into positives by means of Adobe Photoshop software. The recorded images show a spatial resolution in object space of
 ${\sim}50~{\rm\mu}\text{m}$
. Spatial resolution is limited by the various image transformation and transmission processes in the Imacon camera.
The arrangement was used to investigate the dynamics of bubble pairs with equal-sized bubbles; actual slight variations in relative size around
 ${\it\rho}=1$
were not intended but were caused by fluctuations of the laser pulse energies. The relative initiation distance,
 ${\it\gamma}$
, was varied by changing the separation,
 $d$
, between the laser foci. Attention was focused on bubbles produced at the same time (
 ${\it\tau}=0$
, in-phase bubble pair), and on bubbles produced subsequently, the second bubble being initiated at the maximum radius of the first one (
 ${\it\tau}=1$
, anti-phase bubble pair). Appropriate timing for bubble generation and recording of the image series was controlled electronically by a trigger-and-delay unit.
2.2. Numerical methods
OpenFOAM (Open Field Operation And Manipulation) has been selected to perform the numerical calculations for gaining more insight into bubble pair dynamics. OpenFOAM is an open-source CFD software programmed in C
 $++$
based on the finite volume method. The volume-of-fluid (VOF) method is used for capturing and locating the gas–liquid interface. It is a robust method for following evolving, topologically complex interfaces (Fuster et al.
Reference Fuster, Agbaglah, Josserand, Popinet and Zaleski2009) as encountered with interacting bubbles. Because the bubble interaction geometry is axisymmetric, hexahedral wedges are used. The model geometry and numerical settings are shown in figure 3 together with two examples of initial conditions. The domain of calculation is selected to be sufficiently large to avoid back-reactions from the numerical boundaries. The ideal-gas EOS is used to simulate the bubble content. Surface tension and compressibility as well as viscosity for both gas and liquid are included, whereas condensation, evaporation and heat conduction are neglected in the model. An artificial liquid with the properties of water, except for the sound velocity, is chosen. The reason is that upon laser bubble formation a strong shock wave is radiated that presents problems in being properly captured by the numerical code (see the efforts that Hawker & Ventikos (Reference Hawker and Ventikos2012) have undertaken to solve the problem of the interaction of a shock wave with a bubble). Therefore, linear acoustics and a reduced sound speed are used for the liquid, for definiteness that of the gas. This approach can be considered a better approximation than the so far mostly used incompressibility assumption for the liquid.
The fluids used are a liquid and a gas with the following parameters: density,
 ${\it\rho}_{liquid}=1000~\text{kg}~\text{m}^{-3}$
and
 ${\it\rho}_{gas}=1~\text{kg}~\text{m}^{-3}$
; sound velocity,
 $c_{liquid}=316~\text{m}~\text{s}^{-1}$
(reduced as stated above) and
 $c_{gas}=316~\text{m}~\text{s}^{-1}$
; surface tension between the two fluids,
 ${\it\sigma}=0.07~\text{N}~\text{m}^{-1}$
; and kinematic viscosity of the liquid,
 ${\it\nu}_{liquid}=10^{-6}~\text{m}^{2}~\text{s}^{-1}$
, and of the gas,
 ${\it\nu}_{gas}=1.589\times 10^{-5}~\text{m}^{2}~\text{s}^{-1}$
. The initial conditions vary for in-phase and anti-phase bubble pairs. The millimetre-sized in-phase bubbles for comparison with the experiments are initiated by starting with bubbles of radius 0.13 mm with interior pressure of 100 bar and
 $0~\text{m}~\text{s}^{-1}$
bubble-wall velocity expanding into water of static pressure 1 bar. The maximum bubble radius reached then is 1.04 mm (similar to the experimental radius) if the bubbles of the pair were to stay spherical. This situation is depicted in figure 3(b). In the case of millimetre-sized anti-phase bubble pairs, bubble 1 starts with a radius of 1 mm, internal pressure 0.01 bar and
 $0~\text{m}~\text{s}^{-1}$
bubble-wall velocity, and bubble 2 starts as do the millimetre-sized in-phase bubbles, i.e. radius 0.13 mm with interior pressure of 100 bar and
 $0~\text{m}~\text{s}^{-1}$
bubble-wall velocity. This situation is depicted in figure 3(c).
The subsequent evolution of bubble shape and of the distribution of velocity and pressure in the two-phase fluid is then calculated for in-phase and anti-phase equal-sized bubble pairs with different relative distances in bulk water, i.e.
 $\{({\it\rho}=1,{\it\gamma}~\text{varied},~{\it\tau}=0)\}$
and
 $\{({\it\rho}=1,~{\it\gamma}~\text{varied},~{\it\tau}=1)\}$
, respectively, for comparison with the experiments. Afterwards, the calculations are extended to micrometre-sized bubble pairs.
Growth and collapse of in-phase bubble pairs (
 ${\it\tau}=0$
) with bubbles of approximately equal size (
 ${\it\rho}=1$
) in each pair for two different relative bubble distances
 ${\it\gamma}$
. The bubble distance
 $d$
at initiation is (a)
 $d=4.5~\text{mm}$
(
 $R_{max}=0.9~\text{mm}$
,
 ${\it\gamma}=2.5$
) and (b)
 $d=2~\text{mm}$
(
 $R_{max}=1.15~\text{mm}$
,
 ${\it\gamma}=0.87$
). The frame interval is
 $40~{\rm\mu}\text{s}$
between the first seven frames depicting the expansion phase and the start of the collapse phase, and
 $20~{\rm\mu}\text{s}$
afterwards for the final collapse and rebound.

3. Experimental results
Figure 4 shows high-speed photographic records of the dynamics of two in-phase bubble pairs, one with large distance and one with small distance between the two bubbles, and figures 5–9 show anti-phase bubble pair dynamics at different values of the relative initiation distance
 ${\it\gamma}$
.
3.1. In-phase bubble pairs
For in-phase bubble pairs (figure 4), jetting occurs towards the plane of symmetry between the two bubbles. The dynamics of each individual bubble resembles that of a single bubble adjacent to a solid boundary, and the variation of jetting with
 ${\it\gamma}$
is also very similar to the behaviour near a solid boundary. There should be an equivalence except for the boundary layer at a real solid surface that is absent in the case of two bubbles in the bulk of the liquid. It is also seen that the two bubbles approach each other, again as in the case of a bubble near a solid boundary. With decreasing
 ${\it\gamma}$
, jetting becomes more pronounced and involves a larger liquid mass. Interestingly, for
 ${\it\gamma}<1$
, the bubbles do not merge but a thin liquid film remains between them (figure 4
b).
3.2. Anti-phase bubble pairs
The behaviour of anti-phase bubble pairs is very different (see figures 5–9) from the in-phase bubble pairs. Jetting occurs again in opposite directions but the two jets are now directed away from each other. The expansion of bubble 2 accelerates the collapse of bubble 1 and induces a jet penetrating bubble 1 in outside direction. The collapse of bubble 1, in turn, pulls on the wall of bubble 2, creating a conical protrusion. After the collapse of bubble 1, the protrusion of bubble 2 flips back and forms a jet penetrating bubble 2 in outside direction. The jet becomes visible on the bright-field images because it is surrounded by a gaseous protrusion of the cavity, which is formed by jet impact. The general features of the bubble dynamics remain the same regardless of
 ${\it\gamma}$
(in the range considered and when the bubbles do not merge), but the details vary strongly with the actual bubble distance.
Dynamics of an anti-phase bubble pair (
 ${\it\tau}=1$
) with bubbles of approximately equal size (
 ${\it\rho}=1$
). The bubble distance
 $d$
at initiation is
 $d=3.0~\text{mm}$
;
 $R_{max}=1.0~\text{mm}$
,
 ${\it\gamma}=1.5$
. The frame interval is
 $20~{\rm\mu}\text{s}$
.

Dynamics of an anti-phase bubble pair (
 ${\it\tau}=1$
) with bubbles of approximately equal size (
 ${\it\rho}=1$
). The bubble distance
 $d$
at initiation is
 $d=2.5~\text{mm}$
;
 $R_{max}=1.0~\text{mm}$
,
 ${\it\gamma}=1.25$
. The frame interval is
 $20~{\rm\mu}\text{s}$
.

Dynamics of an anti-phase bubble pair (
 ${\it\tau}=1$
) with bubbles of approximately equal size (
 ${\it\rho}=1$
). The bubble distance
 $d$
at initiation is
 $d=2~\text{mm}$
;
 $R_{max}=1.0~\text{mm}$
,
 ${\it\gamma}=1.0$
. The frame interval is
 $20~{\rm\mu}\text{s}$
.

Dynamics of an anti-phase bubble pair (
 ${\it\tau}=1$
) with bubbles of approximately equal size (
 ${\it\rho}=1$
). The bubble distance
 $d$
at initiation is
 $d=1.5~\text{mm}$
;
 $R_{max}=1.0~\text{mm}$
,
 ${\it\gamma}=0.75$
. The frame interval is
 $20~{\rm\mu}\text{s}$
.

Dynamics of an anti-phase bubble pair (
 ${\it\tau}=1$
) with bubbles of approximately equal size (
 ${\it\rho}=1$
). The bubble distance
 $d$
at initiation is
 $d=3~\text{mm}$
;
 $R_{max}=2.1~\text{mm}$
,
 ${\it\gamma}=0.715$
. The frame interval is
 $50~{\rm\mu}\text{s}$
. Taken from Lauterborn & Hentschel (Reference Lauterborn and Hentschel1985).

With decreasing
 ${\it\gamma}$
, the involution of the upper wall of bubble 1 occurs earlier during the collapse phase, and the jet becomes broader and contains more mass. While in figure 5 (
 ${\it\gamma}=1.5$
) the jet flow through bubble 1 remains relatively concentrated after the jet has penetrated the bubble, it rapidly evolves into a ring vortex in figure 8 (
 ${\it\gamma}=0.75$
). With regard to bubble 2, decreasing
 ${\it\gamma}$
results in an ever stronger elongation of the conical protrusion and thus a stronger jet in the upward direction. While in figure 5, the jet becomes visible only after the collapse of bubble 2, it shows up in the middle of the collapse phase in figure 6, and already at the beginning of the collapse phase in figures 7 and 8. In the latter case, the jet flow rushes through the expanded, empty bubble and enters far into the liquid beyond the opposite bubble wall. It can be deduced from figure 8 that, under optimum conditions, the penetration depth amounts to at least three times the maximum radius of bubble 2; the exact value is not known because the jet tip is outside the frame boundaries.
When the bubbles are too close, part of bubble 2 is pulled out too strongly by the collapsing bubble 1, and the protrusion enters the ring vortex formed upon collapse of bubble 1, such as in figure 9. This way, both the formation of the conical tip of bubble 2 and of the jet tip belonging to bubble 1 are disturbed. The protrusion is intruded into the jet that now occupies a ring shape and splashes through the bottom of bubble 1. The irregular shape of the protrusion of bubble 2 results in irregularities also during jet formation. The jet penetrating bubble 2 is now slower and broader than in figure 8.
4. Numerical results
Simulations for in-phase (
 ${\it\tau}=0$
) equal-sized (
 ${\it\rho}=1$
) bubble pairs with different relative initiation distances
 ${\it\gamma}$
(corresponding to the experimental results of figure 4) are shown in figures 10 and 11. The numerical results for anti-phase (
 ${\it\tau}=1$
) equal-sized (
 ${\it\rho}=1$
) bubble pairs with different relative initial distances
 ${\it\gamma}$
(corresponding to the experimental results of figures 5–9) are presented in figures 12–16. Besides the evolution of the bubble shapes, the simulations show the evolution of the pressure and velocity distributions that will help to explain the dynamics of bubble interaction. The velocity vectors give the direction of the flow field at their base, while the magnitude is given by the colour at that point.
Dynamics of an in-phase bubble pair. Simulation parameters are
 $R_{max1,2}=1.04~\text{mm}$
,
 ${\it\gamma}=2.5$
,
 ${\it\tau}=0$
and
 $T_{coll}\,(\text{spherical bubble})=110~{\rm\mu}\text{s}$
. (a) Bubble shapes; and (b–e) selected frames from the simulation with pressure and velocity fields from the first collapse and rebound. Pressure fields (Pa) (note the colour of
 $1~\text{bar}=10^{5}~\text{Pa}$
for reference) and flow velocity fields (coloured by velocity magnitude (
 $\text{m}~\text{s}^{-1}$
)) are presented with velocity direction vectors (the arrows) in the right half-space of the simulated area. Each tick of the vertical scale represents 0.5 mm. To be compared with experimental results from figure 4 with the same
 ${\it\gamma}=2.5$
. The numerical peak velocity of the jet tip is reached at about
 $230~{\rm\mu}\text{s}$
and amounts to about
 $25~\text{m}~\text{s}^{-1}$
.

Dynamics of an in-phase bubble pair. Simulation parameters are
 $R_{max1,2}=1.04~\text{mm}$
,
 ${\it\gamma}=0.87$
and
 ${\it\tau}=0$
. (a) Bubble shapes; and (b–e) selected frames from the simulation with pressure and velocity fields from the first collapse and rebound. To be compared with experimental results from figure 4 with the same
 ${\it\gamma}=0.87$
. The numerical peak velocity of the jet tip is reached at about
 $220~{\rm\mu}\text{s}$
and amounts to about
 $70~\text{m}~\text{s}^{-1}$
. For further explanations concerning the pressure and velocity fields, see figure 10.

Two two-parameter maps of the dependence of the direction and averaged jet velocity of bubble 2 are calculated to assist parameter selection in practical applications. One map presents the dependence on the relative initiation time,
 ${\it\tau}$
, and on the relative distance,
 ${\it\gamma}$
, of millimetre-sized and micrometre-sized bubble pairs of equal size (
 ${\it\rho}=1$
), and the other map displays the dependence on the relative size,
 ${\it\rho}$
, and on
 ${\it\gamma}$
of micrometre-sized anti-phase bubble pairs (
 ${\it\tau}=1$
).
4.1. In-phase bubble pairs
The dynamics of an in-phase bubble pair is depicted in figure 10 for
 ${\it\gamma}=2.5$
and in figure 11 for
 ${\it\gamma}=0.87$
, both for
 ${\it\rho}=1$
. The evolution of bubble shape (figures 10
a and 11
a) is given together with selected frames of the pressure and velocity distribution both in the liquid and inside the bubble (figures 10
b–e and 11
b–e). The bubble shape sequences reproduce the experimental finding (figure 4) that during collapse and rebound each bubble develops a liquid jet towards the other bubble. However, in the numerical simulation of figure 10 the jet just reaches the opposite bubble wall, whereas in the experiment the jet produces a noticeable protrusion. As jet formation is very sensitive to initial and boundary conditions, and these are not precisely known for the experiment (the conditions in the bubble after laser-induced breakdown are not known exactly and the bubbles are of slightly different size), the agreement between experimental and numerical results seems reasonable. Similarly, when the bubble shapes of figure 11 are compared with the respective experimental ones of figure 4, the different bubble sizes will lead to jet formation at slightly different times and with different strength, so that a complete match cannot be expected. The main features, however, are well modelled in figure 11, for instance the squeezing of the two bubbles when the expanding walls approach each other. The hitting of the two approaching jets with a flat disk-like radial jet of outflowing liquid is visible only in the simulations, but can be guessed also from the experiments. For comparison with the experiment it has to be noticed that the bubble shapes in figures 10 and 11 are cuts through the bubbles along the vertical axis of rotational symmetry. The shapes have to be rotated around this axis, yielding torus-like bubbles after collapse that in the experiments are looked at in side view.
Besides the bubble shapes, the simulations also supply the evolution of the pressure and the velocity fields in the bubble and in the liquid. Just a few frames are shown in figures 10 and 11 for selected times. Figure 10(b,c) shows the pressure and velocity fields shortly before and shortly after collapse. The pressure field is shown in the left half of each panel, the velocity field in the right half of each panel, with the velocity magnitude given by the (varying) background colour and the direction given by the arrows (all of equal length). As expected, shortly before collapse the bubbles of figure 10 (bubbles far away from each other) are surrounded by a high-pressure region, the pressure inside the bubble being lower. Whereas the pressure inside the bubbles remains homogeneous, the velocity of the gas already shows signs of jet formation. The flow field in the liquid is symmetric with respect to the plane of symmetry between the two bubbles and finally directed towards the bubbles with a stagnation point on the vertical axis of rotational symmetry in the middle between the two bubbles. Shortly after collapse (figure 10
c) the pressure field is similar to that before collapse. The velocity field, however, must change from inflow to outflow. In the frame chosen the switching has just started, so that only the part of the liquid near the bubble is flowing away from the bubble, while the main body of the liquid is still inflowing. In the later stages of expansion (figure 10
d,e) the outflow region has expanded throughout the frame region. The jet develops further during rebound of the bubble with the highest velocity at the tip, where it is smaller in diameter. In figure 10(d) the jet tip has a velocity of
 $16.7~\text{m}~\text{s}^{-1}$
, the peak velocity reached for the given parameter set being about
 $25~\text{m}~\text{s}^{-1}$
. In figure 10(e) the pressure has fallen to a low value inside the bubble and the jet has come to about a stop as the high velocity of the jet tip has ceased.
For the case of
 ${\it\gamma}=0.87$
(figure 11) the pressure and velocity fields before and after bubble collapse are shown. They are easily discernible by the inflow and outflow velocity fields of the liquid (figure 11
b–e). In figure 11(b) the two bubbles are still expanded, but the pressure field in the liquid is quite inhomogeneous, showing two regions of higher pressure on the vertical symmetry axis immediately above the upper bubble and below the lower bubble. This is the reason for the liquid jets being initiated. The jets are already noticeable in the gas flow field inside the bubble. In figure 11(c) before collapse, the two liquid jets are flowing inwards with high velocity (about
 $45~\text{m}~\text{s}^{-1}$
) and have created a region of high pressure (about 20 bar) in the liquid around the meeting point (stagnation point). Thereby, two torus bubbles are formed. Shortly after collapse (as seen by the outflow of the liquid from the bubble region) each bubble develops a (radial) splash and the liquid between the two torus bubbles is squeezed out at high speed in the form of a flat disk, the liquid being supplied by the inflowing jets (figure 11
d). This situation prevails during much of the rebound time, as can be seen from figure 11( e), and the bubble shapes at later times.
4.2. Anti-phase bubble pairs
The larger the relative distance between two bubbles, the less intense is the interaction between them. This is also valid for anti-phase bubble pairs, where the two jets are directed away from the other bubble. In the case of
 ${\it\gamma}=1.5$
, the largest
 ${\it\gamma}$
value considered here (figure 12), each liquid jet just reaches the opposite bubble wall. The apparent penetration of the opposite bubble wall is considered an artifact, as the thin gas bridge between jet tip and bubble wall cannot be resolved by the VOF method (used for interface capturing) unless the mesh is strongly refined. The jets are more pronounced in the corresponding experiment (figure 5) than in the simulation but the main jetting features are reproduced, with the thin jet of bubble 1 reaching a higher velocity than the broad jet of bubble 2. Upon second collapse of bubble 1, the upper bubble part around the jet base involutes and liquid rushes into the bubble as a ring-like jet inclined towards the axis of rotational symmetry. Thereby, the bubble disrupts into two torus bubbles. Upon rebound, a complicated gas structure is formed with a thin dimple sticking upwards out of the main bubble part after
 ${\approx}300~{\rm\mu}\text{s}$
. Even this peculiar gas structure after the second collapse of bubble 1 showing up in the experiment is present in the calculation. The pressure and velocity fields show the expected behaviour. A collapsed bubble is immersed in a high-pressure field with an inflow velocity field that reverses upon rebound. However, as one bubble is collapsing while the other bubble is expanding, a near-field flow from the expanding bubble to the collapsing one is generated.
Dynamics of an anti-phase bubble pair. Simulation parameters are
 $R_{max1}=1~\text{mm}$
,
 $R_{max2}=1.04~\text{mm}$
and
 ${\it\gamma}=1.5$
. (a) Bubble shapes; and (b–e) selected frames from the simulation with pressure and velocity fields. To be compared with experimental results from figure 5 with
 $R_{max1}\approx 1~\text{mm}$
and
 ${\it\gamma}\approx 1.52$
. The numerical peak jet velocities of bubble 1 and bubble 2 are about
 $65~\text{m}~\text{s}^{-1}$
and
 $15~\text{m}~\text{s}^{-1}$
, respectively. For further explanations concerning the pressure and velocity fields, see figure 10.

At
 ${\it\gamma}=1.25$
(figure 13) the jet of bubble 1 gets broader and slower, but otherwise the dynamics resembles that of figure 12. More pronounced changes occur when the relative distance is reduced to
 ${\it\gamma}=1.0$
(figure 14) and the interaction gets stronger. Now, the expanding bubble 2 elongates towards bubble 1, as also seen in the experiments (figure 7). The jet of bubble 1 is very broad, but hardly reaches the opposite bubble wall. Its ‘tip’ looks like a nose and hits the opposite bubble wall along a ring with the inclusion of gas in between. The same type of contact has also been observed by Lindau & Lauterborn (Reference Lindau and Lauterborn2003) for a laser-induced bubble near a solid boundary in the case when the bubble upon expansion just touched the boundary. The pressure field at
 $t=60~{\rm\mu}\text{s}$
reveals a zone of high pressure between the two bubbles from the inflow of liquid, which is considered the main driving force for the two jets in opposite directions. The flow field is mainly directed to bubble 1. At
 $t=80~{\rm\mu}\text{s}$
, shortly after collapse, bubble 1 is still surrounded by a high-pressure field with a compression wave emitted. A jet is forming downwards into bubble 1 and the jet of bubble 2 is just starting. The velocity field exhibits a near-field flow directed from bubble 1 to bubble 2. At
 $160~{\rm\mu}\text{s}$
, both jets are well developed, with a high pressure at the tip of the jet of bubble 2 as the jet has already hit the opposite bubble wall. The velocity field is complicated but the peak velocities are about the same for both jets,
 $30~\text{m}~\text{s}^{-1}$
. At
 $280~{\rm\mu}\text{s}$
, shortly after the second collapse of bubble 1, the jet through bubble 2 has deeply entered the liquid. The velocity field shows an extended near-field flow from bubble 1 to bubble 2 that feeds the jet of bubble 2. This jet becomes visible in the bubble shape plots when the gaseous layer surrounding it is thick enough to be resolved by the resolution of the mesh used in the simulations. It disappears when the layer thickness falls below the resolution limit, and where the jet-induced protrusion collapses such that its wall touches the jet flow. However, even when the gaseous layer disappears, the jet can still be seen in the velocity field via the magnitude of the flow field given in the simulation plots.
Dynamics of an anti-phase bubble pair. Simulation parameters are
 $R_{max1}=1~\text{mm}$
,
 $R_{max2}=1.04~\text{mm}$
and
 ${\it\gamma}=1.25$
. (a) Bubble shapes; and (b–e) selected frames from the simulation with pressure and velocity fields. To be compared with experimental results from figure 6 with
 $R_{max1}\approx 1~\text{mm}$
and
 ${\it\gamma}\approx 1.25$
. The numerical peak jet velocities of bubble 1 and bubble 2 are about
 $35~\text{m}~\text{s}^{-1}$
and
 $16~\text{m}~\text{s}^{-1}$
, respectively.

Dynamics of an anti-phase bubble pair. Simulation parameters are
 $R_{max1}=1~\text{mm}$
,
 $R_{max2}=1.04~\text{mm}$
and
 ${\it\gamma}=1.0$
. (a) Bubble shapes; and (b–e) selected frames from the simulation with pressure and velocity fields. To be compared with experimental results from figure 7 with
 $R_{max1}\approx 1~\text{mm}$
and
 ${\it\gamma}\approx 1.0$
. The numerical peak jet velocities of bubble 1 and bubble 2 are both about
 $30~\text{m}~\text{s}^{-1}$
.

Dynamics of an anti-phase bubble pair. Simulation parameters are
 $R_{max1}=1~\text{mm}$
,
 $R_{max2}=1.04~\text{mm}$
and
 ${\it\gamma}=0.8$
. (a) Bubble shapes; and (b–g) selected frames from the simulation with pressure and velocity fields. To be compared with experimental results from figure 8 with
 $R_{max1,2}\approx 1~\text{mm}$
and
 ${\it\gamma}=0.75$
. The numerical peak jet velocity of bubble 2 is about
 $150~\text{m}~\text{s}^{-1}$
reached at about
 $70~{\rm\mu}\text{s}$
. The average jet velocity of bubble 2 is about
 $80~\text{m}~\text{s}^{-1}$
averaged over
 $30~{\rm\mu}\text{s}$
(from 70 to
 $100~{\rm\mu}\text{s}$
).

Dynamics of an anti-phase bubble pair. Simulation parameters are
 $R_{max1}=2.1~\text{mm}$
,
 $R_{max2}=2.09~\text{mm}$
and
 ${\it\gamma}=0.714$
. Initial conditions for bubble 1: radius 2.1 mm, interior pressure 0.01 bar, wall velocity
 $0~\text{m}~\text{s}^{-1}$
. Initial conditions for bubble 2: radius 0.3 mm, interior pressure 100 bar, wall velocity
 $0~\text{m}~\text{s}^{-1}$
. (a) Bubble shapes; and (b–g) selected frames from the simulation with pressure and velocity fields. To be compared with experimental results from figure 9 with
 $R_{max1}\approx 2.1~\text{mm}$
and
 ${\it\gamma}\approx 0.715$
. The numerical peak jet velocity of bubble 2 is about
 $100~\text{m}~\text{s}^{-1}$
reached at
 $140~{\rm\mu}\text{s}$
. The average jet velocity of bubble 2 is about
 $75~\text{m}~\text{s}^{-1}$
averaged over
 $70~{\rm\mu}\text{s}$
(from 140 to
 $210~{\rm\mu}\text{s}$
).

At a relative distance of
 ${\it\gamma}=0.8$
(figure 15) bubble interaction gets strong and special. Bubble 1 collapses via a bean shape to a torus bubble. Bubble 2 expands with a pronounced elongation deep into bubble 1, thereby attaining the shape of a light bulb. During the expansion of bubble 2 the elongation develops into a constricting neck that already closes upon the start of collapse of bubble 2, leaving its gas remains between the torus of bubble 1. From the constriction region of the neck, a fast jet is formed upwards into the main body of bubble 2. It propagates with a maximum velocity of about
 $150~\text{m}~\text{s}^{-1}$
and deeply penetrates into the liquid behind the opposite bubble wall. Bubble 1 attains an almost quadratic shape after collapse. The whole sequence of events well models the experiment of figure 8 for a similar value of
 ${\it\gamma}=0.75$
. The pressure and velocity fields make the involved bubble dynamics more understandable. At
 $t=50~{\rm\mu}\text{s}$
, the liquid flow into the neck region squeezes the neck to contraction and the neck of bubble 2 is surrounded by a ring of higher pressure. At
 $60~{\rm\mu}\text{s}$
, the collapse of bubble 1 has produced a strongly confined region of high pressure below the elongation of bubble 2, together with a high-pressure ring that appears as two points in the cross-section presentation of the bubbles. These pressures combine to one region of higher pressure at the base of the jet of bubble 2 accelerating the jet upwards by inflow of liquid (
 $80~{\rm\mu}\text{s}$
). High pressures also appear at the tip of the jet of bubble 2, both when it first hits the opposite bubble wall and later upon pushing liquid ahead. From 50 to
 $80~{\rm\mu}\text{s}$
very high velocities are observed in the gas of bubble 2 in front of the emerging jet.
A total entanglement of the bubbles occurs at
 ${\it\gamma}=0.714$
(figure 16) in good agreement with the experiment of figure 9. Now, bubble 2 mixes its elongation part with bubble 1, leaving it shattered into several torus layers. Nevertheless, the neck of bubble 2 closes in a similar fashion as for
 ${\it\gamma}=0.8$
in figure 15 and, therefore, a fast jet shooting through bubble 2 is produced that reaches a velocity of
 ${\approx}100~\text{m}~\text{s}^{-1}$
. The jet, however, has a peculiar shape, with its side lobes of bubble protrusions and a wavy roughness of the surrounding gas tube. The experiment also shows a disturbed jet, even more disturbed because of the different and less controllable symmetry conditions than in the simulations. Pressure and velocity fields are complicated. When bubble 2 penetrates into bubble 1 (
 $50~{\rm\mu}\text{s}$
), its inner gas pressure is higher than in bubble 1. This initiates a flow field of gas through the neck that finally results in a protrusion downwards along the axis (
 $100~{\rm\mu}\text{s}$
). Liquid flowing into the neck region leads to a ring-shaped higher-velocity region in the gas, where bubble 2 and bubble 1 meet, and to a higher-pressure ring in the liquid, both visible at
 $130~{\rm\mu}\text{s}$
. The closing neck together with a high-pressure field between the two bubbles drives a liquid jet up into bubble 2 (
 $150~{\rm\mu}\text{s}$
). The liquid jet is preceded by a fast torus-like gas jet flow that produces a ring-like protrusion sticking out of the upper part of bubble 2 (
 $200~{\rm\mu}\text{s}$
). The liquid jet of bubble 2 gets broader than in the case of
 ${\it\gamma}=0.8$
. A downward jet of bubble 1 is not directly visible, but a flow through bubble 1 is present due to momentum conservation.
The averaged jet velocity of bubble 2 as a function of the relative initiation time,
 ${\it\tau}$
, and the relative distance,
 ${\it\gamma}$
, of micrometre-sized bubble pairs of equal size (
 ${\it\rho}=1$
). Initial conditions are
 $R_{1,2}=1~{\rm\mu}\text{m}$
with an internal pressure of 100 bar and bubble-wall velocity
 $v_{1,2}=0~\text{m}~\text{s}^{-1}$
, giving
 $R_{max1,2}=6.74~{\rm\mu}\text{m}$
at the static pressure in the liquid of 1 bar. The averaged jet velocity of bubble 2 as a function of
 ${\it\gamma}$
for an anti-phase (
 ${\it\tau}=1$
) equal-sized millimetre bubble pair (
 ${\it\rho}=1$
,
 $R_{max1}=1~\text{mm}$
,
 $R_{max2}=1.04~\text{mm}$
) is also given as the inserted bar. The initial conditions in this case are
 $R_{1}=1~\text{mm}$
with an internal pressure of 0.01 bar,
 $R_{2}=0.13~\text{mm}$
with an internal pressure of 100 bar and bubble-wall velocity
 $v_{1,2}=0~\text{m}~\text{s}^{-1}$
. Colour denotes the jetting direction: when the jet of bubble 2 is directed towards bubble 1, the jet velocity is defined as negative (blue range), while it is positive (green–yellow–red range) when the jet of bubble 2 is directed away from bubble 1.

4.3. Maps of jet velocity as a function of parameters
Figure 17 shows the parameter map of the dependence of direction and averaged jet velocity of bubble 2 on the relative initiation time
 ${\it\tau}$
and the relative distance
 ${\it\gamma}$
of micrometre-sized bubble pairs of equal size (
 ${\it\rho}=1$
) with one example series of millimetre-sized bubble pairs for
 ${\it\tau}=1$
. The averaging of the jet velocity is done from the start of the indentation of the bubble to the contact of the jet with the opposite bubble wall. In the cases when the jet does not reach the opposite bubble wall, the stopping time is taken from the inversion of the flow field at the jet tip. When the jet of bubble 2 is directed towards bubble 1, the jet velocity is defined as negative. Twenty-five points (
 ${\it\gamma},{\it\tau}$
) have been selected and interpolated to obtain the diagram. They are mainly taken in the high-velocity regions, as only these are important for opto-injection. Owing to large errors in the lower-velocity regions, the jet velocities there are smoothed interpolations and not to be taken as exact values. When
 ${\it\tau}=0$
(in-phase bubble pair), two symmetric jets moving towards each other are induced. When there is a small difference in the initiation time of the bubbles,
 $0<{\it\tau}<0.4$
, the jet of bubble 2 will still be directed to bubble 1, but with a smaller velocity than at
 ${\it\tau}=0$
. When enlarging the generation time difference between the bubbles,
 $0.4<{\it\tau}<1.2$
, the jet of bubble 2 induced by the presence of bubble 1 will be pointing into bubble 2, away from bubble 1. Here, the jet direction is reversed and the strength of the jet is enhanced with increasing
 ${\it\tau}>0.4$
up to
 ${\it\tau}=1$
. The value
 ${\it\tau}\approx 0.4$
is also the line where bubble attraction (largest for
 ${\it\tau}=0$
) changes to repulsion (largest for
 ${\it\tau}=1$
). In the case of a millimetre-sized bubble pair, the highest jet velocity of the bubble pair with
 ${\it\rho}=1$
and
 ${\it\tau}=1$
occurs with bubble 2, when
 ${\it\gamma}\approx 0.8$
(see the horizontal bar in the figure). This agrees with the experimental results reported in figures 5–9. For a micrometre-sized bubble pair, on the other hand, the highest jet velocity is found for
 ${\it\gamma}\approx 0.7$
. This indicates that the change of the effects due to the liquid parameters, i.e. surface tension and viscosity, on the bubble dynamics is not negligible when the maximum bubble radius reduces from millimetre-sized to micrometre-sized. While for large cavities jet formation is insensitive to liquid surface tension (Antkowiak et al.
Reference Antkowiak, Bremond, Le Dizès and Villermaux2007), surface tension leads to a larger pressure inside micrometre-sized bubbles and tends to counteract the formation of strongly curved convex surfaces, such as the tip of a jet. As a result, the highest jet velocity is now predicted for a slightly smaller
 ${\it\gamma}$
value, i.e. for a stronger interaction between the neighbouring bubbles.
The averaged jet velocity of bubble 2 as a function of the relative bubble size,
 ${\it\rho}$
, and the relative distance,
 ${\it\gamma}$
, of micrometre-sized anti-phase bubble pairs (
 ${\it\tau}=1$
). Initial conditions are
 $R_{max1}=8~{\rm\mu}\text{m}$
with an inside gas pressure of 0.01 bar,
 $R_{2}$
varied from 4.47 to
 $8.2~{\rm\mu}\text{m}$
by choosing appropriate initial radii with an inside gas pressure of 100 bar and bubble-wall velocity
 $v_{1,2}=0~\text{m}~\text{s}^{-1}$
at the static pressure in the liquid of 1 bar. Colour denotes the jetting direction: when the jet of bubble 2 is directed towards bubble 1, the jet velocity is defined as negative (blue range), while it is positive (green–yellow–red range) when the jet of bubble 2 is directed away from bubble 1. Despite the fact that there are no negative velocities in the diagram due to
 ${\it\tau}=1$
, the same colour bar as in figure 17 is used for ease of comparison.

In practical applications, the distance
 $d$
of the focal spots and the time lag between the generation of the two bubbles is fixed, but the bubble sizes may vary as a result of pulse-to-pulse fluctuations of the laser energy. This will lead to fluctuations of all dimensionless parameters,
 ${\it\rho}$
,
 ${\it\gamma}$
and
 ${\it\tau}$
. The map in figure 17 reveals that small fluctuations in
 ${\it\gamma}$
and
 ${\it\tau}$
of the order of
 $\pm 15\,\%$
are not critical. When the bubble pair is generated with parameters in the optimum region (upper left region in the diagram of figure 17), the jetting behaviour stays sufficiently close to the optimum.
However, the influence of fluctuations of the relative bubble size,
 ${\it\rho}$
, still needs to be addressed. Figure 18 shows the parameter map of the dependence of direction and averaged jet velocity of bubble 2 on the relative bubble size,
 ${\it\rho}$
, and the relative distance,
 ${\it\gamma}$
, of micrometre-sized anti-phase bubble pairs (
 ${\it\tau}=1$
,
 $R_{max1}=8~{\rm\mu}\text{m}$
). Twenty points
 $({\it\gamma},{\it\rho})$
have been calculated and interpolated to obtain the diagram. Figure 18 can be considered as the extension of the line
 ${\it\tau}=1$
for micrometre-sized bubble pairs of the plane
 $\{({\it\rho}=1,{\it\gamma},{\it\tau})\}$
in figure 17 into the third dimension by
 ${\it\rho}$
, the relative bubble size, through the plane
 $\{({\it\rho},{\it\gamma},{\it\tau}=1)\}$
. There are two regions in figure 18 where the jet of bubble 2 attains high average velocities. One region is centred at
 ${\it\rho}\approx 0.97$
and
 ${\it\gamma}\approx 0.73$
, and a second region extends around
 ${\it\rho}\approx 0.65$
and
 ${\it\gamma}\approx 0.77$
.
5. Discussion
Experimentally observed bubble pair dynamics for millimetre-sized bubbles has been compared with numerical calculations for equal-sized bubble pairs (
 ${\it\rho}=1$
), the two bubbles being generated either simultaneously (
 ${\it\tau}=0$
) or subsequently, with the second one at maximum size of the first one (
 ${\it\tau}=1$
). The relative distances,
 ${\it\gamma}$
, were varied between about 0.7 and 1.5.
For the calculations, the freely available software OpenFOAM has been chosen. It is well suited for solving bubble dynamics problems. However, owing to restrictions in available computational resources, the strong shock waves occurring during laser bubble formation had to be circumvented to avoid a prohibitively fine mesh all over the computational domain. Moreover, a viable model of laser-induced breakdown including bubble formation is still lacking. In physical reality, the initial radius of the laser plasma producing a bubble of 1 mm maximum radius amounts to only
 $20{-}25~{\rm\mu}\text{m}$
, and the initial pressure is of the order of 25–80 kbar (Vogel, Busch & Parlitz Reference Vogel, Busch and Parlitz1996; Noack & Vogel Reference Noack and Vogel1998). The large pressure results in the formation of a shock wave that loses about 85 % of its energy already within the first
 $300~{\rm\mu}\text{m}$
from the source by dissipation at the shock front (Vogel et al.
Reference Vogel, Noack, Nahen, Theisen, Busch, Parlitz, Hammer, Noojin, Rockwell and Birngruber1999b
). As a consequence, the shock-wave-mediated interaction of two laser-produced bubbles separated by more than 1 mm is relatively weak. To avoid shock-wave formation,
 $R_{0}=130~{\rm\mu}\text{m}$
and
 $p_{0}=100~\text{bar}$
were used as initial conditions to start the expansion of bubble 2 for reaching a maximum radius of 1 mm as in the experiments. That way, shock waves upon breakdown are avoided and linear acoustics can be used. However, the acoustic transients emitted from such a source are – unlike the shock wave emitted from a laser plasma – hardly damped before they reach the neighbouring bubble and thus lead to a considerable acceleration of its collapse with an altered jetting dynamics. Adjustment of the sound velocity of the liquid in the simulations has been used to reduce the interaction strength between acoustic transient and bubble.
For the content inside the bubble, an ideal gas has been assumed without including liquid vapour with its evaporation and condensation as well as chemical reactions, as this again would lead to extreme complications in the calculations (see e.g. Fujikawa & Akamatsu Reference Fujikawa and Akamatsu1980; Prosperetti & Plesset Reference Prosperetti and Plesset1984; Yasui Reference Yasui1997; Storey & Szeri Reference Storey and Szeri2000; Marek & Straub Reference Marek and Straub2001; Müller et al.
Reference Müller, Bachmann, Kröninger, Kurz and Helluy2009; Dreyer et al.
Reference Dreyer, Duderstadt, Hantke and Warnecke2012; Lauer et al.
Reference Lauer, Hu, Hickel and Adams2012; Schanz et al.
Reference Schanz, Metten, Kurz and Lauterborn2012; Ishiyama et al.
Reference Ishiyama, Fujikawa, Kurz and Lauterborn2013; Zein, Hantke & Warnecke Reference Zein, Hantke and Warnecke2013; Lotfi, Vrabec & Fischer Reference Lotfi, Vrabec and Fischer2014). The simulations assume an initial bubble size larger than the laser plasma to arrive at the experimental maximum bubble radii. This will lead to an overestimation of the gas content inside the bubble. For instance, in the time interval between 80 and
 $100~{\rm\mu}\text{s}$
during which the jet impact occurs in the simulations of figure 15, the average gas pressure in bubble 2 is of the order of 0.2 bar. That is about eight times larger than the equilibrium water vapour pressure at room temperature, which is usually assumed to prevail in an expanded cavitation bubble (Akhatov et al.
Reference Akhatov, Lindau, Topolnikov, Mettin, Vakhitova and Lauterborn2001). Therefore, we refrain from quoting explicit values of the gas pressure and only describe the general features of the gas flow accompanying jet formation.
Experimentally visible features, on both a large scale and more subtle ones, of bubble pair dynamics are reproduced in the calculations. Among the immediately visible features are the approach of the two bubbles in the case of in-phase bubble pairs and the repulsion of the two bubbles in the case of anti-phase bubble pairs for equal-sized bubbles. Moreover, the directions of the two jets, towards each other for in-phase bubble pairs and away from each other for anti-phase bubble pairs, is well modelled, together with the increasing strength of the jet, when the bubbles are produced at smaller and smaller distances (smaller
 ${\it\gamma}$
). Also, fine details such as the formation of ‘horns’ upon collapse of bubble 1 in the anti-phase case show up in the calculations. This gives strong confidence that the assumptions made for modelling are adequate.
The numerical investigations have been extended beyond the experimental ones to the two two-parameter planes
 $\{({\it\rho}=1,{\it\gamma},{\it\tau})\}$
and
 $\{({\it\rho},{\it\gamma},{\it\tau}=1)\}$
in figures 17 and 18, respectively, for the case of micrometre-sized bubble pairs. This is done with a view towards applications in opto-injection. A description of the maps is given in § 4.3 and of the possible applications in § 5.2. The full three-dimensional parameter space
 $\{({\it\rho},{\it\gamma},{\it\tau})\}$
could not yet be covered. Moreover, the real bubble sizes play a role through the changing influence of the liquid parameters, for instance surface tension already adding an extra dimension (see the differences between millimetre-sized and micrometre-sized bubble pairs in figure 17).
5.1. Jet dynamics
Jetting strongly depends on the distance between the bubbles for both in-phase and anti-phase bubble pairs and ceases for very large distances (
 ${\it\gamma}\rightarrow \infty$
). Jet formation for an in-phase bubble pair with equal-sized bubbles is very similar to jet formation of a single bubble in the neighbourhood of a solid plane boundary and will not be discussed further here. It should only be mentioned that from this analogy it follows that the two jets are directed towards each other.
In the anti-phase case, for large distances between the two bubbles (figures 5 and 12 with
 ${\it\gamma}=1.5$
), the flow induced by the expansion of bubble 2 accelerates the collapse of bubble 1 downwards, thus generating a relatively fast jet away from bubble 2. The jet is thin, because it develops late in the collapse phase of bubble 1. By contrast, the jet in bubble 2 is broad due to its early formation.
With decreasing distances, the lower part of bubble 2 gets more elongated during the early stage of the collapse of bubble 1 until the two bubbles finally touch and merge during collapse. Down to
 ${\it\gamma}=1$
, the downward jet gets broader and slower, and the upward jet gets thinner and faster (experimental figures 6 and 7, simulation figures 13 and 14). Owing to the stronger influence from bubble 2, bubble 1 develops its jet earlier in the collapse phase with a broader base. On the other hand, bubble 2 starts its collapse from an ever more elongated state. More strongly curved parts of a bubble collapse first and faster (Lauterborn Reference Lauterborn1982) producing a thin jet because of the small extension of the strongly curved part.
For
 ${\it\gamma}\approx 0.8$
(figures 8 and 15) a new phenomenon takes over making the jet even thinner and faster. Now bubble 2 gets the form of a light bulb early in the expansion stage as if bubble 2 were partly sucked in by the collapsing bubble 1. Simultaneously, a ring of higher pressure develops around the neck of the elongation by the inflow of liquid compressing the neck. Upon neck closure (Burton, Waldrep & Taborek Reference Burton, Waldrep and Taborek2005; Thoroddsen, Etoh & Takehara Reference Thoroddsen, Etoh and Takehara2007) the liquid between the separated neck parts is accelerated upwards into bubble 2 and downwards through the separated neck part. Immediately after closure, the elongation of bubble 2 still has a sharp, singularity-like tip, and the jet emerging from this tip must be extremely thin and fast. This initial phase directly after closure of the neck could not be captured in our study due to the limited spatial and temporal resolution of high-speed photography and numerical simulations. Shortly afterwards, around
 $70{-}80~{\rm\mu}\text{s}$
after generation of bubble 2, the distal end of the elongation rushes upwards along the symmetry axis by the inflow of liquid. The near-axisymmetric flow field in the neck region closes the elongation progressively from the tip of the closed neck, producing a concentrated stagnation pressure along the axis below bubble 2. Jet formation is now sustained by the high stagnation pressure building up between the now separated bubble parts and by the ongoing collapse of bubble 2. Simultaneously to liquid jet formation, the gas that had filled the neck is also squeezed upwards and downwards by the fast liquid inflow sustained by the collapse of bubble 2 and thereby gains high speed. The gas flow precedes and accompanies the liquid jet (Müller, Helluy & Ballmann Reference Müller, Helluy and Ballmann2010) and broadens the gas tube around the jet when it is pushing the liquid at the opposite bubble wall ahead and aside.
The liquid jet velocities reached in anti-phase bubble pair dynamics by far exceed those from elongated bubbles released from a nozzle as measured by Séon & Antkowiak (Reference Séon and Antkowiak2012). The reason is the large pressure difference between bubble interior and liquid in the present case, which becomes maximal around the collapsing neck of bubble 2. Gordillo & Fontelos (Reference Gordillo and Fontelos2007) have pointed out the importance of the gas-to-liquid density ratio in bubble breakup in the course of neck shrinking and final collapse. For their calculations they use the neck dynamics model of Og̃uz & Prosperetti (Reference Og̃uz and Prosperetti1993), a two-dimensional version of the Rayleigh–Plesset equation. Chew et al. (Reference Chew, Klaseboer, Ohl and Khoo2011) call the formation of the high-speed jet the ‘catapult’ effect and offer the explanation that ‘bubble 1 supplies energy for bubble 2 by distorting it (analogous to storing elastic potential energy in a bow from stretching a string) and then releases the stored energy over a very short period of time when it collapses’. This explanation falls short because it considers merely the shape distortion of bubble 2 and implicitly suggests that surface tension in strongly curved parts drives jet formation. However, surface tension does not play a role in this type of jet formation (Antkowiak et al. Reference Antkowiak, Bremond, Le Dizès and Villermaux2007). The actual driving forces are provided by the pressure and flow fields surrounding the neck of bubble 2, as apparent from our numerical simulation results.
When the two bubbles are generated too close, they merge upon collapse of bubble 1 because initial bubble expansion is faster than initial bubble collapse. The two bubbles exchange gas, and bubble 1 gets shattered into many pieces (
 ${\it\gamma}=0.714$
, figures 9 and 16). Bubble 2, nonetheless, develops a fast jet arising from the constriction of its elongation.
For
 ${\it\gamma}\leqslant 1.0$
, the jet through bubble 2 impinges on the opposite inner bubble wall when bubble 2 is near maximum expansion, the pressure inside the bubble is low, and the wall is almost at rest. Upon jet impact, a transient water hammer pressure
 $$\begin{eqnarray}p_{\mathit{WH}}={\textstyle \frac{1}{2}}{\it\rho}_{w}c_{w}v_{\mathit{jet}}\end{eqnarray}$$
evolves, where
 ${\it\rho}_{w}$
and
 $c_{w}$
are the density and sound velocity of water, respectively (Brunton Reference Brunton1966; Lesser & Field Reference Lesser and Field1983; Brujan et al.
Reference Brujan, Nahen, Schmidt and Vogel2001b
). This pressure results in the formation of a cylindrical cavity around the jet due to sideward displacement of the liquid upon impact and entry. At later stages, the ongoing jet flow pushes the liquid more smoothly ahead, producing a dynamic pressure
 $$\begin{eqnarray}p_{\mathit{dyn}}={\textstyle \frac{1}{2}}{\it\rho}_{w}v_{\mathit{jet}}^{2}.\end{eqnarray}$$
The respective values for a jet impacting at
 $150~\text{m}~\text{s}^{-1}$
are
 $p_{\mathit{WH}}=110~\text{MPa}$
and
 $p_{\mathit{dyn}}=11.2~\text{MPa}$
. During jet propagation,
 $p_{\mathit{dyn}}$
drops rapidly to less than 1 MPa when the jet is decelerated to
 $v_{jet}\leqslant 45~\text{m}~\text{s}^{-1}$
. The experimental results in figure 8 for
 ${\it\gamma}=0.75$
do not show the entire jet length because it extends beyond the upper boundary of the frames. However, one can read from the frames that the penetration depth beyond the maximally expanded bubble 2 is at least three times
 $R_{max2}$
. This result is reproduced in the numerical simulations.
Since the jet impact occurs when bubble 2 is maximally expanded, the bubble pressure will probably be close to the equilibrium water vapour pressure at room temperature, i.e. of the order of 25 mbar (Akhatov et al. Reference Akhatov, Lindau, Topolnikov, Mettin, Vakhitova and Lauterborn2001). Therefore, jet entry will differ from the impact of a liquid jet onto a water surface in air (Kersten, Ohl & Prosperetti Reference Kersten, Ohl and Prosperetti2003). In the latter case, the jet tip is separated from the surface of the resting liquid by an air cushion that is partly entrained into the liquid, causing instabilities of the jet flow. In the present case, such entrainment is diminished due to the reduced bubble gas pressure. Moreover, a gas jet preceding the liquid jet is formed inside the bubble that already indents the bubble wall before the liquid jet impact occurs (figures 15 and 16). Therefore, the jet entry is smoother and more stable, and jet propagation is facilitated.
The jetting produces directional flow out of an initially isotropic situation, without the presence of adjacent boundaries, or pressure gradients. The momentum of the two jets must add up to zero in order to conserve the initial momentum but their speed and mass may differ. The jet through bubble 2 attains a very high speed of up to
 $150~\text{m}~\text{s}^{-1}$
(at
 ${\it\gamma}=0.8$
). Owing to its high speed and smooth entry, the jet reaches far into the liquid behind bubble 2 and may be used for penetrating structures located within the liquid in the vicinity of the bubble. Since the water hammer pressure scales with
 $v_{\mathit{jet}}$
, both penetration depth and impact pressure can be tuned by varying the distance between bubble 2 and the target. The jet through bubble 1 is, for
 ${\it\gamma}\leqslant 1$
, more massive but slower than the jet through bubble 2. Therefore, the jet-induced vortex flow around the rebounding bubble becomes a more prominent feature of the velocity field for bubble 1 than for bubble 2. This feature may be useful for creating a shear flow near bubble 1. The complicated flow generated by the jetting of the anti-phase bubble pair may also be used for laser-induced mixing in microfluidic systems (Hellman et al.
Reference Hellman, Rau, Yoon, Bae, Palmer, Phillips, Allbritton and Venugopalan2007) by extending their single-bubble scheme to bubble pairs.
Adjacent structures outside the anti-phase bubble pair located on the axis connecting the bubble centres may further enhance key features of the dynamics described above. A rigid boundary above bubble 2 supports jet formation in the same direction as without the boundary (Tomita et al. Reference Tomita, Sato, Shima, Blake, Boulton-Stone and Thomas1994). The same applies for a rigid boundary below bubble 1. Moreover, the boundary contributes to an early formation of the outwardly directed jet that produces a broad jet resulting in a pronounced vortex flow around the rebounding torus bubble (Jungnickel Reference Jungnickel1995).
5.2. Implications for opto-injection
The far-reaching jet through bubble 2 can be employed for micro-pumping. Dijkink & Ohl (Reference Dijkink and Ohl2008) have already demonstrated micropumping through an orifice in a rigid boundary using the jetting action of single laser-induced cavitation bubbles. The interaction of laser-produced bubble pairs enables the generation of directional flows without any additional means. Solid or free boundaries in the vicinity of the bubble pair may support the jetting action but are not needed for its initiation. Thus, additional degrees of freedom are provided by utilizing bubble pairs.
A very interesting variant of micro-pumping by means of laser-induced bubbles is the injection of genetic materials or other substances into living cells. The use of laser-based methods for cell transfection is an active area of research, because they can selectively target individual cells within a mixed cell population and specific cells of interest within a cell cluster (or possibly even in living tissue). Various methods for opto-poration of the cell membrane have been developed in recent years (Tirlapur & König Reference Tirlapur and König2002; Vogel et al. Reference Vogel, Noack, Huettmann and Paltauf2005; Baumgart et al. Reference Baumgart, Bintig, Ngezahayo, Willenbrock, Murua Escobar, Ertmer, Lubatschowski and Heisterkamp2008; Antkowiak et al. Reference Antkowiak, Torres-Mapa, Gunn-Moore and Dholakia2010; Stevenson et al. Reference Stevenson, Gunn-Moore, Campbell and Dholakia2010; Antkowiak et al. Reference Antkowiak, Torres-Mapa, Stevenson, Dholakia and Gunn-Moore2013a ,Reference Antkowiak, Torres-Mapa, Witts, Miles, Dholakia and Gunn-Moore b ; Davis et al. Reference Davis, Farrar, Nishimura, Jin and Schaffer2013). Usually, a laser pulse is focused onto the cell membrane in order to create a hole. Differences lie in the duration, energy, number and wavelength of the pulses employed, and in the shape of the laser focus (Gaussian or Bessel beam).
All methods mentioned share the drawback that material transport into the cell relies on diffusion, which is a slow process. Furthermore, they rely on a delicate balance between two needs: the hole must be large enough for diffusion of a sufficient amount of genetic material, and small enough to maintain cell viability. If the hole is large and osmotic gradients are unfavourable, parts of the cytoplasm may even be lost through the hole in the cell membrane instead of material diffusion into the cell. The use of active transport mechanisms may offer a gentle and reliable solution.
Mechanical injection via a micro-pipette (Diacumakos Reference Diacumakos1973; Pepperkok et al.
Reference Pepperkok, Zanetti, King, Delia, Ansorge, Philipson and Schneider1988) is an efficient method for injecting a bolus of desired mass into the cell but it is tedious, time-consuming and bears the risk of contamination. Opto-injection via jetting from laser-produced cavitation bubbles would be an efficient non-contact alternative. The typical diameter of a pipette used for micro-injection of cells is
 ${\leqslant}1~{\rm\mu}\text{m}$
(Pepperkok et al.
Reference Pepperkok, Zanetti, King, Delia, Ansorge, Philipson and Schneider1988). The tip diameter of a jet produced by the interaction of a bubble pair at
 ${\it\gamma}=0.8$
is about one-fifteenth of the maximum diameter of bubble 2 (figures 8 and 15). For bubbles with
 $R_{max}\leqslant 7.5~{\rm\mu}\text{m}$
, the jet diameter is thus smaller than a pipette tip.
In mechanical micro-injection, a slow fluid flow is guided by a hollow needle or capillary, which enters the cell through mechanical pressure during advance of the needle. By contrast, the cavitation-induced jet flow is slim, guided by its mechanical momentum, and penetrates through its water hammer pressure followed by the dynamic pressure of the ongoing flow (5.1) and (5.2). As much as a pipette injection may damage a cell, also the jet impact followed by the expansion of the cavity produced around the jet tip can produce collateral damage. Damage can be minimized by adjusting both the distance between bubble 2 and the cell in such a way that the cell is not affected by the water hammer pressure but only by the lower dynamic pressure accompanying the subsequent jet flow. Under these conditions, the bubble-pair-induced jet flow can probably be more gentle than a needle injection. It may also be more gentle than a single laser pulse focused at the cell membrane that ruptures the membrane by plasma-induced bubble expansion. The injected volume can be controlled independently by adjusting the bubble radius, while maintaining the
 ${\it\gamma}$
value.
In all short-pulsed optical transfection techniques, biomolecules within the laser-induced plasma are disintegrated as in any other type of plasma-mediated cell surgery (Vogel et al. Reference Vogel, Noack, Huettmann and Paltauf2005). However, in opto-injection, plasmas are produced at a distance from the target cell, and the fluid forming the jet is entrained from regions outside the plasma volumes (figures 15 and 16). This feature contributes to the efficacy and gentleness of the method.
As an alternative to opto-injection, one can use the ring vortex formed upon collapse of bubble 1 to exert shear forces on cells that may porate the cell membrane by a different mechanism. Dijkink et al. (Reference Dijkink, Le Gac, Nijhuis, van den Berg, Vermes, Poot and Ohl2008), Hellman et al. (Reference Hellman, Rau, Yoon and Venugopalan2008) and Compton, Hellman & Venugopalan (Reference Compton, Hellman and Venugopalan2013) have analysed the action of shear forces induced by individual laser-produced cavitation bubbles on groups of cells. Laser pulses with energies of a few microjoules (Hellman et al. Reference Hellman, Rau, Yoon and Venugopalan2008; Compton et al. Reference Compton, Hellman and Venugopalan2013) or millijoules (Dijkink et al. Reference Dijkink, Le Gac, Nijhuis, van den Berg, Vermes, Poot and Ohl2008) were focused onto an adherent cell layer in a Petri dish, and the flow and shear forces created by the resulting oscillating bubble was used for cell poration. In the immediate vicinity of the plasma, all cells were destroyed, but within a certain distance range from the breakdown site, shear forces were appropriate to cause membrane permeabilization on vital cells. It is conceivable that shear forces produced by bubble pairs created in the culture medium at a certain distance from the cell layer can achieve membrane permeabilization without any cell killing.
Sankin et al. (Reference Sankin, Yuan and Zhong2010) were the first to successfully demonstrate transfection of individual cells by jetting arising from the interaction of two laser-produced bubbles oscillating at opposite phase. Flat bubbles were produced between a glass plate and the bottom of a Petri dish, which then interacted with adjacent cells in this confined geometry. The effect of jetting on both sides of the two-bubble system (fast thin jet and slow massive jet) was investigated experimentally, and later also numerically by means of a three-dimensional boundary integral method (Hsiao et al. Reference Hsiao, Choi, Singh, Chahine, Hay, Ilinskii, Zabolotskaya, Hamilton, Sankin, Yuan and Zhong2013). Both kinds of flow worked for cell transfection, with slightly higher success rate of transfection with the thick jet. Jetting from a pair of spherical bubbles produced in bulk liquid as investigated in the present study will produce thinner jets than the flat bubbles used in Sankin’s study, and it will enable opto-injection without the geometric restrictions in that study. Thus it is a versatile instrument that may be applicable in cell culture, microfluidic systems and for single-cell transfection in weakly scattering living tissue.
The maps in figures 17 and 18 reveal that the parameter space in which fast jets are formed is large enough to make opto-injection feasible even under experimental conditions in which
 ${\it\rho},~{\it\gamma}$
and
 ${\it\tau}$
fluctuate. For practical uses of opto-injection, the bubble pair dynamics must be scaled down to micrometre-sized bubbles. For bubble parameters of the order of
 $10~{\rm\mu}\text{m}$
, the jet diameter is considerably smaller than
 $1~{\rm\mu}\text{m}$
, and opto-injection will probably not affect cell viability. Downscaling of bubble size is possible using shorter laser pulses and tighter focusing than employed in the present study. With such devices combined with appropriate beam steering (Antkowiak et al.
Reference Antkowiak, Torres-Mapa, Stevenson, Dholakia and Gunn-Moore2013a
), opto-injection into individual cells in a larger cell population will become feasible.
The map in figure 18 indicates that fast jets are produced in two parameter regions with largely different relative bubble size
 ${\it\rho}$
. The first region around
 ${\it\rho}\approx 0.97$
with bubbles of similar size was investigated in the present study, whereas systematic investigations of the second region around
 ${\it\rho}\approx 0.65$
are still lacking. It will be interesting to see the latter region develop with decreasing
 ${\it\tau}$
. A particularly interesting case is
 ${\it\tau}=0$
(simultaneous generation of two bubbles of different size), which can easily be realized experimentally and would facilitate the practical implementation of opto-injection.
6. Conclusions
Experiments with millimetre-sized bubble pairs have shown that two-bubble interaction may lead to strong jet formation, the jets being directed either towards or away from each other. Particularly fast, long and thin liquid jets are observed with anti-phase bubble pairs, where the second bubble is produced at maximum volume of the first bubble. Two-bubble jetting produces directional flow out of an initially isotropic situation, without the presence of adjacent boundaries or pressure gradients. It may be used for penetrating structures located within the liquid in the vicinity of the bubble pair.
Simulations with OpenFOAM confirm these findings, together with further specific details of bubble pair dynamics. This gives confidence in the validity of the simulations and their predictive power for further configurations. In a first step, the simulations have been extended to micrometre-sized bubble pairs, where surface tension comes into play and the simulations deviate from the results for larger bubbles. Two maps of average jet velocities are calculated for micrometre-sized bubble pairs to find parameter regions of high jet velocities for possible applications in mixing, opto-poration and opto-injection (drug delivery, gene transfection).
Pressure and velocity distributions in and around the bubbles provide a better understanding of the jetting mechanisms. Additional, as yet unknown and unexpected phenomena have been found inside bubbles, notably high-speed gas jet flows preceding and accompanying the high-speed liquid jets. They depend on the amount and density of gas inside the bubble and may become a topic of investigation in future studies on high-speed neck breakup with normal, coated and special gas-filled bubbles. In that case, the approximations done here must be relaxed to a more realistic EOS of the gas contents and of the liquid, including shock waves.
More complex bubble configurations than bubble pairs, including a variety of bubble–boundary interactions, can easily be imagined for future studies. Thus the present investigations have opened the door for systematic studies of jetting phenomena in multi-bubble systems.
Acknowledgements
This work was supported in part by the Chinese Scholarship Council (CSC), the National Natural Science Foundation of China for Young Scholars (No. 11402120) and the Jiangsu Natural Science Foundation for Young Scholars (No. BK20140796), by the Deutsche Forschungsgemeinschaft (DFG), and by the Austrian Federal Ministry of Economy, Family and Youth. The authors thank S. Freidank for help with the graphics from the experiments and simulations, T. Geiling for continuous help with the computer systems, H. Söhnholz for help with the computer cluster for optimum use of OpenFOAM, and M. Koch and C. Lechner for fruitful discussions concerning the OpenFOAM code.


 Open access

