Introduction
Sixty percent (36600 km2) of the Svalbard archipelago is enveloped in glaciers and icecaps (Hagen and others Reference Hagen, Liestøl, Roland and Jørgensen1993). Snow brings down to the glacial surface atmospheric dust along with the microbial cells/propagules and preserves them.
A detailed understanding of snow-atmosphere relations is important in understanding the current atmospheric processes. Extensive research on ice-cores in the past few years in Greenland, Canadian high Arctic and Antarctica has provided a clue to these interactions. Glaciochemical and biological studies on ice cores therefore serve as an efficient and measurable tool to study atmospheric environmental conditions worldwide (Cole Dai Reference Cole Dai2001). Previous glaciochemical studies in Svalbard includes those by Goto-Azuma and others (Reference Goto–Azuma, Kohshima, Kameda, Takahashi, Watanabe, Fujii and Ove Hagen1995), Isaksson and others (Reference Isaksson, Pohjola, Jauhiainen, Moore, Pinglot, Vaikmäe, van de Wal, Hagen, Ivask, Karlöf, Martma, Meijer, Mulvaney, Thomassen and van den Broeke2001), Pinglot and others (Reference Pinglot, Vaikmäe, Kamiyama, Igarashi, Fritzsche, Wilhelms, Koerner, Henderson, Isaksson, Winther, van de Wal, Fournier, Bouisset and Meijer2002), Moore and others (Reference Moore, Grinsted, Kekonen and Pohjola2005). Glaciobiological studies in the region are fewer (Skidmore and others Reference Skidmore, Foght and Sharp2000) with more emphasis on cryoconite biology (Säwström and others Reference Säwström, Mumford, Marshall, Hodson and Laybourn–Parry2002; Amato and others Reference Amato, Hennebelle, Magand, Sancelme, Delort, Barbante, Boutron and Ferrari2007; Edwards and others Reference Edwards, Anesio, Rassner, Sattler, Hubbard, Perkins, Young and Griffith2011). Glacial ice bacteria have been reported from other parts of Arctic such as the high Canadian Arctic (Dancer and others Reference Dancer, Shears and Platt1997).
Midre Lovénbreen glacier is a slow moving, 4km long, polythermal valley glacier with continuous mass balance records since 1967. Average accumulation and ablation values per year for this glacier, as observed over a period of 34 years, from 1968 to 2002, are 0.72 and 1.05 m water equivalents, respectively. The average net mass balance value therefore is −0.33m water equivalent per year (Wright Reference Wright2005). Through simulated models it was observed that superimposed ice contributes significantly towards maintaining the mass balance of the glacier (Wright and others Reference Wright, Wadham, Siegert, Luckman and Kohler2005).
To measure the elemental concentration in the firn-cores at this glacier area, the firn at 4 points on the glacier were studied up to a depth of 1m. Bacteriological investigation in these samples was also carried out in order to understand their flux within the firn cores. The four points selected for the study lay more-or-less linear to one another but varied in altitude. These locations were selected so that an appropriate correlation between elemental concentration and altitude can be made.
Experimental
Sampling site and collection of samples
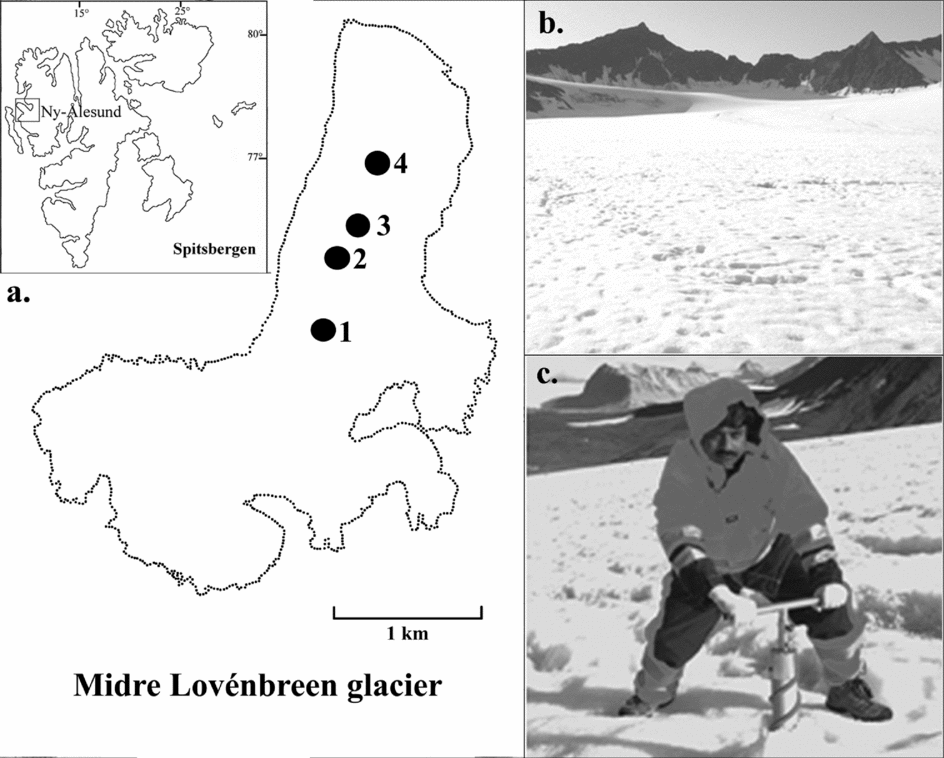
All samplings were done at Midre Lovénbreen glacier, Ny-Ålesund, West Spitsbergen, Svalbard (Fig. 1a, b), approximately 3–5km from the coast, during the Indian Arctic Expedition 2009. The samples were collected in the summer months, between 164 to 273m altitude, following strict contamination-free procedures (Veysseyre and others Reference Veysseyre, Moutard, Ferrari, van de Velde, Barbante, Cozzi, Capodaglio and Boutron2001). Firn-cores of 1m depth were cored out through a clean hand operated corer from 4 different locations (Core 1: 78° 52.815 N, 12° 02.405 E, 273 m a.s.l.; Core 2: 78° 53.006 N, 12° 02.610 E, 242 m a.s.l.; Core 3: 78° 53.197 N, 12° 02.940 E, 205 m a.s.l.; Core 4: 78° 53.418 N, 12° 03.283 E, 164 m a.s.l.) on the glacier (Fig. 1). Each core was divided into 3 sections (~33 cm length each), which were kept frozen until analysis. The top, middle and bottom sections were named ‘T’, ‘M’ and ‘B’ respectively, for each core.
a) Sampling locations at Midre Lovénbreen glacier, Svalbard, b) Midre Lovénbreen glacier surface at the collection site, c) coring using a hand operated corer.

Since the study also included microbiological observations, in order to avoid contamination, only the inner parts of the sub-samples were melted and collected in sterile beakers inside a laminar flow chamber in clean laboratory conditions.
Analytical procedure and microbiological analyses
The elemental concentration in the melted firn-core samples was determined through ICPMS (Thermo Scientific ICPMS-X series II) using Merck CertiPUR ICP multi-element standard solution XXI for MS. Readings were measured in triplicate. The elements analysed included Arsenic (As), Barium (Ba), Boron (B), Cadmium (Cd), Calcium (Ca), Cesium (Cs), Chromium (Cr), Cobalt (Co), Copper (Cu), Iron (Fe), Lead (Pb), Lithium (Li), Magnesium (Mg), Manganese (Mn), Nickel (Ni), Rubidium (Rb), Selenium (Se), Strontium (Sr), Vanadium (V) and Zinc (Zn). Elemental concentrations were recorded in ppb.
Total bacterial counts (TC) and bacterial colony forming units (CFU's) were determined for per millilitre meltwater for each of the three subsamples of the 4 firn-cores under study. Total bacteria in the samples were counted following the procedure by Kuwae and Hosokawa (Reference Kuwae and Hosokawa1999) with minor modifications. Twenty microlitre DAPI (4’, 6-Diamino-2-phenylindole) solution (0.25% w/v in sterile distilled water) was added to 1 ml meltwater sample, taken in a sterile vial. After keeping in the dark for ~30 minutes the sample was filtered on to a 0.2μm Nuclepore polycarbonate track etched membrane filter. The filter was rinsed with a few drops of saline to wash out the unbound DAPI and observed under an epifluorescent microscope (BX-51, Olympus, Japan) using non-fluorescent immersion oil. Bacterial cells appearing as bright blue spots against a dark background were enumerated and number of cells per ml of meltwater calculated. Enumeration of culturable bacteria was done using the spread plate method on Nutrient Agar (NA) and 1/10 Nutrient Agar (1/10 NA) media.
Statistical analysis
Variance in the data sets was tested for statistical significance through one-way ANOVA. Correlation through paired group cluster analysis was performed using PAST software ver. 2.01 (Hammer and others Reference Hammer, Harper and Ryan2001).
Results and discussion
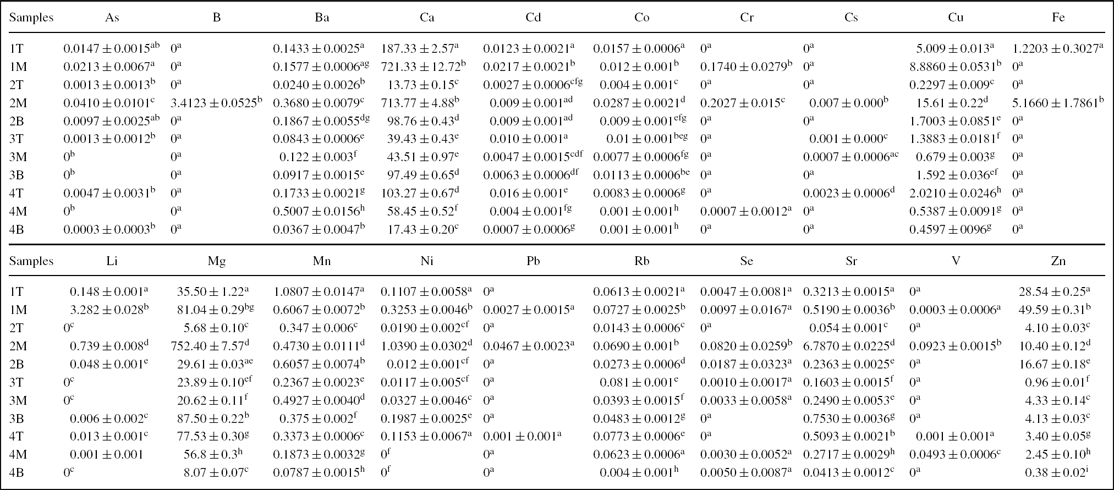
Elements analysed in the present study included alkali metals such as Li and Rb; alkaline earth metals such as Ba, Ca, Mg and Sr; transition metals such as Cd, Co, Cr, Cu, Fe, Mn, Ni, V, and Zn; other metals such as Pb and non-metals such as As, B and Se. Their concentrations in the three layers of firn for the 4 sampling points are given in Table 1 along with standard deviation based on triplicate readings. Statistical significance of the variation between different layers is also mentioned.
Elemental composition (in ppb) of the surface and sub-surface ice in the study area and their comparison with the recommended values. Data in the same column followed by a different alphabet are significantly different according to the one-way ANOVA (P < 0.01).
Elemental variation
Elements in their particulate phase form excellent trackers of environmental pollution (Savarino and others Reference Savarino, Boutron and Jaffrezo1994). In the firn samples studied, these were present in variable concentrations. For elements such as As, B, Cr, Cs, Fe, Pb, Se and V the values were close to not-detectable at ppb levels. Highest concentrations were that of Ca and Mg in all the cores studied. Comparison with studies on Greenland ice cores (Savarino and others Reference Savarino, Boutron and Jaffrezo1994) suggests that although the values of Pb are comparable, the values of other elements such as Cd, Cu and Zn are high at the present study area. Similar study by Shotyk and others (Reference Shotyk, Zheng, Krachler, Zdanowicz, Koerner and Fisher2005), on Devon Island, Canadian Arctic, also observed the average value of Pb to be low (45.2 pg/g or 0.045 ppb), 95–99% of which was calculated to be anthropogenic. In the mid 1900s the values of Pb were high (Murozumi and others Reference Murozumi, Chow and Patterson1969; Wolff and Peel Reference Wolff and Peel1988; Görlach and Boutron Reference Görlach, Boutron and Vernet1989) in the Arctic. Ice-core studies in Greenland (Boutron and others Reference Boutron, Candelone and Hong1995) suggested that Pb, Cd, Zn and Cu concentrations had significantly increased in Greenland snow until mid 1960s. Discontinuation of the use of leaded gasoline in North America and western European countries by 1980s led to the drastic reduction of Pb in the environment (Lobinski and others Reference Lobinski, Boutron, Candelone, Hong, Szpunar–Lobinska, Adams, Allan and Nriagu1993; Shotyk and others Reference Shotyk, Zheng, Krachler, Zdanowicz, Koerner and Fisher2005).
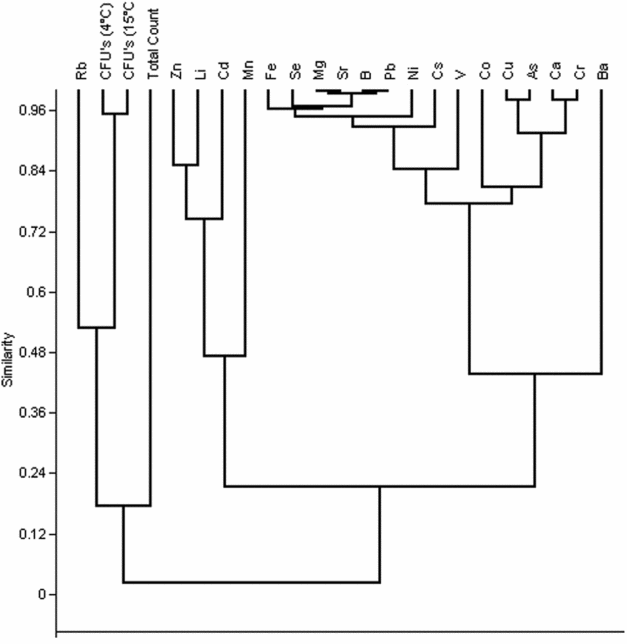
A dendrogram illustrating the correlation between the different elements studied based on their concentration in the ice layers is given in Fig. 2. A strong correlation is observed between B, Fe, Mg, Pb, Se and Sr (R2>0.95). A correlation is also observed between As and Cu (R2 = 0.96) and Ca and Cr (R2 = 0.96).
Dendrogram illustrating correlation between different elements based on their concentration in the different ice layers.
Variation in concentration as a function of depth
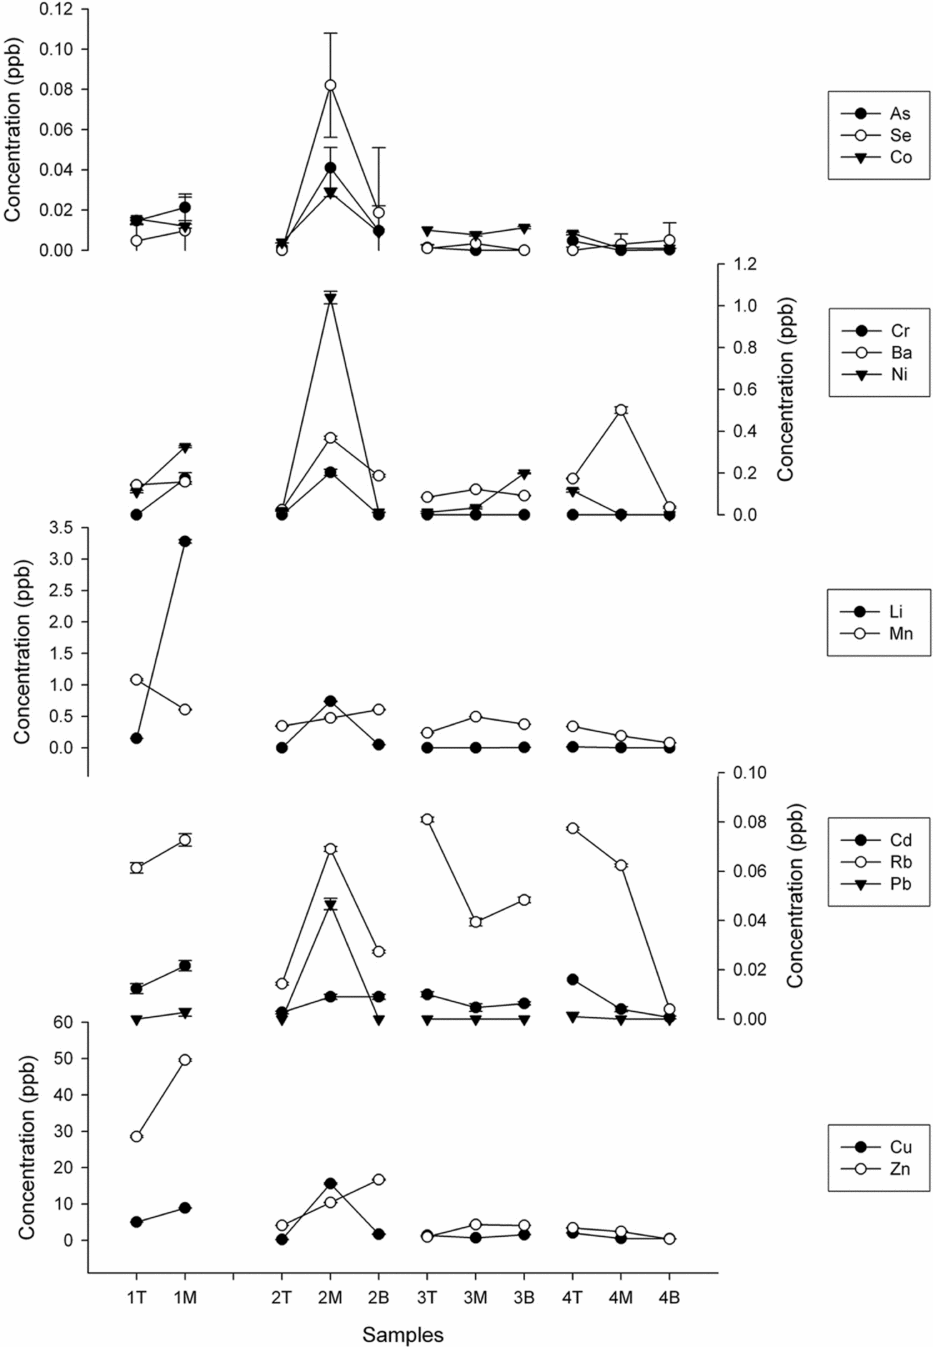
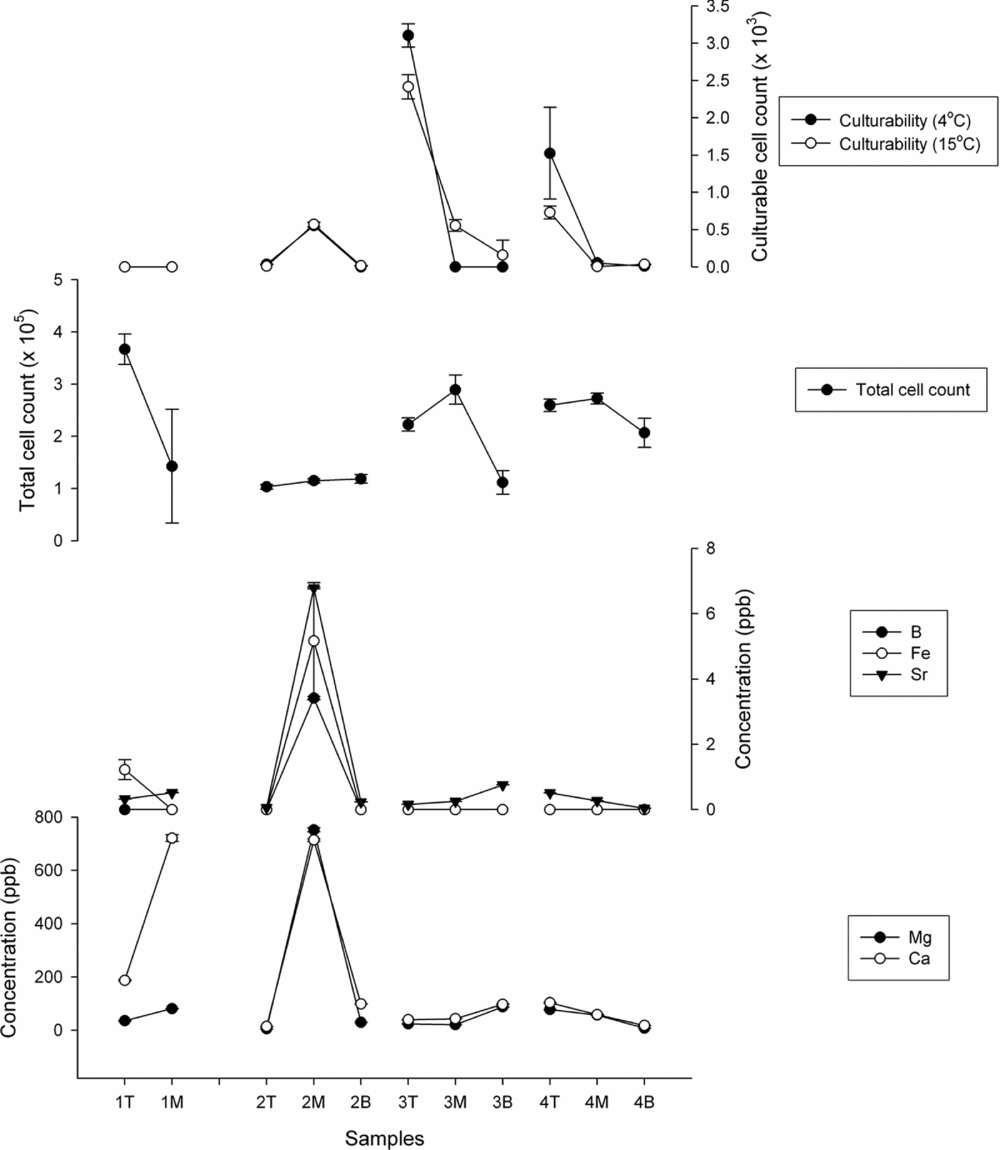
When subsections of each core are compared it is observed that for several of the elements the highest concentration occurred in the middle strata of the core suggesting that in the recent past there occurred heavy deposition of elemental dust in this area (Figs. 3, 4). With a 34 year averaged net mass balance value of −0.33 m water equivalent per year (Wright Reference Wright2005), and the sampling for the present study being done in summer months, it is certain that the firn cores studied are not of very recent snow deposition.
Elemental concentrations at various depths in the samples studied.
Elemental concentrations and bacterial counts at various depths in the samples studied.
The differences in elemental concentration between the different layers were statistically significant (Table 1) indicating that the dispersal pattern of trace elements in the firn is retained according to its time of deposition. This further indicates that during the summer ablation, the flow pattern of melted ice is comparatively simple, preventing extensive vertical mixing, thus maintaining its stratigraphic integrity.
Variation in concentration as a function of altitude
The Midre Lovénbreen glacier is a valley-type glacier. As known from earlier studies (Benson Reference Benson and Stonehouse1987), in sheltered valleys such as these, the aerial deposition of elements through particulate matter is high as these air layers remain stable. Although the four collection sites in the present study lay within an altitude of about 100 metres a difference in the deposition pattern was observed. For the four collection sites when grouped into two each based on altitudes, it was observed that in all the elements, except Rb and Ba, the concentration was higher in cores 1 and 2 as compared with cores 3 and 4 indicating that maximum deposition occurred at higher altitudes. The difference in the concentration was statistically significant at p<0.05 (data not shown) for most of the elements (Li, B, Ca, Cr, Mn, Fe, Co, Ni, Cu, Zn, As, Se, Pb).
Crustal enrichment factors
To evaluate the contribution of the elements from natural sources the crustal input was calculated using Fe as a reference element. The mean metal to Fe ratio was used to determine the percent contribution by individual metals using standard values as given by Shaw and others (Reference Shaw, Reilly, Muysson, Pattenden and Campbell1967, Reference Shaw, Dostal and Keays1976).
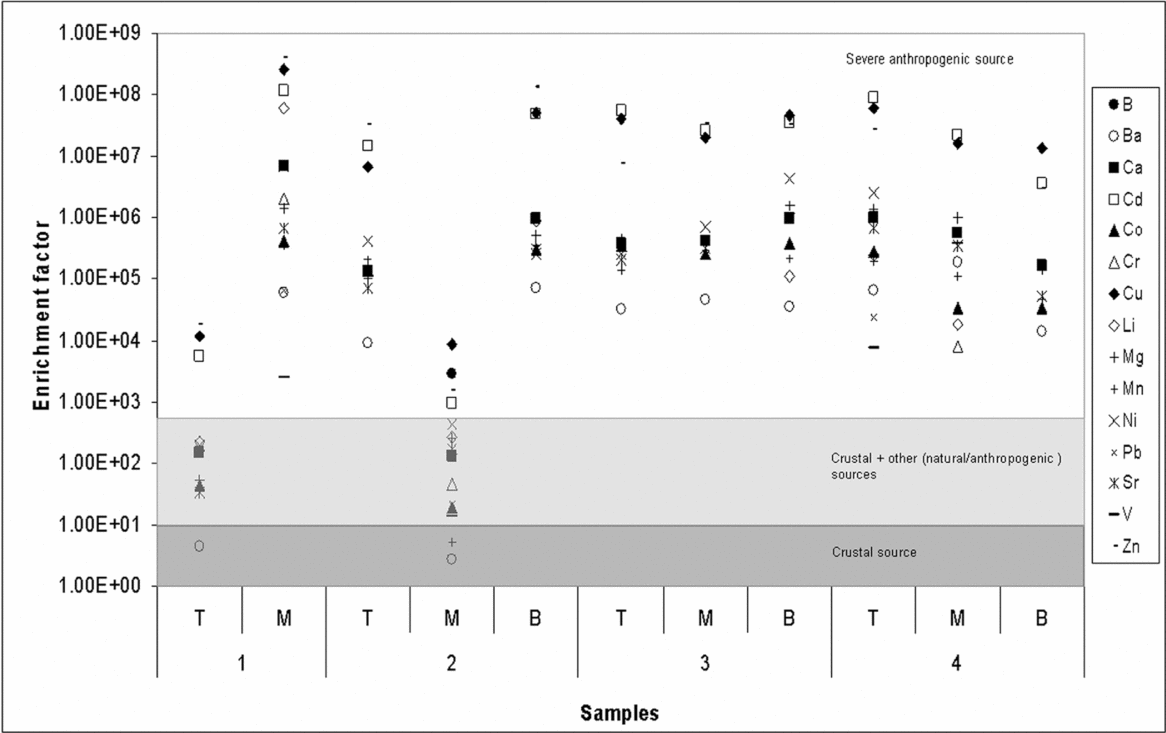
Providing appropriate space for variation in the crustal composition, the enrichment factors within the range 0.1 to 10 were considered as a contribution from crustal sources, those between 10 and 500 were considered moderately enriched from other natural and/or anthropogenic sources in addition to the crustal material and finally those above 500 were considered highly enriched suggesting a severe anthropogenic contribution besides the natural sources (Dasch and Wolff Reference Dasch and Wolff1989; Veysseyre and others Reference Veysseyre, Moutard, Ferrari, van de Velde, Barbante, Cozzi, Capodaglio and Boutron2001).
The mean crustal enrichment factor (EF) values for these metals for each sampling site at each depth has been graphically represented (Fig 5). Results indicate that the crustal inputs are negligible for most of the metals.
Mean crustal enrichment factors for the different samples at the Lovénbreen glacier.
At ‘1T’ Ba while at ‘2M’ Ba and Mn showed EF values between 1 and 10 indicating that the crustal dust is the major source of these elements. Elements such as B, Cr, Pb and V were close to non-detectable limits in most of the samples studied (Table 1).
Probable depositions from sea salt and other natural sources
The enrichment factor values of Ca, Co, Li, Mg, Mn, Ni and Sr at ‘1T’ while that of Ca, Co, Cr, Li, Mg, Ni, Pb, Sr and V at ‘2 M’ were between 10 and 500 indicating that these elements were moderately enriched by one or several other sources in addition to crustal input.
The other possible natural sources of elements include sea salt spray, volcanoes and wild forest fires (Nriagu Reference Nriagu1989, Reference Nriagu and Ulis1998). Sea surface winds are known to deposit sea salt aerosols on the adjoining landmasses. According to the Geochemical Atlas in northern Norway, Mg finds its source mostly from sea aerosol (Reimann and others Reference Reimann, Chekushin, Bogatyrev, Boyd, deCaritat, Dutter, Finne, Halleraker, Jæger, Kashulina, Lehto, Niskavaara, Pavlov, Raisanen, Strand and Volden1998). Calcium also has a marine source. The distance from the ocean being less (about 3–5 km), the contribution from sea-salt spray and marine biogenic sources especially of elements such as Ca and Mg may be significant in the present study. The absence of Na data however restricts the study from accurately determining the sea salt spray contribution. The possibility of volcanic contribution to the elemental dust in this region exists. Hoffmann (Reference Hoffmann2010) reports the recent volcanic eruptions in the northern hemisphere (Mount Redoubt and Kasatochi in USA and Sarychev volcano in Russia) to enhance the aerosol concentrations in the Arctic atmosphere. The eruptions of Beerenberg in 1970, 1973 and 1985, and a few of the volcanoes in Iceland in recent years may have added to the aerosol concentration in the region. However, since the firn cores, in the present study, have not been correlated with time it is difficult to verify these possibilities.
Finally the forests fires in the North American boreal forests, central Siberia and eastern Europe adds contaminating aerosols and black carbon to the Arctic atmosphere on the whole (Balzter and others Reference Balzter, Gerard, George, Rowland, Jupp, McCallum, Shvidenko, Nilsson, Sukhinin, Onuchin and Schmullius2005; Kim and others Reference Kim, Hatsushika, Muskett and Yamazaki2005; Stohl and others Reference Stohl, Berg, Burkhart, Fjæraa, Forster, Herber, Hov, Lunder, McMillan, Oltmans, Shiobara, Simpson, Solberg, Stebel, Ström, Tørseth, Treffeisen, Virkkunen and Yttri2007). Although remote regions such as Ny-Ålesund are less affected by these fire plumes (Stohl and others Reference Stohl, Andrews, Burkhart, Forster, Herber, Hoch, Kowal, Lunder, Mefford, Ogren, Sharma, Spichtinger, Stebel, Stone, Ström, Tørseth, Wehrli and Yttri2006) constant deposition of these aerosols in minor quantities over the years through transboundary air circulation could be a substantial contribution.
Contribution from anthropogenic sources
Enrichment factors for all elements in other samples and Cd, Cu and Zn at ‘1T’ and ‘2M’ were above 500 indicating that these elements were highly enriched from anthropogenic sources (Fig. 5).
Anthropogenic sources in this remote region could either be local or transboundary. The local sources of pollution mainly includes the vehicular traffic existing in the area, apart from the possible contribution from coal mines located at Barentsburg, Sveagruva, Pyramiden and Longyearbyen, within 120km of the area studied (Isaksson and others Reference Isaksson, Hermanson, Hicks, Igarashi, Kamiyama, Moore, Motoyama, Muir, Pohjola, Vaikmäe, van de Wal and Watanabe2003).
Transboundary pollution is of equal importance because of the geographic positioning of the region (DiGiovanni and Fellin Reference DiGiovanni, Fellin, Inyang and Daniels2006). Owing to the influence of low pressure area over Iceland and high pressure area over Greenland and the Arctic Ocean, the pollutant laden air mass from lower latitude areas is transported over Svalbard, which is the first land mass in the path (Barrie Reference Barrie1986). The northern part of the archipelago however is dominated by easterly and northeasterly winds (Issakson and others Reference Isaksson, Hermanson, Hicks, Igarashi, Kamiyama, Moore, Motoyama, Muir, Pohjola, Vaikmäe, van de Wal and Watanabe2003). These two extreme air masses to a large extent affect the atmospheric circulation over Svalbard and thereby promote transboundary deposition of pollutants (Gjessing Reference Gjessing1977; Staebler and others Reference Staebler, Toom–Sauntry, Barrie, Langendörfer, Lehrer, Li and Dryfhout–Clark1999; Goto-Azuma and Koerner Reference Goto–Azuma and Koerner2001). Other reports of strong anthropogenic pollution in Svalbard, including metal pollution, are those by Heintzenberg and others (Reference Heintzenberg, Hansson and Lannefors1981), Pacyna and others (Reference Pacyna, Vitols and Hanssen1984) and Yevseyev and Korzun (Reference Yevseyev and Korzun1985).
Bacterial deposition pattern
Bacterial cells present in the atmosphere act as effective nucleation sites becoming incorporated into the ice and snow crystals during its formation (Grannas Reference Grannas, Singh, Singh and Haritashya2011). These remain preserved first in the firn and then in the ice sheets over years, at low temperatures (Abyzov and others Reference Abyzov, Lipenkov, Bobin and Kudryashov1982; Abyzov Reference Abyzov and Friedmann1993; Elster and Benson Reference Elster, Benson, Fuller, Lane and Benson2004).
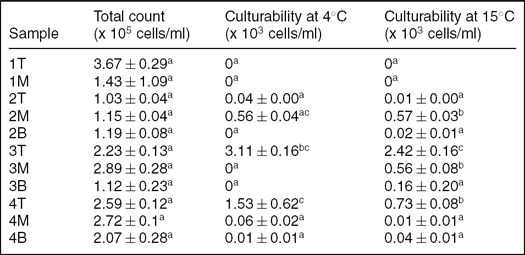
In the present study, depositional patterns of bacteria in the recent past were investigated through enumeration both by direct and culturable methods. The total bacterial counts in the samples tested varied from 1.03 × 10⁵ to 3.67 × 10⁵ per ml of meltwater, with the variation between the different layers statistically not significant (Table 2). These values were comparable to the total bacterial counts recorded in the Arctic sea ice (5.4 × 10⁴ to 2.4 × 10⁶ cells/ml) reported by Junge and others (Reference Junge, Imhoff, Staley and Deming2002), and radiation crust bacterial values (2 × 10⁵ cells/ml) reported by Amato and others (Reference Amato, Hennebelle, Magand, Sancelme, Delort, Barbante, Boutron and Ferrari2007) from nearby Kongsvegen glacier. At the end of the winter, during early spring Amato and others (Reference Amato, Hennebelle, Magand, Sancelme, Delort, Barbante, Boutron and Ferrari2007) however reported bacteria from the same glacier, lesser by a magnitude of 1 (6 × 10⁴ cells/ml).
Bacterial counts of the surface and sub-surface ice in the study area. Data in the same column followed by a different alphabet are significantly different according to the one-way ANOVA (P < 0.01).
Although data is limited from the Antarctic glacial ice cores, the total bacterial counts in the Arctic were to a large extent higher than in the Antarctic probably because of the difference in depth and persisting temperatures. Christner and others (Reference Christner, Royston–Bishop, Foreman, Arnold, Tranter, Welch, Lyons, Tsapin, Studinger and Priscu2006) in a much deeper (171–2567 m) ice core from Vostok reported as low as 3.4 × 101 to 3.8 × 10² cells/ml while Segawa and others (Reference Segawa, Ushida, Narita, Kanda and Kohshima2010) reported 6.5 × 10³ to 2.4 × 10⁴ cells/ml in ice cores from Enderby Land and Dronning Maud Land, east Antarctica.
The culturability of the bacterial cells in firn in comparison to the total count was very low. At 4°C the maximum culturability of the bacterial cells was <1.4%. At 15°C it was still lower (~1%) (Table 2). Similar observation of low culturability was also made by Gosink and others (Reference Gosink, Irgens and Staley1993) from Arctic fast ice near Barrow.
Conclusion
This work provides a clue to the presence of diverse groups of elements in the firn layers of glaciers lying in the remote regions of the world such as Svalbard. Calculation of the enrichment factors for the various elements suggests that for two of the samples studied, the source of elements such as Ba and Mn and to some extent the Ca, Co, Li, Mg, Ni and Sr, is from the earth crust. Deposition of elements such as Cd, Cu and Zn is through anthropogenic sources in all the samples tested. Elements such as B, Cr, Pb and V were close to non-detectable limits in most of the samples. Amongst the other natural sources, sea salt spray is significant in the present study as the sampling locations are only about a few km from the coast. Volcanoes and to a lesser extent forest fires may also add to the other natural sources of pollution. The wind currents prevailing in the Svalbard region probably carry elements from various anthropogenic sources from the mid-latitudes and deposit them in the remote regions in the Arctic. The snowfall in the region brings down the bacterial cells present in the atmosphere and preserves them in the firn and ice. Although these have high counts in situ, they exhibit low culturability on artificial media maintained at low temperature. In the future, to get a better insight of firn-core chemistry and bacteriology and to correlate the chemical data with environmental events, a more intense sampling and sub-sampling strategy together with firn-core dating has been planned.
Acknowledgments
We are grateful to Dr Shailesh Nayak, Secretary, Ministry of Earth Sciences, Government of India for encouragement and research facilities. We are also thankful to the Director, National Research Centre for Grapes, Pune, India for analytical facilities. The authors are grateful to the Norsk Polarinstitutt for providing a basic map at the time of sampling. This is NCAOR contribution no. 12/2013.