

1. Introduction
The landscape of wealth inequality in advanced capitalist societies has undergone a dramatic shift since the 1980s, sparking a surge in scholarly interest. This trend has led to a proliferation of academic inquiries into the political economy of assets, wealth inequality and the politics of redistribution, as extensively explored in the works of Fuller et al. (Reference Fuller, Johnston and Regan2020), Han and Kwon (Reference Han and Kwon2023a), Johnston and Regan (Reference Johnston and Regan2017) and Scheve and Stasavage (Reference Scheve and Stasavage2017). These studies have peeled back layers of complexity in understanding how wealth distribution interacts with political processes and outcomes, unveiling nuanced insights. Further enriching this discourse is the emerging research on private alternatives to the traditional welfare state. Scholars like Ansell (Reference Ansell2014, Reference Ansell2019), Busemeyer and Iversen (Reference Busemeyer and Iversen2020), Hacker and Rehm (Reference Hacker and Rehm2022) and Wiedemann (Reference Wiedemann2022a, Reference Wiedemann2023) have broadened the conversation to include how redistribution preferences are being reshaped in this new era. This evolving body of literature paints a vivid picture of the profound impact that fluctuations in asset values can have on individuals' socio-economic perspectives and behaviours. It is a vibrant and ever-expanding field that captures the pulse of our changing economic realities and their far-reaching political implications.
While the existing literature has shed light on the relationship between assets, housing and political preferences and behaviour, much of the research has focused on the individual or national levels. There remains a significant gap in our understanding of how housing wealth specifically influences political outcomes at more localized levels, such as the district level within a given country. The role of housing politics at the district level is a crucial intervening factor that has been understudied in the existing literature, but holds potential for explaining the dynamics between individual-level behaviour and national-level outcomes. It is within this context that this study aims to contribute by utilizing comprehensive data and employing multi-dimensional approaches to examine the intricate relationship between housing wealth and political outcomes in South Korea (hereafter Korea), which is one of few democracies in Asia. Han and Kwon (Reference Han and Kwon2023a) demonstrate that Korea possesses the distinctive features of a small welfare state, rendering it an intriguing subject for examination regarding the particularities and universality of its housing politics. By focusing on the specific level of analysis, this study seeks to provide a more nuanced understanding of the mechanisms through which housing wealth shapes political behaviour and outcomes within a specific country's regional context.
The present study aims to explore the relationship between housing wealth and political outcomes, particularly the rise in support for conservative party at the local level in response to increasing housing prices. To achieve this objective, the analysis is structured around three main components. Firstly, analysis 1 employs visualization techniques to provide an intuitive understanding of the association between housing wealth and political outcomes. Secondly, analysis 2 employs various algorithms to examine regional characteristics in relation to the proportion of conservative votes. Lastly, analysis 3 specifically investigates the influence of housing wealth on party preferences. This study utilizes visualization techniques, data-driven methods and causal inference techniques based on extensive data to provide a comprehensive understanding of the relationship between housing wealth and political outcomes.
The present study contributes to the strand of literature by adding novel evidence to the existing body of research on the politics of wealth and housing, complementing prior studies. While previous studies have examined the impact of housing wealth on political preferences at the individual or macro levels, this study offers compelling evidence on how this relationship operates at the local level. Consequently, the findings contribute to our understanding of the mechanisms underlying housing wealth politics, bridging the gap between individual-level behaviour and national-level outcomes.
The subsequent sections of this paper are structured as follows: Section 2 delves into the role of housing wealth in shaping political behaviour and its relevance within the Korean context. Section 3 outlines the methodology employed in this study and presents the obtained results. Finally, Section 4 concludes this research by summarizing the main findings, discussing their implications and suggesting avenues for future research.
2. Housing wealth and political preferences
The scholarly landscape of political economy and behaviour has long recognized several critical factors that influence individual preferences and decisions. Income levels and income inequality are central to this discourse, as highlighted by Meltzer and Richard (Reference Meltzer and Richard1981), along with labour market risks (Iversen and Soskice, 2001; Mares, Reference Mares2003; Rehm, Reference Rehm2011) and the vulnerabilities associated with unemployment and income loss (Rehm, Reference Rehm2016). However, in the evolving socio-economic environment, the significance of real estate assets and other forms of wealth in shaping an individual's permanent income has become increasingly prominent. Ansell (Reference Ansell2014) underscores the substantial impact of this wealth factor on political behaviour and policy preferences.
The escalation of wealth inequality has received increasing attention in academic circles, particularly with scholars such as Piketty (Reference Piketty2017, Reference Piketty2020) emphasizing its growing prominence in economic analysis. This trend, in conjunction with shifts in the labour market and welfare reforms, has intensified income and employment insecurity, profoundly influencing individuals' socio-economic perceptions and attitudes (Standing, Reference Standing1997; Viebrock and Slasen, Reference Viebrock and Slasen2009; Doling and Ronald, Reference Doling and Ronald2010; Caldbick et al., Reference Caldbick, Labonte, Mohindra and Ruckert2014). Kemeny (Reference Kemeny1992) and Ansell (Reference Ansell2014) further discuss the perception of homeownership as a conservative strategy and as an economic asset that embodies self-insurance, influencing attitudes towards wealth redistribution.
The role of housing and other real estate assets as a form of self-insurance against market economy uncertainties has become more pronounced in recent years (Scheve and Stasavage, Reference Scheve and Stasavage2017; Ansell, Reference Ansell2019; Busemeyer and Iversen, Reference Busemeyer and Iversen2020). The increasing importance of real estate in determining economic status, alongside the rise in wealth inequality, underscores the necessity of incorporating housing wealth in analyses to understand an individual's overall economic standing and life expectations. This shift has led scholars to increasingly examine the impact of wealth on policy preferences and political behaviour (Ansell, Reference Ansell2014, Reference Ansell2019; Johnston and Regan, Reference Johnston and Regan2017; Scheve and Stasavage, Reference Scheve and Stasavage2017; Larsen et al., Reference Larsen, Hjorth, Dinesen and Sonderskov2019; Busemeyer and Iversen, Reference Busemeyer and Iversen2020; Fuller et al., Reference Fuller, Johnston and Regan2020; Hacker and Rehm, Reference Hacker and Rehm2022; Hall and Yoder, Reference Hall and Yoder2022; Wiedemann, Reference Wiedemann2022a, Reference Wiedemann2022b, Reference Wiedemann2023; Han and Kwon, Reference Han and Kwon2023a).
Recent literature has expanded to explore the specific influence of local property values on political behaviour. Broxterman and Jin (Reference Broxterman and Jin2022) investigate how voters' behaviour in local elections is affected when policy differences across jurisdictions are reflected in property values. Their study provides a pioneering evaluation of the impact of a comprehensive government reform on property values and its subsequent effect on voters' support for the incumbent administration in a city. Similarly, Cifci et al. (Reference Cifci, Tidwell, Clements and Jauregui2023) find an association between house price performance and voting patterns at the county level. Their research indicates that superior house price performance preceding an election increases support for the incumbent party, while inferior performance leads to a shift towards the challenging party. This body of recent work emphasizes the need for further exploration into how local property values can influence voters' ideological leanings and party preferences, providing a nuanced understanding of the interplay between economic factors and political outcomes at the local level.
The relationship between income and welfare policy preferences in Korea has been a subject of considerable academic interest, with studies drawing on the classical class theory of Lipset and Rokhan (1967) and the Meltzer and Richard model (1981). Research by Lee (Reference Lee2002), Kim and Yeo (Reference Kim and Yeo2011) and Han (Reference Han2022a) suggests that income disparities have a relatively minor effect on individual welfare preferences. Contrary to expectations of class-based politics, these studies indicate that lower-income individuals in Korea do not consistently support redistribution or expanded welfare provisions. Instead, Korean welfare attitudes appear to be primarily influenced by ideological and age factors, a result of the country's unique historical experiences, including the Korean War (Steinberg and Shin, Reference Steinberg and Shin2006), periods of authoritarian prosperity (Joo, Reference Joo2017; Hong et al., Reference Hong, Park and Yang2022; Lee, Reference Lee2023), party system development and democratic experience (Jou, Reference Jou2011) and regionalism (Kwon, Reference Kwon2004). Nonetheless, an increasing body of research, including Lee and Kwon (Reference Lee and Kwon2009) and Kim et al. (Reference Kim, Ryu and Lee2013), acknowledges the growing importance of income as a determinant of welfare attitudes. This trend is particularly evident in studies like that of Yeo and Kim (Reference Yeo and Kim2015), who found that since 2010, income has become a more prominent factor in shaping welfare attitudes in Korea. This change aligns with the evolution of the welfare system and the increasing prominence of welfare politics in the context of a relatively modest welfare state (Yang, Reference Yang2017; Lim, Reference Lim2018). This evolution suggests the emergence of income-based class politics in Korea.
However, when examining the relationship between income and political party preferences, the impact of income appears limited. Kang (Reference Kang2008) and Lee (Reference Lee2015) found that income alone does not adequately explain party choices in Korea. More recently, further analysis of election data from 2004 to 2014 reveals class-based political dynamics related to income, yet these are overshadowed by the more significant influences of regional and generational factors (Lee and You, Reference Lee and You2019). This indicates a complex interplay of economic, regional and generational influences in shaping political preferences in Korea, with income being a factor but not the predominant one.
Since the 1997 Asian Financial Crisis, the Korean economy has experienced a notable shift, with lower flow elements like assets and capital becoming increasingly significant compared to higher flow aspects such as wages and income, as highlighted in studies by Oh (Reference Oh2020) and Shin and Jang (Reference Shin and Jang2011). This transformation has been accompanied by a rise in economic inequality and polarization. A key factor in this development, as identified by Oh (Reference Oh2020), is the inflation in asset prices, especially in the real estate sector. Concurrently, Keum and Cho (Reference Keum and Cho2001) and Lee and Yang (Reference Lee and Yang2018) have observed an increase in labour market insecurity post-crisis. The consequences of these economic shifts are evident in the data presented in Appendix B of the referenced studies. Figure B1, for instance, shows a consistent upward trajectory in wealth inequality within Korea, signifying a steady increase over time. Additionally, Figure B2 in the same appendix depicts a rise in the ratio of net wealth to net income, further illustrating the growing economic disparities.
These trends have sparked an interest among scholars to explore the interconnections between wealth, social policy preferences and political behaviour in the Korean context. The evolving economic landscape, marked by increasing asset value and labour market challenges, has become a crucial aspect of study to understand the broader socio-economic and political dynamics in Korea following the financial crisis of 1997.
Prior research in the field of political economy has predominantly examined the individual-level impact of housing assets on social policy preferences in Korea, as evidenced by studies from Kim and Kwon (Reference Kim and Kwon2017), Lee et al. (Reference Lee, Hwang and Lim2018) and Yang (Reference Yang2022; Yang and Kim, Reference Yang and Kim2022). However, Han and Kwon (Reference Han and Kwon2023a) have extended this inquiry by providing a unique perspective through their analysis of the Korean context. Their research reveals that asset ownership and house prices significantly influence individuals' perceptions of distributive fairness and belief in meritocracy. Crucially, Han and Kwon (Reference Han and Kwon2023a)'s study expands its implications beyond the confines of Korea. By employing a cross-national survey, their research demonstrates that the patterns observed in Korea regarding the impact of homeownership and rising house prices on social policy preferences and perceptions of socio-economic structures are not isolated phenomena but have broader applicability across various countries and regions.
In a related vein, Ansell's (Reference Ansell2014) work provides further insight into this area. His findings suggest an association between shifts in house prices and the adoption of more right-wing ideological views. This indicates a broader trend wherein economic factors, particularly those related to housing markets, exert a significant influence on political ideologies and policy preferences. These studies collectively contribute to a more nuanced understanding of the complex interplay between economic assets and political attitudes on a global scale.
To reiterate, it is worth emphasizing that housing wealth exerts a substantial influence on how individuals perceive the social structure, shapes their preferences for welfare policies and shapes their political ideology. Housing wealth can significantly impact individuals' perspectives on their socio-economic standing and their place within the broader social fabric. Furthermore, these factors play a crucial role in shaping individuals' preferences for various social welfare policies, as they directly affect individuals' material and financial interests tied to their housing assets. Moreover, the influence of housing wealth extends beyond economic considerations and spills over into the realm of political ideology. The housing market's dynamics can shape individuals' ideological leanings and political affiliations, as they become attuned to the implications of housing policies and their impact on their personal economic well-being. The perceived fairness of housing policies and the distributional effects of housing wealth can shape individuals' support for specific political ideologies and parties that align with their housing-related interests.
The examination of the relationship between housing wealth and political preferences takes on an added dimension when considering the political geography of regions. Urbanization and regional stratification have led to the formation of distinct socio-economic clusters, as noted in Han's (Reference Han2022b) study. This development necessitates a closer look at how housing wealth impacts political outcomes at a regional level. Recent scholarly works, including those by Han and Kwon (Reference Han and Kwon2023b) and Szewczyk and Crowder-Meyer (Reference Szewczyk and Crowder-Meyer2022), underscore the importance of analysing the influence of economic structures on political behaviour within specific districts.
At the district level, housing wealth exerts a notable influence on political attitudes, a phenomenon driven by observable characteristics related to housing that are evident to residents. Studies by Condon and Wichowsky (Reference Condon and Wichowsky2020), Fraile and Pardos-Prado (Reference Fraile and Pardos-Prado2014) and Han and Kwon (Reference Han and Kwon2023b) provide empirical evidence that mass political behaviour is significantly influenced by perceptions of economic structures in individuals' living environments. Although individuals may lack detailed knowledge of their exact housing wealth, their perceptions are nonetheless shaped by local housing conditions and the overall dynamics of the housing market, as described by Ansell (Reference Ansell2014) and Ansell et al. (2022).
By analysing housing wealth at the district level, researchers can uncover the unique factors influencing political attitudes within specific geographical contexts. The visible signs of housing wealth in local neighbourhoods play a critical role in the relationship between housing wealth and political outcomes. This approach to studying housing wealth at the regional level offers a more detailed understanding of how regional contexts and housing market dynamics collectively impact political behaviour.
Overall, the intricate relationship between housing wealth and individuals' perceptions of social structure carries significant implications for their political preferences and ideological orientations. Housing wealth serves as a concrete indicator of socio-economic status and economic prosperity in the contemporary era, influencing individuals' self-placement within the social hierarchy and, consequently, shaping their political beliefs and values. This association becomes especially pertinent when examined within a regional framework.
In light of this, the present study proposes a hypothesis that an increase in housing wealth at the district level is associated with a heightened preference for conservative parties. This hypothesis is grounded in the notion that as housing wealth escalates within a particular district, the residents of that district are more inclined to adopt conservative political ideologies and demonstrate support for conservative parties. This association suggests a direct link between the economic conditions of a region, as reflected through housing wealth, and the political leanings of its residents. The hypothesis aims to explore this linkage, offering insights into how economic factors, particularly housing wealth, can influence political landscapes at a regional level.
2.1 Housing wealth in the Korean context
The statement ‘We've built this for those who've always dreamt of an unequal world’ from a controversial 2023 apartment advertisement in Banpo-dong, Seocho-gu, Seoul, Korea, encapsulates the societal significance of real estate, apartments, Seoul (Capital city of Korea) and Gangnam in Korean society (The Korea Herald, 2023). This statement reflects the promotional portrayal of Korean society's fervent aspiration to reside in a Gangnam apartment and explicit classism, highlighting the prevalent societal preference for this esteemed residential area.
The symbolic significance of geographical spaces in Korean society is a vivid illustration of how real estate can reflect and reinforce social identities, statuses and economic classes. This phenomenon is particularly pronounced in the dichotomies of the capital metropolitan region versus rural provinces, in-Seoul versus out-of-Seoul, and the affluent Gangnam district versus the less affluent Gangbuk in Seoul (Ha, Reference Ha2002; Yang, Reference Yang2018; Han, Reference Han2022b). The terms ‘republic of real estate’ or ‘republic of apartment’ (Park Reference Park2022) highlight the central role of real estate in the Korean social fabric.
This unique interplay between real estate and social dynamics in Korea has roots in the cultural heritage of East Asia's agrarian societies, which were heavily reliant on rice farming (Talhelm et al., Reference Talhelm, Zhang, Oishi, Duan, Lan and Kitayama2014), as well as the transformative real estate boom during Gangnam's development in the 1970s and 1980s (Yang, Reference Yang2018). While these factors may be distinct to Korea, they offer valuable insights for comparative politics. The Korean case serves as a compelling example to examine how historical, cultural and economic trajectories can shape the relationship between real estate and political behaviour. By drawing parallels and contrasts with other countries, this case can contribute to a broader understanding of the varied ways in which real estate intersects with political ideologies and preferences in different socio-political contexts.
Real estate in Korean society, especially since the 1970s, has emerged as a critical symbolic marker of social class distinctions, offering exclusive opportunities based on residential location (Hong, Reference Hong1992; Yoon, Reference Yoon1995; Sohn and Oh, Reference Sohn and Oh2019; Han, Reference Han2022b). The significance of an apartment's spatial location, brand and price is particularly salient, playing a crucial role in reinforcing social class differentiations and highlighting the hierarchical structure of Korean society (Kang and Seo, Reference Kang and Seo2022; Park, Reference Park2022). Notably, as of 2022, apartments (APT) represent a substantial 63.5% of all residential properties in Korea, underscoring their vital role in shaping the socio-economic landscape.
Apartments in Korea have transcended their functional role as mere shelters, becoming significant symbols of social status, wealth and aspiration. They serve as concrete indicators of an individual's socio-economic position and aspirations for social mobility. This phenomenon reflects the deep entrenchment of apartments as a primary and iconic housing form within the fabric of Korean society, embodying meanings that extend far beyond their physical utility. This study delves into the multifaceted role of apartments in Korea, exploring their impact as both physical dwellings and powerful social symbols.
In Figure 1, the disparity in apartment prices across different regions has exhibited a notable increase over time, as depicted. Figure 1(a) illustrates the changes in average price of APT/m2 from 2013 to 2023, considering national, Seoul, Gangnam 3-gu (Seocho-gu, Gangnam-gu and Songpa-gu), metropolitan cities and other regions. It is evident that the gap between Seoul and the rest of the country has been progressively widening since 2016, with a particular emphasis on the widening gap between Gangnam 3-gu and other regions. Based on the analyses conducted by Oh (Reference Oh2020) and Kim et al. (Reference Kim, Han and Ro2020), it has been determined that housing price polarization in Seoul is significantly more pronounced compared to other regions. This trend underscores the growing divergence in apartment prices between the affluent Gangnam districts and other areas in Korea.
Changes and differences in average price of APT/m2.
Note: (1) All data are based on January of the respective year. (2) In panel (b), Sejong's data are based on 2013 and 2023. (3) In panel (b), the numbers in the panel refer to the difference in values between the two years.
Source: KB real estate data hub (https://data.kbland.kr/).

In Figure 1(b), the focus shifts to examining the change in average price of APT/m2 between 2009 and 2023 in Seoul, Metropolitan cities and provinces. While the average apartment prices have experienced an upward trajectory across all regions, a distinct pattern emerges as the increase is particularly prominent in Seoul compared to other regions. This finding suggests that the surge in apartment prices has been more pronounced in the capital city, highlighting the intensified nature of price growth in Seoul relative to other parts of the country.
The analysis of Figure 1 reveals escalating disparities in apartment prices across various regions, highlighting the diverging trends between Seoul and other areas, as well as the notable price variations within Seoul itself. These trends indicate a significant transformation in Korea's real estate market. Such disparities not only reflect socio-economic divides but also have implications for social dynamics and political outcomes. Within the framework of performance-based retrospective voting, Shin (Reference Shin2018) found that individual wealth had a negligible impact on the 2016 election results. However, the substantial rise in real estate values post-2016 suggests a shifting dynamic, where real estate wealth may increasingly influence the outcomes of more recent elections.
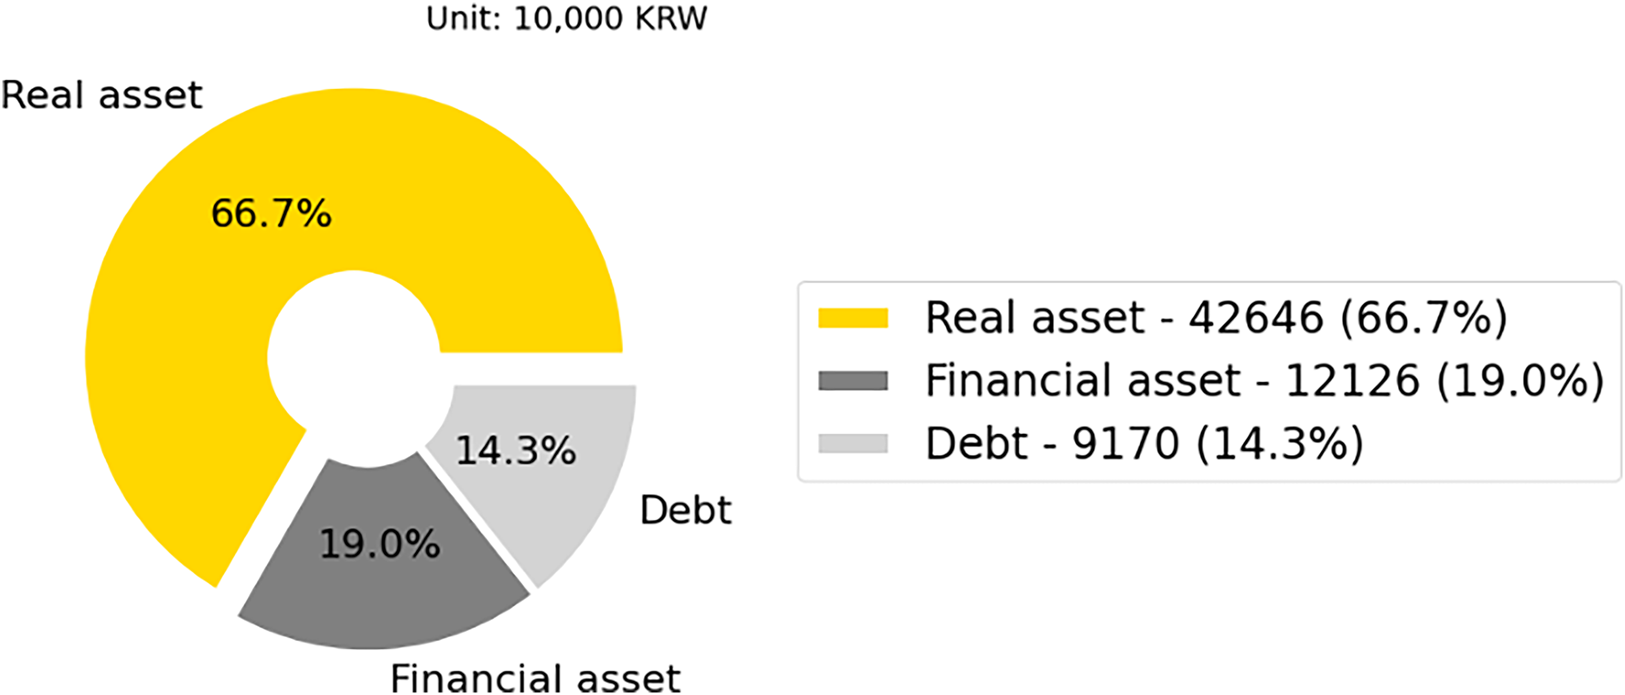
Figure 2 presents the composition of household's assets, revealing a significant proportion allocated to real assets in Korean society. This figure shows the average value of a household's real assets, financial assets and debt. From a statistical perspective, approximately 66.7% of an individual's assets in Korean society consist of real assets, such as real estate, while financial assets account for 19% of the total. This proportion of real assets is notably higher compared to other OECD countries (OECD/Eurostat, 2015). Consequently, it can be inferred that Koreans allocate a substantial portion of their wealth towards real estate, with housing representing the predominant form of real asset that most households possess or have the means to acquire.
Composition of household assets in 2022.
Source: K⋅indicator (https://www.index.go.kr/unify/idx-info.do?idxCd=8087).

These data underscore the unique characteristics of the Korean economy and society, where real estate holds significant value and occupies a prominent position in the asset portfolios of individuals. The preference for real estate as a means of wealth accumulation and investment is deeply ingrained in the cultural and economic fabric of Korean society. It reflects a historical trend that has persisted over time, influenced by factors such as the cultural significance attached to homeownership, the role of real estate as a status symbol and the perceived stability and potential returns offered by the real estate market. Besides, according to Figure B3, social spending in Korea is notably lower compared to other OECD countries. Within the context of Korea's small welfare state (Yang, Reference Yang2017), the importance of housing as a form of private insurance may assume a more prominent role in Korean society.
The prevalence of real assets, particularly housing, in the asset structure of Korean households has far-reaching implications. It highlights the importance of housing as a cornerstone of wealth and financial security for many Koreans. Additionally, it underscores the potential impact of fluctuations in the real estate market on the overall economic well-being and financial resilience of individuals and households in Korea.
In summation, the Korean context in this subsection highlights two key aspects: the symbolic significance of real estate, particularly apartments, in Korean society, and the growing regional disparities associated with real estate. Firstly, statistically, Koreans allocate more than 60% of their personal wealth to real assets, primarily in the form of real estate. Additionally, more than 60% of the population resides in apartments. These figures highlight the pervasive influence of real estate, particularly apartments, in shaping the lives and socio-economic status of individuals in Korean society.
Secondly, the regional disparities in real estate prices within Korea, both between Seoul and other regions and within Seoul itself, have exhibited a consistent and substantial increase. The widening gap in apartment prices between Seoul and the rest of the country reflects the growing divide in terms of housing affordability, market dynamics and socio-economic opportunities. Similarly, within Seoul, the disparity in apartment prices across different regions highlights the varying levels of accessibility and desirability associated with specific areas. These trends indicate a significant shift in the real estate landscape, with profound implications for social stratification, social dynamics and political consequences in Korea.
Understanding the symbolic significance of apartments and acknowledging the widening regional disparities in apartment prices are crucial for comprehending the dynamics of the Korean context. These factors shape not only the socio-economic landscape but also the social fabric and individual experiences within Korean society, emphasizing the central role of real estate as a driver of wealth, social status and spatial differentiation.
3. Methods and estimation assessments
In this section, the intricacies of the data utilized, the methodologies adopted for each analytical approach and the ensuing results that form the cornerstone of the study are explored in depth. Initially, the primary datasets that underpin the analysis are outlined, offering a detailed characterization of these key elements. A distinctive feature of this study is the utilization of a consistent set of variables across three separate but interconnected analyses, each augmented with additional variables specific to their respective investigative aims. These additional variables are detailed within individual subsections, ensuring a thorough understanding of their application and relevance. The research methodology is grounded in a combination of advanced visualization techniques, data-driven descriptive analysis and causal analysis approaches. This methodological framework is meticulously designed to construct a multi-layered foundation for the assertions presented in our study. By integrating these approaches, this study aims to provide a comprehensive understanding of the phenomena under investigation.
The first analysis employs sophisticated visualization techniques, leveraging the power of data to intuitively reveal the relationship between housing wealth and political outcomes. This visual exploration serves not only to elucidate complex patterns and trends but also to make the data more accessible and comprehensible. In the second analysis, this study employs multiple algorithms to investigate regional characteristics that play a role in differentiating the target regions under study. This algorithmic strategy facilitates a detailed exploration of regional dynamics, revealing patterns and insights that might remain obscured in conventional analysis methods. The third analysis focuses specifically on the influence of housing wealth on party preferences. This segment of our study is critical in understanding the deeper, perhaps more subtle, impacts of economic factors on political leanings and decisions.
Each of these three analyses represents a multifaceted and strategic approach, meticulously crafted to address and mitigate the limitations inherent in the underlying data. This structured approach is designed to build a case progressively, each stage reinforcing the study's claims. By adopting this multi-pronged analytical strategy, this study enhances the robustness and reliability of the findings, ensuring that they are not only insightful but also stand up to rigorous scrutiny. The methodologies for each analysis are elaborately described within their respective subsections, providing clarity on the processes and techniques employed. The algorithmic analysis and visualizations utilized in this study are based on the Python language, while STATA software is used for causal inferences.
3.1 Data
This study employs multi-dimensional approaches to investigate the influence of housing wealth on regional characteristics and its specific association with conservative party preference, utilizing comprehensive data. Through the analysis of data that captures human behaviours and interactions, such as relationship formation (Monroe et al., Reference Monroe, Pan, Roberts, Sen and Sinclair2015), the present study aims to discern distinctive patterns within the datasets that encompass various complex features. These patterns will serve as empirical evidence to support the study's thesis.
An essential consideration for both data-driven descriptive analysis and causal analysis is the selection of indicators that align with the study's objectives. Therefore, when collecting data, it is crucial to possess a comprehensive understanding of the society from which the data are being gathered, particularly the socio-economic characteristics relevant to party preferences at the district (si-gun-gu) level.
The outcome variable in the district-level analysis pertains to the voting patterns exhibited towards conservative political party. It is constructed as the percentage of votes received by President Yoon Suk Yeol, the candidate from the conservative People Power Party, in each of the 250 si-gun-gu during the 2022 presidential election. For comparative analysis, the study also includes the percentage of votes obtained by the Democratic Party candidate, Lee Jae-myung. While Korea has a multi-party system, the presidential elections have been primarily dominated by two major political parties since the democratization process in the 1990s. Notably, in the 2022 presidential election, the candidates representing the two primary political parties garnered an overwhelming majority, accounting for around 97% of the total votes cast. These parties were initially known as the Democratic Liberal Party and the Democratic Party during the 13th National Assembly in the early 1990s. Over time, they have undergone name changes, as well as divisions and mergers, and are currently referred to as the People Power Party and the Democratic Party of Korea in the 21st assembly. Nonetheless, these two major political parties have remained fundamentally the same throughout this period, and thus, this study uses the terms People Power Party (PPP) and Democratic Party (DP) to refer to them.
In this analysis, a number of district-level variables are included to assess housing wealth and its political implications. To measure housing wealth, we introduce the average price per square meter of apartments (APT), a term that, in the Korean context, encompasses both traditional apartments and condominiums. As of 2022, apartments constitute about 63.5% of all residential properties in Korea, highlighting their significance in the housing market. This is particularly evident in urban areas such as Seoul, where apartments make up approximately 59.5% of residential spaces, and in Sejong City, where they account for 86.4%. The housing wealth data utilized in this study, sourced from Kookmin Bank Real Estate since 2022, represent the most comprehensive dataset available, focusing on district-level apartment prices, which reflect an active market characterized by frequent citizen transactions. However, it is noteworthy that data on other housing types, like detached houses and multiplex houses, are not as readily accessible. To account for this potential bias, the analysis incorporates the proportion of apartments in various housing types as a control variable at the district level. It is important to acknowledge that the dataset does not encompass 11 islands and mountainous regions with infrequent apartment transactions, such as Ulleung-gun and Sinan-gun.
Additionally, the homeownership ratio is employed as a control variable, calculated by dividing the number of households owning their homes by the total number of households. This ratio is pivotal as a control in analysing contemporary political preferences, as homeownership has been identified as a significant factor influencing such preferences (Ansell, Reference Ansell2014). Another control variable considered is voter turnout, defined as the percentage of eligible voters in a district who participate in elections. Voter turnout has been recognized as a critical element in shaping election outcomes in Korean politics (Lee and Hwang, Reference Lee and Hwang2012), and its inclusion in this study allows for a more nuanced understanding of the interplay between housing wealth and political behaviour.
At the district level, this study incorporates Sex and Education variables as they have the potential to influence political outcomes in Korea (Han and Kwon, Reference Han and Kwon2023b). The sex variable is computed as the ratio of the male population to the female population within a district, while the education ratio represents the ratio of individuals with higher education (four-year university or higher) to those with a two-year college education or lower. Additionally, the average age of district residents, denoted as the average age variable, and Urbanization, which indicates the percentage of the district population residing in urban areas, are included as they can also potentially influence political outcomes (Han and Kwon, Reference Han and Kwon2023b).
In addition, several region dummy variables are included. The Yeongnam region has traditionally served as the political stronghold of PPP, while the Honam region has been the base for DP (Lee and Brunn, Reference Lee and Brunn1996; Kwon, Reference Kwon2004; Moon, Reference Moon2005). Thus, five region dummy variables are incorporated, namely Seoul Metropolitan (Seoul, Incheon and Gyeonggi-do), Honam, Yeongnam, Gangwon and Chungcheong areas. The region of Sejong City, established in 2012 as the administrative capital in the Chungcheong area, is used as the reference group in analysis 3. Sejong City exhibits mixed regional characteristics due to its purpose of promoting balanced national development (Kwon, Reference Kwon2015). See Table 1 for the list of variables. Tables A1 and A2 provide detailed information on data and summary statistics of all the variables, respectively.
List of variables

3.2 Analysis 1
Analysis 1 of the current study employs visualization techniques to intuitively explore the connection between housing wealth and political outcomes at the district level. Figures 3(a) and 3(b) illustrate the voting percentages obtained by PPP and DP, respectively, in the 2022 presidential election. Larger values are denoted by darker colours, and vice versa. The data presented in Figure 3(a) reveal a higher proportion of votes in favour of PPP in the Youngnam region, which is situated in the southeastern part of the country. In contrast, Figure 3(b) demonstrates a greater percentage of votes for DP in the Honam region, encompassing the southwest. These findings align with the regional political orientation discussed in the previous subsection for data. Furthermore, it is evident that apartment prices display higher values in the metropolitan areas, as well as in certain major cities within the provinces. This observation is consistent with the typical characteristics of urban centres, where there is usually a higher demand for housing, leading to increased apartment prices.
Votes, APT price, income and wealth in 2022. (a) Conservative vote proportion. (b) Democratic vote proportion. (c) APT price/m2. (d) Income and wealth.

Figure 3(d) presents additional information on average income and wealth, based on the national health insurance premium. It is important to note that both subscription and payment for national health insurance in Korea are obligatory for all citizens, as determined by the mandatory designation system (Heo et al., Reference Heo, Jeong, Lee and Seo2021). As of 2022, approximately 51 million Koreans were insured, indicating that at least 97% of the total population are subscribers (Health Insurance Review & Assessment Service and National Health Insurance Service, 2022). The national health insurance premiums are determined based on an individual's income and wealth. Although this may not directly refer to housing wealth, its significance can be understood in the context of the importance of real estate and housing in the Korean context, as mentioned in the previous section. Indirectly, this variable can be seen as reflecting housing wealth.
Figures 3(c) and 3(d) exhibit a notable similarity in terms of the economic pattern they represent. That is, the findings from Figures 3(c) and 3(d) collectively suggest a correlation between the average price of APT/m2 and individual income/wealth. This supports the notion that regions with expensive APT tend to have individuals with higher financial resources, as reflected in the figures.
In Figure 4(a), this examination with the component plot primarily focuses on the average price of apartments per square meter, while also controlling for various factors including APT ratio, homeownership, education level, mean age, sex ratio, urbanization and voter turnout. This approach aims to provide a preliminary understanding of the interplay between these variables and Conservative vote proportion in the 2022 election. The component plot using 2022 data, which highlights the partial relationship between the average price of APT/m2 and Conservative vote proportion by controlling for other variables, reveals a notable upward trend. This indicates a positive association, suggesting that areas with the higher price tend to exhibit higher Conservative vote proportion. This trend is further corroborated by the component plus residual plot, which adds another layer of analysis by including residuals – the differences between the observed and predicted values in Figure 4(b). The continuation of this upward trend, even after adjusting for residuals, emphasizes the robustness of the positive association between them. Additionally, for a more direct and intuitive perspective on the relationship between the average price of apartments per square meter and Conservative vote proportion, a simple linear regression is conducted. The resulting regression line, accompanied by a 95% confidence interval, also displays an upward trend, aligning with the findings from the multiple regression analysis. Overall, it offers valuable insights into the association between housing wealth and conservative party preferences, indicating a positive relationship between the two factors.
Average price of APT/m2 and Conservative votes in 2022. (a) Component plot. (b) Component plus residual plot.

However, when considering all si-gun-gu (districts) in Figure 4, the relationship between the average price of APT/m2 and the Conservative vote proportion becomes less clear. The observed data points display notable variance, especially within the segment of lower-priced apartments. This variation can be attributed to the influence of regional characteristics on political party preferences within Korea, with a particular emphasis on the Youngnam and Honam regions. This regional influence, as detailed in the data subsection, plays a significant role in shaping political preferences, a phenomenon that is clearly illustrated in Figures 3(a) and 3(b).
To gain deeper insights, this study conducts a more comprehensive analysis focusing specifically on Seoul which has 25 districts. Seoul is chosen due to its relatively diminished impact of regional characteristics and its distinct socio-economic traits (Han, Reference Han2022b), which enables a clearer examination of the relationship between housing wealth and political preferences. Besides, as of 2022, Seoul's population is about 9.8 million, accounting for about 18.8% of the total population of Korea. As discussed in the previous Korean context, in Korean society, Gangnam and Gangbuk districts in Seoul reflect individuals' identities, socio-economic statuses and social classes (Yang, Reference Yang2018; Han, Reference Han2022b). These regional socio-economic characteristics strongly influence behaviours encompassing political and economic behaviour (Yang, Reference Yang2018; Bae and Joo, Reference Bae and Joo2020; Han and Lee, Reference Han and Lee2022).
In Figures 5(a) and 5(b), there is a notable contrast compared to Figure 4, as the difference in the percentage of votes between PPP and DP becomes more evident. Specifically, within the three Gangnam districts (Gangnam-gu, Seocho-gu and Songpa-gu) located in the southern part of Seoul, PPP candidate received a higher percentage of votes compared to other districts, whereas DP candidate garnered a higher percentage of votes in other districts. Figures 5(c) and 5(d) display similar characteristics and reinforce the notion that high apartment prices are strongly correlated with income and wealth. Once again, this indicates a significant correlation between housing wealth and income and wealth. Notably, this association becomes clearer when the analysis is limited to Seoul compared to the national level.
Votes, APT price, income and wealth (district unit, Seoul) in 2022. (c) Conservative vote proportion. (b) Democratic vote proportion. (c) APT price/m2. (d) Income and wealth.

The component plot and component plus residual plot in Figure 6 present a well-defined relationship between the average price of APT/m2 and the proportion of Conservative votes. The data points exhibit a clear pattern that highlights the relationship between these two variables. The figure provides a more precise and evident representation of the relationship, allowing for a clearer understanding of the association between housing prices and conservative voting patterns. The data points likely exhibit a more pronounced trend, showing a consistent increase in the proportion of conservative votes as the average price of APT/m2 rises. This observation reinforces the notion that housing wealth, as reflected in higher apartment prices, is closely linked to preferences for conservative party. Overall, the distinct patterns observed in Seoul highlight the importance of regional context and socio-economic factors in influencing political dynamics and housing trends.
Average price of APT/m2 and Conservative votes (Seoul) in 2022. (a) Component plot. (b) component plus residual plot.

Figures 7(a) and 7(b) provide a breakdown of the vote share between the candidates representing PPP and DP at the dong-unit level (424 observations), which is the smallest administrative unit in Korea. This level of analysis allows for a more detailed examination of the differences in vote share between the two parties' candidates in Seoul. Similar to the findings in Figure 5, it is apparent that PPP's candidate garnered a higher proportion of votes in Gangnam-3gu, the southeastern part of Seoul, compared to other regions. Conversely, DP's candidate received a higher proportion of votes in the remaining areas of the city compared to Gangnam-3gu.
Votes, average price of APT/m2, income and wealth (dong unit, Seoul) in 2022. (a) Conservative vote proportion. (b) Democratic vote proportion. (c) APT price/m2. (d) Ave. price of APT/m2 and cons. vote.
Note: Income and wealth data based on health insurance premium are not available in dong unit.

To further explore the relationship between the vote share and housing wealth, Figure 7(c) displays the average price of APT/m2 in different areas of Seoul. Notably, there is a consistent pattern where apartments are generally more expensive in Gangnam-3gu, aligning with the distribution of conservative votes observed in Figure 7(a). Seeing Figure 7(d), we can find a strong positive correlation between the two variables. This implies that at the national level, district level in Seoul and dong-unit level in Seoul, the higher apartment prices correspond to a greater vote share for the conservative candidate. Overall, these findings highlight a consistent and positive association between apartment prices and political preferences in Korean society. The specific areas with higher housing prices tend to exhibit a stronger inclination towards the candidate of conservative party.
In summation, the analysis presented in Figures 3–7 offers insightful revelations about the link between housing wealth and party preferences, both within the broader context of Korean society and more specifically in Seoul. These figures illustrate a discernible correlation between housing wealth and party preferences, laying the groundwork for more in-depth exploration in the later sections of this study. The findings gleaned from these figures suggest a potential causal relationship between an individual's housing wealth and their political leanings. While the use of visualization techniques in this context does not establish a definitive causal relationship, it does provide an intuitive representation of the connection between housing wealth and political preferences. This preliminary observation serves as a stepping stone for a more detailed investigation in the following subsections. The aim is to delve deeper into this observed relationship, scrutinizing and analysing it with greater specificity. Through this extensive analysis, this study endeavours to uncover a more layered and nuanced understanding of how housing wealth influences party preferences. This approach is predicated on the belief that a comprehensive exploration will yield a richer and more detailed comprehension of this complex interplay.
3.3 Analysis 2
The second analysis in this study aims to clarify the importance of housing wealth within a range of regional characteristic variables, with the goal of intuitively understanding its role in distinguishing the target regions being analysed. This analysis utilizes a data-driven approach to categorize si-gun-gu regions and interpret the findings.
This methodology integrates the use of the Principal Component Analysis (PCA) algorithm, clustering algorithms, Shapley Additive exPlanations (SHAP) and visualization techniques, with the aim of dissecting the intricate interplay between diverse regional attributes. To begin with, the utilization of PCA in this context extends beyond mere data compression; it involves extracting latent attributes of variables to reveal underlying factors that more effectively explicate the data via dimensionality reduction. This perspective aligns with scholarly insights by Gniazdowski (Reference Gniazdowski2017) and Hastie et al. (Reference Hastie, Tibshirani and Friedman2009). PCA encompasses the computation of the covariance matrix from standardized data, the derivation of eigenvectors and eigenvalues from this matrix and the selection of a subset of these eigenvectors to form a projection matrix. This matrix then transforms the data into a space with reduced dimensions. Essentially, by opting for a fewer number of principal components, the dimensionality of the dataset is condensed while still retaining its most pivotal information.
To enhance the clustering efficiency and mitigate potential noise arising from high variable correlation, a strategy is employed in this study to extract a single principal component (PC) from regional features, specifically the average price of APT/m2. The extraction of this PC facilitates more effective clustering by reducing the presence of unnecessary noise within the data. Efficient clustering becomes less attainable when the data contain excessive noise. Consequently, it becomes imperative to derive new variables that capture potential factors capable of providing the most accurate explanation of the data distribution. Moreover, this approach of dimensionality reduction through PC extraction offers the advantage of visually and intuitively interpretable outcomes, as it enables the reduction of complex multi-dimensional data.
Furthermore, the K-means++ algorithm, an extension of the K-means clustering algorithm, is employed in this study. K-means++ shares the same fundamental principles as K-means but differs in its approach to cluster centroid initialization (Arthur and Vassilvitskii, Reference Arthur and Vassilvitskii2007; Hastie et al., Reference Hastie, Tibshirani and Friedman2009). K-means, an unsupervised learning method, begins by selecting a cluster centroid and assigning data points closest to that centroid based on the Euclidean distance (Hastie et al., Reference Hastie, Tibshirani and Friedman2009). K-means++ (or K-means) has been extensively applied in clustering analysis utilizing socio-economic characteristics of various groups (e.g., Henning and Liao, Reference Henning and Liao2013; Walker and Crotty, Reference Walker and Crotty2015; Exeter et al., Reference Exeter, Feng, Zhao, Gavadino and Norman2019; Siqueira-Gay et al., Reference Siqueira-Gay, Giannotti and Sester2019).
In this study, the silhouette score is employed to estimate the optimal number of clusters (K) and optimize the K-means++ algorithm (Kaufman and Rousseeuw, Reference Kaufman and Rousseeuw1990). Efficient clustering is indicated by sufficiently large distances between different clusters and closer proximity of data points within the same cluster. The silhouette plot is utilized as a visual tool to assess parameters such as the number of clusters, providing a concise and intuitive representation of the measured values depicting the closeness of each data point in one cluster to data points in adjacent clusters.
Additionally, the utilization of visualization approaches enables a comprehensive analysis of the data structure, facilitating the identification of structural patterns in housing wealth amidst multifaceted regional characteristics. These visual analyses play a crucial role in gaining valuable insights into the nature and distribution of the data. By visually exploring the data, we can uncover intricate relationships, trends and patterns that might not be apparent through numerical analysis alone. This comprehensive approach aids in deepening the understanding of the complex interplay between housing wealth and various regional factors, contributing to a more nuanced interpretation of the research findings.
The PCA and clustering results in this study are analysed through a four-step process: (1) evaluating the PCA results, (2) determining the number of clusters, (3) identifying the optimal clustering and examining the structure of the results and (4) conducting a comprehensive analysis. Figure 8(a) shows the correlation between the variables. The complex relationships between these variables are condensed by PCA into principles that best reflect their essential characteristics. Figure 8(b) presents the PCA results for the regional characteristic variables. To address the potential disparities in values between variables due to their differing units, a Min-Max standardization technique is applied. This standardization process scales the values of each variable to a common range of 0–1, ensuring that they are transformed into the same unit of measurement. This normalization procedure aims to mitigate the potential impact of varying scales on the results of the PCA. By standardizing the variables, the PCA can effectively capture the relative importance and relationships among them in a more equitable manner.
Correlation between variables and PCA results. (a) Correlation between variables. (b) PCA results.

According to the findings displayed in Figure 8(b), PC1 represents a newly derived variable that accounts for an impressive 99.7% of the data distribution from 14 variables on its own. This dimension, obtained through the reduction of variables, effectively explains approximately 99% of the data distribution.
Figure 9 displays the clustering results and silhouette scores. The x-axis represents PC1, which indicates regional characteristics, while the y-axis represents conservative vote shares. This figure provides a visual depiction of how the silhouette score and its shape evolve as the number of clusters (K) increases. Upon examination, it is evident that the highest silhouette score of 0.7421 is achieved when dividing the data into two clusters (K = 2). However, as K increases to three (0.5458), four (0.5532), five (0.6259) and six (0.6476), the silhouette score remains lower than that obtained when dividing the data into two clusters. This indicates a significant drop in the silhouette score when transitioning from K = 2 to K = 3, followed by a relatively stable level thereafter. In summary, the silhouette analysis reveals that dividing the data into two clusters yields the highest silhouette score, indicating better clustering cohesion and separation compared to using a higher number of clusters
K-means++ results and Silhouette scores.
Note: See Figure B5 in Appendix B for the hierarchical clustering results, which confirm the robustness of the K-means++ clustering outcomes.

Figure 10 delves into the influence of housing wealth on regional division by examining the structural patterns in data distribution. The analysis separates the group into two segments, cluster 0 and cluster 1, based on previous clustering results. It uses the conservative vote share as a common baseline variable on the y-axis, and the regional characteristic variables on the x-axis. This division aims to investigate the structure and distribution of the data, enabling a deeper understanding of the nuances in structural and distributional patterns. This investigation is essential for identifying the distinct characteristics of these groups, thereby illuminating the factors that influence the segmentation of regions. The analysis identifies the APT price per square meter as the most significant factor differentiating the two clusters. This distinction is particularly evident in the APT price variable, which effectively categorizes the groups according to their respective criteria. This discovery is crucial as it points to apartment prices as not just a contributing element, but as the key determinant in separating the groups. The marked distinction based on APT prices underscores their considerable influence on the segmentation of the regions being studied.
Data distribution of regional characteristics by cluster.

While other regional characteristics – such as socio-economic and demographic composition – are also considered, it becomes apparent that their impact on the division of the groups is relatively minor compared to that of apartment prices. These additional factors, though contributing to a comprehensive view of the regional political landscape, do not exhibit the same level of influence in segregating the clusters as the apartment price does. To reiterate, the analysis acknowledges the influence of various factors specific to each region. However, even these aspects, while important for a nuanced understanding, do not compare in their impact to that of apartment prices on the clustering of the regions.
Figure 11 presents a synthesis of the findings from this subsection. In Figure 11(a), the use of an optimized clustering technique effectively divides the overall population into two distinct groups. These groups are prominently separated along the horizontal axis, a visual testament to the distinct characteristics within the dataset. Figure 11(b) illustrates the application of APT price/m2 to the clustered data based on the results in Figure 11(a), uncovering a clearer demarcation between the two groups. This step is vital in highlighting the influence of APT prices in distinguishing between the groups.
Clustering results, data patterns and interpretation. (a) Optimal clustering (K-means++). (b) Data distribution and APT price/m2. (c) SHAP values of variables. (d) APT price/m2.

Figure 11(c) illustrates the application of the SHAP algorithm, enhancing the analysis of Figures 10, 11(a) and 11(b) by quantifying the impact of each variable on the clustering outcome.Footnote 1 This step is instrumental in highlighting the role of APT prices in differentiating the groups. The SHAP algorithm identifies and ranks variables based on their influence in achieving the optimal clustering, with the most significant variables appearing at the top of the plot. The colour coding is used to denote the variable values: red for high (indicating higher APT prices) and blue for low. The vertical axis quantifies the significance of each variable in the clustering process, while the horizontal axis shows the direction of the variable's impact on the clustering outcome (left for cluster 0, right for cluster 1). In these results, the high values (coloured red) predominantly influence cluster 0 (on the left). Notably, the APT price per square meter emerges as a key factor, markedly affecting the regional clustering outcomes and distinguishing itself from other regional characteristics.
Furthermore, Figure 11(d) showcases the disparity in APT price/m2 between cluster 0 and cluster 1, which is found to exceed a threefold difference. This suggests that the actual variation in apartment prices between the highest and lowest districts could be even more pronounced than what is initially visible. Such a finding emphasizes the significant role of housing wealth, particularly in the form of apartment prices, in differentiating the clusters. Overall, these figures collectively underscore the methodological soundness of the analysis and the importance of apartment prices in delineating the structural divisions within the dataset.
In summary, the second phase of this study utilized PCA, clustering algorithms, SHAP and visualization techniques to categorize entire region and interpret the results. Employing a data-driven approach, the findings suggest that the region can be optimally divided into two distinct groups. A key observation is that APT price emerges as a crucial factor in differentiating these groups. In the following section, this study will delve into the impact of housing wealth on political outcomes, employing causal inference analysis at the district level.
3.4 Analysis 3
Table 2 presents the outcomes of six regression models that investigate the impact of different housing wealth indicators on political outcomes. The models use the proportions of PPP and DP votes from the 2022 presidential election as dependent variables, with data obtained from the National Election Commission's public records.
Housing wealth and conservative/democratic vote proportion

Note: Controls are not reported. See Table B2 in Appendix B for full results.
*P < 0.1, **P < 0.05, ***P < 0.01.
In this study, the primary explanatory variables are carefully selected to encompass a broad spectrum of indicators related to housing wealth. These include the APT price per square meter, which offers a direct measure of the value of real estate. In addition to this, the analysis incorporates data on income and wealth as reflected in health insurance premiums. This inclusion is particularly pertinent in the Korean context, where health insurance premiums are calculated based on a combination of income and wealth, thereby providing a comprehensive indicator of an individual's economic status. Furthermore, the analysis has integrated wealth tax data as an additional explanatory variable. The wealth tax, a local tax levied on individual wealth, serves as an indirect measure of the broader wealth within the si-gun-gu regions. While this tax does not directly represent housing wealth, it serves as an indirect indicator. This is particularly relevant in Korea, where a significant majority (over 60%) of personal assets are in real estate, predominantly housing. This approach enables us to capture a more nuanced understanding of housing wealth by considering the broader economic factors that influence it.
The inclusion of these variables aims to address potential limitations in analysing housing wealth solely through apartment prices, particularly in the absence of extensive time-series data of APT at the district level. By integrating diverse measures such as health insurance premiums and wealth tax as alternative variables, this study enhances the consistency, reliability and depth of the analysis. This multifaceted approach is crucial in accurately reflecting the complex dynamics of the housing market in Korea.
Besides, to effectively interpret the aggregated nature of wealth tax data, a natural logarithm transformation is applied to the variable. Unlike the previous two explanatory variables, which are accessible for both autonomous districts within Seoul and metropolitan cities, as well as general districts within general cities, the wealth tax data are unavailable at the general district level. As a result, the dataset comprises a total of 230 observations. In addition, the control variables include the variables discussed in the data subsection, such as Homeownership, Education, Age, Sex, Urbanization, Turn out and regional dummy variables (see data subsection and Appendix A for details). The respective results can be found in Table 2.
The findings reveal that multiple measures of housing wealth exert statistically significant influences on key dependent variables, specifically the vote proportions for the two political parties. These housing wealth indicators have a dual impact: they positively associate with an increase in vote share for the Conservative party while concurrently exhibiting a negative effect on the Democratic party's vote share. This pattern is consistently observed across different housing wealth measures, suggesting a robust and systematic relationship between housing wealth and political preferences.
Further analysis incorporating control variables such as Education, Age and Voter Turnout, which are detailed in Table B2 in Appendix B, also demonstrates their statistically significant effects. Additionally, regional political influences, particularly from the Honam and Youngnam regions, are identified as significant. In contrast, the variable of Homeownership does not show statistical significance. This outcome could be attributed to the unique housing market dynamics in Korea, where the disparity in house prices across different regions may diminish the impact of homeownership on political outcomes. Alternatively, this could be influenced by the prevalence of the unique Jeonse system in Korea. In Jeonse, a renter deposits a substantial amount (typically 70–80% of the property's value) with the landlord, which is fully refundable upon moving out. This system may blur the distinction between renters and owners, as renters in Jeonse arrangements possess a considerable economic stake in their housing, akin to partial ownership. Therefore, the traditional homeownership variable may not capture the complete picture of housing wealth's influence in this context.
The relevance of these findings is further highlighted when viewed in the context of the 2022 Korean presidential election, which saw a notably close victory margin of just 0.73 percentage points between candidates Yoon Suk Yeol and Lee Jae-myung. This narrow margin suggests that even minor fluctuations in housing prices could potentially influence election outcomes. The study indicates that in closely contested elections, subtle changes in housing wealth might affect the election results. It points to the role of housing wealth in electoral dynamics, particularly in scenarios where small shifts could lead to noticeable, yet not necessarily decisive, changes in the political landscape.
Figure 12 presents the effects of changes in the average price of APT/m2 on the predicted value of Conservative vote proportion and Democratic vote proportion, respectively, while keeping other variables constant at their means. To account for prediction uncertainties, 95% confidence intervals are included in the estimates. The findings indicate that different levels of housing wealth have a notable impact on the predicted outcomes. Specifically, when the price ranges from the minimum value of 300 to the maximum value of 2700, the predicted value of the Conservative vote proportion increases from 36 to 44%. In contrast, the predicted value of the Democratic vote proportion experiences a decrease from 37 to 28% as the price changes. This suggests that higher housing wealth is associated with a higher likelihood of conservative party support and a lower likelihood of democratic party support. These results provide valuable insights into the potential effects of changes in housing wealth on the predicted outcome variables. In other words, they demonstrate the positive impact of increasing housing wealth, as indicated by the average price of APT/m2, on the predicted outcome of the Conservative vote proportion. Conversely, an increase in the price appears to have a negative effect on the predicted outcome of the Democratic vote proportion.
Linear prediction of APT price/m2 on Conservative/Democratic vote proportion. (a) Conservative vote proportion. (b) Democratic vote proportion.
Note: Linear prediction is based on model (1) and (4) in Table 2.

This study's comprehensive theoretical framework and its arguments allow for an integrated interpretation of the results from analysis 1, analysis 2 and analysis 3, thereby enriching our understanding of the link between housing wealth and political outcomes at the regional level. The conclusions drawn from these three analyses collectively reveal a coherent pattern. Analysis 1 uncovers a correlation between an individual's housing wealth and their political affiliations, a connection made visible through advanced visualization techniques. Analysis 2 takes this further by effectively segmenting the region into two distinct groups, with apartment prices emerging as a crucial factor in differentiating these groups. Building on this, analysis 3 substantiates the idea that an increase in housing wealth associates with a heightened preference for the conservative party.
Synthesizing these findings, it becomes apparent that a rise in housing wealth is associated with an increased likelihood of support for the conservative party. Consequently, regions characterized by higher housing wealth levels tend to exhibit stronger conservative preferences. When viewed collectively, these analyses offer robust empirical support for the core premise of this study, which posits a significant impact of housing wealth on political outcomes. The results highlight the pivotal role of housing wealth in influencing individuals' political orientations within specific regional contexts, affirming the importance of economic factors in shaping political landscapes.
4. Conclusions
In contemporary academic discourse, there has been a significant amplification in the examination of the political economy pertaining to asset accumulation, the disparity in wealth and their subsequent influence on political outcomes. This heightened interest is a response to the growing disparities in wealth observed in developed capitalist societies since the 1980s. While prevalent studies have mainly focused on individual and national factors to understand political behaviours and outcomes, the role of regional housing politics remains underexplored. Consequently, it becomes imperative to delve deeply into the nexus between housing wealth and political outcomes at a regional level, as this subject demands more rigorous scrutiny.
This study's regional analysis provides compelling evidence that an increase in housing wealth at the district level associates with a greater inclination towards conservative political parties. The data indicate that higher housing wealth within a district is linked to a stronger tendency among its inhabitants to favour conservative ideologies and support conservative political parties. Furthermore, the data-driven analysis highlights the significance of housing wealth amidst various regional characteristic variables, particularly in its capacity to distinguish the target regions. These findings substantially enhance our understanding of the relationship between housing wealth and political outcomes on a regional basis. By establishing a positive association between district-level housing wealth and conservative party preferences, and emphasizing the structural relevance of housing wealth in regional differentiation, the study emphasizes the pivotal influence of housing wealth in moulding political outcomes within specific geographic contexts.
These findings have implications for understanding the interplay between socio-economic factors and political ideology. The possession of housing wealth within a district is shown to be a contributing factor in shaping individuals' political preferences towards conservative ideologies and parties. It suggests that the perceived economic prosperity and social status associated with housing wealth can influence individuals' political orientations and their inclination to support conservative policies.
This study's findings also underscore the importance of considering regional dynamics in the analysis of housing wealth and political behaviour. By examining variations in housing wealth within districts, the research highlights the relevance of localized factors in shaping political preferences. This regional perspective offers valuable insights into the complex relationship between housing wealth and political ideology, providing a nuanced understanding of how housing wealth operates as a determinant of conservative party preference within specific regional contexts. Consequently, the findings help bridge a gap in knowledge by explaining the association between individual-level political behaviour and national-level political outcomes.
In conclusion, the present study provides significant empirical evidence that supports the association between district-level housing wealth and the preference for conservative party. The findings contribute to the literature on the political economy of housing and regional politics, shedding light on the factors that shape political preferences at the regional level. By examining the relationship between housing wealth and political outcomes, this research enhances our understanding of the interplay between socio-economic factors and political ideology within specific geographical contexts.
This study acknowledges the methodological constraints imposed by the lack of time-series data of APT at the district level, which would have been instrumental in analysing the evolving impact of housing wealth on political outcomes within the same districts over time. However, despite the limitations, the present study presents robust empirical findings by adopting a multi-dimensional approach. This approach incorporates visualization techniques, data-driven methodologies and causal inference techniques, thereby enhancing the reliability and validity of the study's conclusions. These methodological choices effectively compensate for the data limitations, offering insightful perspectives on the interplay between housing wealth and political preferences. Furthermore, while the inherent data limitations are acknowledged, the potential risks associated with using less-than-ideal data are counterbalanced by the unique contributions this study makes to the existing body of research. This work represents a pioneering effort in exploring the role of housing wealth in shaping voting behaviour at the district level. Not only does it contribute novel insights to the academic field, but it also lays the groundwork for more comprehensive future research endeavours.
The limitations identified in this study are not merely obstacles; rather, they highlight areas ripe for future academic exploration. They underscore the need for more targeted data collection and focused research in this area, potentially sparking new lines of inquiry and more localized investigations. This study, therefore, serves as both a valuable contribution to the current understanding of housing wealth's political impact and a catalyst for further scholarly discussion and research in this domain.
Future research in this field should intensify efforts to explore the broader implications of wealth and wealth disparities on a range of political outcomes. This includes examining their impact on welfare state evolution, political polarization and the state of democracy, with a particular focus on both the Korean context and other diverse regional settings. Although the role of wealth and wealth inequality has been increasingly examined in advanced economies, there is a pressing need for studies that delve into the nuances and overarching trends within specific societies.
One promising avenue for research is the investigation of how wealth distribution influences the development and efficacy of welfare state policies. A detailed examination of the interplay between wealth disparities and welfare state progression can offer insights into the mechanisms by which economic inequalities shape social policy decisions and affect public support for redistributive initiatives. Additionally, there is a need for a deeper understanding of the role of wealth disparities in fostering political polarization. The potential of wealth to contribute to ideological and preference polarization is significant, as varying wealth levels among different groups may lead to conflicting viewpoints on critical issues such as taxation, social welfare and economic regulation. Research into how wealth disparities correlate with political polarization could illuminate the factors driving societal divides and their implications for democratic processes.
Moreover, future studies should account for the contextual influences on the wealth–political outcome relationship in various regional contexts. Recognizing the distinct social, cultural and political attributes of each society is crucial, as these aspects can significantly modulate the relationship between housing wealth and political behaviour. Building upon the current body of literature, comparative analyses can be instrumental in identifying both unique and common patterns in how wealth influences political outcomes across different societies. Such research endeavours would substantially enhance our understanding of the complex interrelations between economic factors and political dynamics.
Supplementary material
The supplementary material for this article can be found at https://doi.org/10.1017/S146810992400001X and https://doi.org/10.7910/DVN/J1PYTZ.
Data availability statement
The author confirms that the data supporting the findings of this study are available within the article and its supplementary material.
Acknowledgements
Not applicable.
Funding statement
Not applicable.
Competing interests
The author declared no potential conflicts of interest with respect to the research, authorship and/or publication of this article