Introduction
Meat availability in India is very less than recommended, that is, only c. 15 g/person/day against the Indian Council of Medical Research (ICMR) recommendations of 30 g/person/day (Islam et al., Reference Islam, Anjum, Modi and Wadhwani2016). Therefore, to meet the ICMR recommendation, it is essential to increase the productivity of meat-producing animals. Sheep meat is considered as one of the world four major meat categories along with beef, pig meat and poultry meat throughout the world (Skapetas and Kalaitzidou, Reference Skapetas and Kalaitzidou2017). Therefore, increase in sheep production can directly contribute to the increase in production status of meat in India.
Sheep production efficiency is influenced by both reproductive and mothering ability of ewes, as well as growth and survival potential of the lambs (Dickerson, Reference Dickerson1970). For the improvement in ewe productivity, increase in number of lambs born and weaned, as well as increase in weight of lambs at birth and weaning can be taken as a key components (Duguma et al., Reference Duguma, Schoeman, Cloete and Jordaan2002). Also, reproductive traits have been identified as the main influencing factors of the profitability of sheep enterprises, and therefore the improvement of these traits will lead to more efficient lamb production (Matos et al., Reference Matos, Thomas, Gianola, Tempelman and Young1997; Ekiz et al., Reference Ekiz, Ozcan, Yilmaz and Ceyhan2005). Therefore, in any sheep breeding enterprise, production of more lambs per ewe and enhancing the growth potential of lambs are possible alternatives for increasing production and improving breeding efficiency (Miraei-Ashtiani et al., Reference Miraei-Ashtiani, Seyedalian and Moradi Shahrbabak2007).
The improvement of ewe productivity and growth ability of lambs increases meat production, as well as the profitability of sheep farming and this improvement needs a working knowledge of genetic and environmental contributions to expression of each trait (Rashidi et al., Reference Rashidi, Mokhtari, Esmailizadeh and Asadi Fozi2011). Safari et al. (Reference Safari, Fogarty and Gilmour2005) also showed that designing efficient selection and breeding strategies for genetic improvement and appropriate genetic evaluation of local breeds requires an accurate estimation of genetic parameters. Various authors (Fogarty et al., Reference Fogarty, Brash and Gilmour1994; Cloete et al., Reference Cloete, Greeff and Lewer2002; Ekiz et al., Reference Ekiz, Ozcan, Yilmaz and Ceyhan2005; Rashidi et al., Reference Rashidi, Mokhtari, Esmailizadeh and Asadi Fozi2011) have reported the heritability of ewe productivity, but the heritability of traits vary with location and environment, as well as the breed in which the study is being undertaken. Previously, work on genetic evaluation of growth traits has been carried out by Bangar et al. (Reference Bangar, Magotra and Yadav2020) in Harnali sheep. However, there has been no study with respect to ewe productivity traits in Harnali sheep.
Therefore, the present study was carried out to study the factors affecting ewe productivity and to estimate the genetic parameters for ewe productivity to include this in breeding programmes to increase farm profitability.
Materials and methods
The present research work was undertaken at Lala Lajpat Rai University of Veterinary and Animal Sciences, Hisar, Haryana, India (29º08′N latitude and 75º41′E longitude). Harnali is a superior carpet wool-producing sheep developed by Lala Lajpat Rai University of Veterinary and Animal Sciences, Hisar. Harnali sheep are a three-breed cross with 37.5% Nali and 62.5% exotic inheritance (Russian Merino and Corriedale).
Feeding and management
Feeding and management practices were followed more or less uniformly throughout the year. The animals were let loose for grazing in pasture, harvested fields and the surrounding areas of farms in the daytime (for c. 6 h effectively daily on natural pastures). Apart from grazing, all animals were fed with green and dry fodder in the morning and evening as per the requirements. In addition to this, defined quantities of concentrates was also fed to all animals in the evening.
The animals were kept in a loose housing system with brick flooring. Animals were provided ad libitum with clean water in the shed. The structure of the sheep farm was designed with consideration of separate pens for lambing ewes, ewes with lambs of 0–3 months, rams and ewes. There was also a separate isolation pen for diseased animals.
The ewes were mated usually in the month of September to October and lambs were born late in February to March. Ewes after lambing were kept along with lambs in the lambing pen for 1 week and suckling of lambs twice in a day (morning and evening) up to weaning was practised. A good quality concentrate mixture was also provided to lambs in addition to suckling. The lambs whose dam had died in an early period were given special artificial rearing, including milk from another ewe. After 1 week of age, lambs were shifted to another pen (ewes with lambs of 0–3 months). The weaning period for lambs was typically 90 days of age. All the lambs were ear tagged at birth within 2–3 days of lambing for identification.
Data records
Data for 440 animals born to 85 sires and 259 dams were listed in historical records and pedigree sheets of Harnali sheep maintained at the Department of Animal Genetics and Breeding, College of Veterinary Sciences, Lala Lajpat Rai University of Veterinary and Animal Sciences, Hisar for the period January 2001 to December 2020. This included 440 animals at birth and 423 animals at weaning, as some of the animals died before weaning.
In the present study, the non-genetic factors included age of ewe at lambing [young (<2 years); adult (2–2.5 years) and old (≥2.5 years)], Weight of ewe at lambing [lighter (<28 kg); medium (28–30 kg) and heavier (>30 kg)] and period of lambing as P1 (2001–2004); P2 (2005–2008); P3 (2009–2012); P4 (2013–2016) and P5 (2017–2020).
Statistical analysis
To study the effect of non-genetic factors on ewe productivity traits, least-squares analysis was applied to identify the significance of important non-genetic factors affecting different ewe productivity traits with following linear model:
Yijkl = µ + Li + Aj + Wk + eijkl
where, Yijkl represents observation on lth animal belonging to kth group of weight of ewe at lambing, jth group of ewe’s age at lambing of ith period; μ represents overall mean; Li represents fixed effect of ith period of lambing (i = 1, 2, 3, 4, 5); Aj represents fixed effect of jth group of ewe’s age at lambing (j = 1, 2, 3); Wk represents fixed effect of kth group of ewe’s weight at lambing (k = 1, 2, 3); eijkl represents random error component NID (0, σe 2). Least-squares analysis was performed using SPSS 20.0 version software (IBM Corp., 2011).
Significant (P < 0.05) effects were further subjected for partitioning total variance components into the source of additive, maternal and residual variation among the traits. The estimates of variance components and heritability for targeted traits were estimated by fitting a series of univariate animal models and an average information restricted maximum likelihood (REML) algorithm (WOMBAT) (Meyer, Reference Meyer2007). Univariate analysis for each trait were carried out to estimate the variance components for each trait including or excluding the maternal effects in the following models:
Model 1: y = Xβ + Z1a + e
Model 2: y = Xβ + Z1a + Z2m+ e with Cov (a, m) = 0
Model 3: y = Xβ + Z1a + Z3c + e
Model 4: y = Xβ + Z1a + Z2m + Z3c + e with Cov (a, m) = 0
where y represents n ×1 vector of observations for each trait, X, Z1, Z2, Z3 and e represent the incidence matrix for fixed, direct, maternal, maternal permanent environment and random effects. It was assumed that V(a) = Aσ2 a, V(m) = Aσ2 m, V(c) = Iσ2 c, and V(e) = Iσ2 e where I represents Identity matrix, and σ2 a, σ2 m, σ2 c and σ2 e represent direct additive genetic, maternal genetic, maternal permanent environmental and residual variances. The four animal models were compared using likelihood ratio test under consideration of significance based on chi-squared test (Bangar et al., Reference Bangar, Magotra and Yadav2020).
Results
Various traits such as litter size at birth (LSB), litter weight at birth (LWB), litter size at weaning (LSW), litter weight at weaning (LWW) and age at first lambing (AFL) were studied.
Non-genetic factors
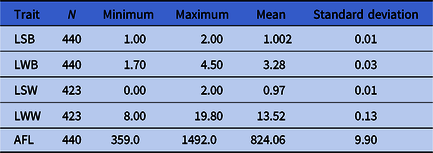
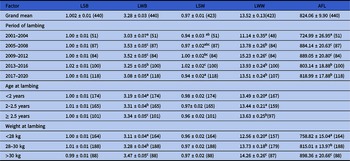
The characteristics of data structure for ewe productivity traits of Harnali sheep is shown in Table 1 and averages for LSB, LWB, LSW, LWW and AFL were 1.002, 3.28 kg, 0.97, 13.52 kg and 824.06 days, respectively. Least-squares means were estimated for LSB, LWB, LSW, LWW and AFL to see the effect of various factors affecting ewe productivity and which are shown in Table 2. A non-significant (P > 0.05) effect of period of lambing was found for the LSB. However, there was a significant (P < 0.05) difference in period of lambing for LWB, LSW, LWW and AFL.
Characteristics of data structure for ewe productivity traits of Harnali sheep

Least-squares estimates of ewe productivity traits in Harnali sheep

Means (±SE) in same column with different superscripts differ significantly (P < 0.05).
A non-significant (P > 0.05) effect of age at lambing was seen on the LSB and LSW but significant (P < 0.05) difference was found on LWB in which old ewes gave maximum least-squares mean (3.34 ± 0.05 kg) followed by adult (3.31 ± 0.04 kg) and young ewes (3.19 ± 0.04 kg), respectively. Also, effect of age had significant (P < 0.05) value on LWW but here only old ewes varied from the young and adult ewes and gave maximum least-squares mean (13.63 ± 0.25 kg).
A non-significant (P > 0.05) effect of weight of ewe at lambing was seen on the LSB and LSW but significant (P < 0.05) difference was found for LWB, LWW and AFL. For the LWB trait, heavier weight ewes had maximum least-squares means (3.47 ± 0.05 kg) followed by medium-weight ewes (3.28 ± 0.04 kg) and lighter ewes (3.11 ± 0.04 kg). Similarly, for LWW, heavier weigh ewes had maximum least-squares means (14.26 ± 0.26 kg) followed by medium weighing ewes (13.73 ± 0.18 kg) and lighter ewes (12.56 ± 0.20 kg).
Also, for AFL, heavier weight ewes gave maximum least-squares means (898.36 ± 20.66 days) were followed by medium weighing ewes (815.01 ± 13.97 days) and lighter ewes (758.82 ± 15.04 days).
Heritability estimates
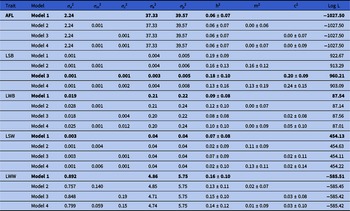
The variance components and heritability for ewe productivity traits such as LSB, LWB, LSW, LWW and AFL were estimated using the REML method and the results are shown on Table 3. Among all models for different traits, Model 1 was found appropriate for all traits except for LSB in which Model 3 was found to be more suitable as it had highest log L value (960.21) compared with its contemporary models. Under Model 1, the estimates of direct additive heritability for AFL, LWB, LSW and LWW were observed as 0.06 ± 0.07, 0.09 ± 0.08, 0.07 ± 0.08 and 0.16 ± 0.10, respectively. Whereas for LSB, under Model 3, the estimate of direct heritability was observed as 0.18 ± 0.10. The significant contribution of permanent environment effects was also seen for LSB and this was 0.20 ± 0.09.
Estimates of variance and heritability for various ewe productivity traits in Harnali sheep

σ a 2, σ m 2, σ c 2, σ e 2 and σ p 2 are additive genetic, maternal genetic, maternal permanent environment, residual variance and phenotypic variance, respectively; h 2, m 2 and c 2 are direct additive, maternal genetic and maternal permanent environment heritability respectively; and log L is log-likelihood for the best model obtained from WOMBAT software (Meyer, Reference Meyer2007).
Genetic and phenotypic correlations with standard error among the various reproduction traits are presented in Table 4. The genetic correlation between LSB and LWW, and LSW and LWW was found to be negatively correlated. However, other litter traits showed positive correlation with each other with values ranging from as low as 0.10 ± 0.05 to as high as 0.79 ± 0.06. AFL showed a low genetic correlation with LWW (0.10 ± 0.05) and showed medium correlation with LSB (0.36 ± 0.06), LWB (0.47 ± 0.55) and LSW (0.36 ± 0.06). LSB showed a negative genetic correlation with LWW (−0.38 ± 0.05) and showed medium genetic correlation with LWB (0.54 ± 0.16) and high genetic correlation with LSW (0.79 ± 0.06). LWB showed medium genetic correlation with LSW and LWW with values 0.54 ± 0.16, 0.45 ± 0.24, respectively. Also, LSW showed negative correlation with LWW (−0.38 ± 0.05).
Genetic (above diagonal) and phenotypic (below diagonal) correlation estimates among ewe productivity traits in Harnali sheep

Discussion
This study was the very first attempt to investigate ewe productivity in Harnali sheep. The significant influence of lambing period on reproductive traits such as LWB, LSW, LWW and AFL in the present study can be explained by variation in climatic conditions, however LSB had no significant difference due to lambing period. Significant effects of year of lambing on reproductive traits of different sheep breeds have been reported by Boujenane et al. (Reference Boujenane, Kerfal and Khallouk1991) in D’man; Bromley et al. (Reference Bromley, Van Vleck and Snowder2001) in Columbia, Polypay, Rambouillet and Targhee; Ekiz et al. (Reference Ekiz, Ozcan, Yilmaz and Ceyhan2005) in Turkish Merino; and Vatankhah et al. (Reference Vatankhah, Talebi and Edriss2008) in Lori-Bakhtiari sheep.
A significant influence of age of ewe at lambing was seen on the LWB and LWW, in which old ewes had higher least-squares means than the young ewes, which could be due to good mothering ability and nursing of older ewes compared with younger ones. Similar results have been reported by Rosati et al. (Reference Rosati, Mousa, Van Vleck and Young2002), Ekiz et al. (Reference Ekiz, Ozcan, Yilmaz and Ceyhan2005) and Mokhtari et al. (Reference Mokhtari, Rashidi and Esmailizadeh2010). LSB and LSW did not show significance, although this can be explained by low twinning rates and low litter variance. Significant effects of ewe weight at lambing was also seen on the LWB, LWW and AFL that gave the general trend that the heavier mother had good litter traits compared with medium or lighter weight mothers. This finding highlights the need of proper nutrition of ewes before conception.
The estimates for the direct heritability for LSB was found to be in agreement with the reports of Rashidi et al. (Reference Rashidi, Mokhtari, Esmailizadeh and Asadi Fozi2011) who estimated it as 0.11 ± 0.03, but this value was higher than the estimates of Mokhtari et al. (Reference Mokhtari, Rashidi and Esmailizadeh2010) that gave a value of 0.01 ± 0.01. The estimates for direct heritability for LWB concurred with findings of Rashidi et al. (Reference Rashidi, Mokhtari, Esmailizadeh and Asadi Fozi2011) and Mokhtari et al. (Reference Mokhtari, Rashidi and Esmailizadeh2010) that gave values of 0.07 ± 0.03 and 0.06 ± 0.03, respectively, but Duguma et al. (Reference Duguma, Schoeman, Cloete and Jordaan2002), Cloete et al. (Reference Cloete, Greeff and Lewer2002) and Olivier et al. (Reference Olivier, Snyman, Olivier, Van Wyk and Erasmus2001) gave higher heritability estimates of 0.17, 0.14 and 0.16, respectively. The estimates of direct heritability for LSW in our study were higher than the estimates of Rashidi et al. (Reference Rashidi, Mokhtari, Esmailizadeh and Asadi Fozi2011), Mokhtari et al. (Reference Mokhtari, Rashidi and Esmailizadeh2010) and Ekiz et al. (Reference Ekiz, Ozcan, Yilmaz and Ceyhan2005) who reported estimates as 0.02 ± 0.03, 0.03 ± 0.02 and 0.04 ± 0.03, respectively. The estimates of direct heritability for LWW in our study concurred with the study of Mokhtari et al. (Reference Mokhtari, Rashidi and Esmailizadeh2010) and Bangar et al. (Reference Bangar, Magotra, Yadav and Chauhan2021) but it was higher than reports of Rashidi et al. (Reference Rashidi, Mokhtari, Esmailizadeh and Asadi Fozi2011).
One interesting finding to be noted here was that for LSB, the permanent environment effect also played a large role and had value of 0.20 ± 0.09. This value was higher than reports by Ekiz et al. (Reference Ekiz, Ozcan, Yilmaz and Ceyhan2005), Mokhtari et al. (Reference Mokhtari, Rashidi and Esmailizadeh2010) and Rashidi et al. (Reference Rashidi, Mokhtari, Esmailizadeh and Asadi Fozi2011), who reported this value as 0.02, 0.07 and 0.05, respectively. However, the present estimate was in line with the reports of Yavarifard et al. (Reference Yavarifard, Hossein-Zadeh and Shadparvar2015), who estimated permanent environment effect as 0.23 for the LSB trait. The findings of the present study indicated that litter size can be increased by improving the permanent environment by better feeding of ewes and adopting better management at farms.
The LSB and LSW value were negatively correlated with LWW; this can be explained by the fact that there was mortality due to which size of litter present at weaning was less than at birth. The correlation values between LWB and LWW were consistent with the results of Rosati et al. (Reference Rosati, Mousa, Van Vleck and Young2002) and Vatankhah et al. (Reference Vatankhah, Talebi and Edriss2008), who also reported positive and medium estimates. Positive and medium to high genetic correlations between LWB and the other traits indicated that selection based on LWB would be effective and could enhance the overall reproductive performance of the ewes.
In conclusion, the present results showed that non-genetic factors such as period of lambing, age of ewe at lambing and weight of ewe at lambing may influence the different ewe productivity traits. Estimates of direct heritability were low, which suggested that genetic selection for ewe productivity traits in Harnali would result in lower genetic progress. Permanent environment effects had moderate roles in LSB. Positive and medium to high genetic correlations between LWB and other traits indicated that selection based on LWB would be effective and could enhance the overall reproductive performance of the ewes. The present results also suggested that proper nutrition must be provided to ewes before lambing to achieve optimum weight for productive ewes.
Competing interests
The authors declare no competing interests regarding publication of this paper.
Financial support
None.
Ethical standards
Not applicable.
Acknowledgements
The authors are thankful to Worthy Vice-Chancellor, LUVAS, Hisar for providing the needed facilities for conducting this work. The authors also express their gratitude to the learned referee and the Editor-in-Chief for their valuable comments on the revised version of the paper.