




Background
Health resources are essential for people to access medical service, and the efficiency of health resource allocation is closely related to health outcomes and the sustainable development of a health system, rendering it a global health priority (Paul et al., Reference Paul, Nguemdjo, Ngami, Kovtun and Ventelou2022; Mbau et al., Reference Mbau, Musiega, Nyawira, Tsofa, Mulwa, Molyneux, Maina, Jemutai, Normand, Hanson and Barasa2023). Primary health care (PHC), as the foundation of population health security, has long been regarded as the cornerstone of sound health strategies (Edelman et al., Reference Edelman, Marten, Dhillon, Suresh, Thamarangsi, Grundy, Jhalani and Rasanathan2025; Omam et al., Reference Omam, Nkengateh and Mba2026). The World Health Organization estimated that throughout the course of a person’s life, 80–90% of health need could be addressed through a well-functioning PHC system, and emphasized that PHC was the most equitable, cost-effective and efficient approach to achieving universal health coverage (UHC). The 2018 Astana Declaration also reaffirmed the pivotal role of PHC for sustainable health system, and called upon nations to increase investment in PHC to achieve UHC and the Sustainable Development Goals (World Health Organization, 2019). Overall, an efficient PHC system can not only improve health outcomes but also significantly reduce total health expenditure, and improve the overall efficiency of a health system (Elmusharaf et al., Reference Elmusharaf, Poix, Grafton, Jung, Gribble, Stanton, Mahmoud, Al Asfoor, Alawadi, Mustafa, Shuwaiter, Alsuwaidan, Al-Abri, Al-Sabahi, Fadda, Syed, Almutairi, Al-Farsi, Banatvala and Tarlton2024).
China has established a comprehensive three-tier PHC system covering both urban and rural areas. In rural regions, the PHC system comprises three administrative levels including village clinics (VCs), township health centres (THCs), and county hospitals. In urban areas, it consists of community health stations (CHSs), community health centres (CHCs), and district hospitals accordingly (Li et al., Reference Li, Lu, Hu, Cheng, De Maeseneer, Meng, Mossialos, Xu, Yip, Zhang, Krumholz, Jiang and Hu2017; Wu et al., Reference Wu, Zhang, Zhao, Yan, Zhao, Song, Ma, Li, Li, Liu, Bi and Zhang2022). The PHC system bears the dual responsibility of providing basic medical services and essential public health services, including diagnosis and treatment of common diseases, chronic disease management, immunization, health education, infectious disease prevention and control, and residents’ health record management. The system historically succeeded in meeting the basic health need of approximately 22% of the world’s population while accounting for only about 1% of global health expenditure, and increased China’s average life expectancy from 35 years to 68 years (Young, Reference Young1989; World Bank, 2001).
However, as the imbalance between supply and demand in health services (Wang et al., Reference Wang, Liu, Yang, Gong, Zhang, Yang, Li, Sun and Tangcharoensathien2025b), fragmentation of the health insurance system (Ji et al., Reference Ji, Chu and Qin2025), and uneven clinical competency among health workers in PHC institutions (Li et al., Reference Li, Wang, Xie, Gao, Chen and Zhang2025) have intensified in China, the PHC system has been severely affected by marked efficiency deficiencies and substantial underutilization of healthcare resources (Jiang et al., Reference Jiang, Yang, Dai and Li2025). Research has shown that the efficiency of the PHC system in China has persistently remained suboptimal and had exhibited a discernible downward trend over time. A Malmquist-DEA study reported that the average technical efficiency of the urban PHC system in China ranged from 63.3% to 67.1%, and from 75.8% to 82.2% in rural areas (Zhou et al., Reference Zhou, Peng, Chang, Liu, Gao, Zhao, Li, Feng and Qin2023). A three-stage DEA analysis based on provincial panel data from 2012 to 2020 found that, after adjusting for random disturbances and environmental factors, the mean technical efficiency of the PHC system declined from 0.802 to 0.747 (Huang et al., Reference Huang, Li, Shi, Su, Hao, Zhao and Chai2024b). Another Malmquist-DEA study of 18 districts in Hainan Province reported that the mean efficiency of the PHC system decreased by an average of 5.7% annually from 2011 to 2021 (Liu et al., Reference Liu, Peng, Kane, Wu, Liu and Huang2025). In addition, data indicated that the proportion of total consultations accounted for by the PHC system declined continuously from 56.4% in 2015 to 51.8% in 2023, widening the gap relative to the policy target of 65% (The National Health Commission of the People’s Republic of China, 2024, Zhang et al., Reference Zhang, Duan, Li and Duan2026). The bed utilization rate in THCs fell steadily from 50.4% in 2020 to 46.9% in 2022 (The National Health Commission of the People’s Republic of China, 2023), far below the national average of 66.1% for all health institutions (Zhang et al., Reference Zhang, Shi, Yang and Sun2023a), Meanwhile, the utilization rate of VCs dropped by 44% between 2011 and 2018 (Chen et al., Reference Chen, Sylvia, Wu and Yi2022). Therefore, in the face of increasing healthcare burdens, population ageing, and the rising prevalence of chronic diseases, how to accelerate the development of the PHC system and improve its efficiency within the existing medical resource constraints has become a critical issue that urgently needs to be addressed in the process of China’s deepening healthcare system reform.
To address the inefficiency of the PHC system, the Chinese government has promoted the Close-Knit County-level Medical Community (CCMC) policy nationwide since 2019. The theoretical foundation of the CCMC stemmed from the concepts of health resource integration and collaborative governance. A CCMC refers to a healthcare service consortium in which county/district hospitals typically serve as the leading entities, and some other medical institutions of the three-tier PHC system within the county jurisdiction are integrated to establish a healthcare service community (The State Council of the People’s Republic of China, 2023). This community is characterized by shared responsibilities, aligned interests, coordinated service delivery, and unified management of administrative affairs, human resources, financial assets, medical services, pharmaceuticals and medical devices, and information systems (Fu et al., Reference Fu, Zhao, Zhang, Chai and Goss2018). The CCMC policy is designed to achieve three core objectives. First, it aims to enhance the service capacity of the PHC system through technical assistance and talent transfer from county/district hospitals to VCs, THCs, CHSs or CHCs. Second, it seeks to optimize resource allocation efficiency through unified management and coordinated deployment in the CCMC. Third, it endeavours to establish an orderly healthcare-seeking pattern by implementing a tiered diagnosis and treatment system with two-way referral mechanism, which encourages patients to seek first-contact care at PHC facilities to alleviate overcrowding in tertiary hospitals which are regional or supra-regional medical centres that provide specialized and comprehensive healthcare services, address critical and complex conditions, and undertake advanced teaching and research responsibilities (Chen, Reference Chen2009; Zeng et al., Reference Zeng, Gao, Zou, Li and Wang2026).
In recent years, academic interest in CCMC has grown considerably. The literatures on CCMC have developed rapidly over the past few years, yet several important gaps still remain. Existing studies were dominated by descriptive designs that documented changes in service volume, satisfaction, and quality indicators before and after the CCMC policy, most of which lacked control groups, making it difficult to establish causal inference (Roth et al., Reference Roth, Sant’anna, Bilinski and Poe2023; Liao et al., Reference Liao, Weng and Chen2025; Wang et al., Reference Wang, Liang, Li, Lin, Feng and Huang2025c). A smaller body of quasi-experimental research that employed methods such as difference-in-differences (DIDs) analysis focused primarily on service utilization and expenditure rather than the technical efficiency of resource allocation, which was a distinction that matters because the policy may expand service volume at the cost of disproportionate input increases, leaving efficiency unchanged or even reduced (Li et al., Reference Li, Fu, Mo, Li and Lin2026; Wan et al., Reference Wan, Ye, Shi, Huang and Huang2026). Moreover, existing studies about the efficiency of the PHC system have been conducted predominantly at the provincial or municipal level, with limited attention to the specific effects of the CCMC policy on county-level PHC systems (Zhou et al., Reference Zhou, Peng, Chang, Liu, Gao, Zhao, Li, Feng and Qin2023; Huang et al., Reference Huang, Li, Shi, Su, Hao, Zhao and Chai2024b; Tang et al., Reference Tang, Tang, Sun, Cao and Cao2025; Xing et al., Reference Xing, Tian, Wang, Liu, Tao, Lin, Zhou, Wang and Bai2025). These gaps underscore the necessity of systematically evaluating the effects of the CCMC policy from an efficiency perspective.
Sichuan Province, situated in southwestern China, is characterized by vast terrain, diverse geographical features, a large yet unevenly distributed population, and marked regional disparities in economic development. In many respects, this internal heterogeneity renders Sichuan a microcosm of the broader national context, which provides a favourable research site for conducting policy-related quasi-experimental studies (Wang and Pan, Reference Wang and Pan2016; Yang et al., Reference Yang, Duan, Peng, Shi and Pan2019). In 2019, a total of 37 county-level districts in Sichuan Province were designated as pilot sites for the development of CCMC policy. Based on the background above, this study aimed to conduct a comprehensive assessment of the impact of the CCMC policy on the efficiency of the PHC system based on the panel data from 183 county-level districts in Sichuan Province from 2013 to 2023, so as to provide scientific suggestions for policymakers and planners on adjusting and reallocating health resources under the CCMC policy.
Method
Data sources
This study collected annual panel data on health resources and health service utilization of the PHC system across 183 county-level districts in Sichuan Province from 2013 to 2023. Health resource indicators included the number of health facilities, hospital beds and health workers, and health service indicators included the number of outpatient visits and inpatient admissions. All the data were retrieved from the Statistical Yearbook of Health and Family Planning of Sichuan Province (2013–2016) and the Statistical Yearbook of Health of Sichuan Province (2017–2023).
Additionally, county-level socioeconomic variables were collected for each of the 183 districts from the Sichuan Statistical Yearbook. The included variables were categorized as follows: (1) demographic indicators including population density (PD), secondary school enrolment rate (rate_SSS) and urbanization rate (UR); (2) economic indicators including per capita gross regional product (per_GRP) and local government public budgetary revenue (L_GPBR); (3) health resource indicators including per capita hospital beds (per_HB) and per capita health workers (per_HW); (4) indicators of the strength of government support for health including fiscal health funding (FHF), proportion of public hospitals (rate_PH) and FHF rate (rate_FHF). Furthermore, the difference between the health resource agglomeration degree of the PHC system and the population agglomeration degree of the 183 districts was calculated as a proxy variable for the equity of health resource of the PHC system, covering three dimensions: health facilities (HRAD_PAD_HF), hospital beds (HRAD_PAD_HB), and health workers (HRAD_PAD_HW). Detailed descriptions of all the variables were presented in Supplementary Table 1.
The final panel dataset contained only one missing observation, which was the county-level control variable of local government public budgetary revenue for Beichuan County in 2016. The missing observation accounted for less than 1% of all county-year observations and was handled using listwise deletion when the DID models incorporating county-level socioeconomic covariates were fitted.
Study period and policy timeline
Prior to 2013, the county-level administrative divisions in Sichuan Province had undergone multiple adjustments, but since 2013, the province has maintained a stable configuration of 183 county-level districts with no further changes to geographic or administrative boundaries. Therefore, the starting year of this study was set as 2013. Meanwhile, the ending year was set as 2023 due to data availability. The CCMC policy was piloted in Sichuan in 2019. Accordingly, this study designated 2013–2018 as the pre-policy period and 2019–2023 as the post-policy period. Thirty-seven of the county-level districts were identified as pilot districts (see Supplementary Table 2 for details).
Statistical analysis
First-stage analysis: super-efficiency slacks-based measure (super-SBM) model
The objective of the first-stage analysis was to obtain efficiency scores of the 183 districts in each year, therefore providing the outcome variable for the second stage.
In the first-stage analysis, Data Envelopment Analysis (DEA) was employed to measure the allocative efficiency of the PHC system and its inter-temporal variation. DEA is a flexible and objective non-parametric linear programming method that uses multiple input and output indicators to measure the relative efficiency of homogeneous decision-making units (DMUs) without requiring a pre-specified functional form for the production technology. This characteristic makes DEA particularly suitable for complex healthcare systems with multiple inputs and outputs (Cantor and Poh, Reference Cantor and Poh2017). However, traditional DEA models (such as CCR and BCC) produce efficiency scores ranging from 0 to 1. When multiple DMUs simultaneously lie on the efficiency frontier, all receive a score of 1, making it impossible to further compare the efficiency of these DMUs. To overcome this limitation, Tone proposed the super-efficiency slacks-based measure model (super-SBM), and it has been widely used in the field of policy effect evaluation in recent years (Tone, Reference Tone2002). By excluding the DMU under evaluation from the reference set, the super-SBM model allows the efficiency scores to exceed 1, thereby enabling complete ranking and comparing of all DMUs. The basic calculation formula was as follows (Gong et al., Reference Gong, Shi, Wang and Sun2023):
 $$E = min{{{1 \over m}\sum\limits_{a = 1}^mS_a^ - /{X_{ak}}} \over {{1 \over s}\sum\limits_{c = 1}^sS_c^ + /{Y_{ck}}}}$$
 $$s.t.\left\{ {\matrix{ {\sum\limits_{\matrix{ {b = 1} \cr {b \ne k} \cr } }^n{X_{ab}}{\gamma _b} - S_a^ - \le {X_{ak}}} \cr {\sum\limits_{\matrix{ {b = 1} \cr {b \ne k} \cr } }^n{Y_{cb}}{\gamma _b} + S_c^ + \ge {Y_{ck}}} \cr {{\gamma _b},S_a^ -, S_c^ + \ge 0,\forall a,c,b} \cr } } \right.$$
E represented the super efficiency value, the value greater than or equal to 1 meant the DMU was effective, otherwise the DMU was ineffective. X ak and Y ck represented the input and output value of DMU. Where b = 1, 2, 3…, n, n was the number of DMU. X ab and Y cb represented the a-th input and c-th output of the b-th DMU respectively. γ was the weight value of the b-th DMU. S a− and S c+ represented the slack variables of input and output respectively.
Considering that the purpose of this stage was to obtain and compare the efficiency scores, so the non-oriented super-SBM model was used to measure the efficiency from both input and output aspects. In this study, 183 county-level districts in Sichuan Province were regarded as 183 independent DMUs, input indicators were the number of health facilities, hospital beds, and health workers of the PHC system, and the output indicators included outpatient visits and inpatient admissions. Given the substantial variation in operational scale and development stage of PHC institutions across different county-level districts, this study adopted the Variable Returns to Scale assumption rather than Constant Returns to Scale, to more accurately reflect the actual efficiency of each county-level district.
Second-stage analysis: benchmark difference-in-differences (DID) model
In the second-stage analysis, the benchmark DID model was employed to evaluate the effect of the CCMC policy on the efficiency of the PHC system. The DID method compares the changes in the outcome variable before and after policy implementation between the pilot group and the non-pilot group. By controlling for time-invariant differences and common time trend affecting both groups, DID can effectively mitigate the endogeneity problem (Roth et al., Reference Roth, Sant’anna, Bilinski and Poe2023; Bosco and Maranzano, Reference Bosco and Maranzano2025). This method has been widely applied in health policy evaluation and produces highly credible results. The core identification strategy of the DID model relies on the parallel trend assumption, which means that in the absence of CCMC intervention, the outcome variable (efficiency score) of the pilot and non-pilot groups would follow the same time trend. Before the DID analysis, the event study method was used to test this assumption (Ren et al., Reference Ren, Liu, Li, Wang and Chen2020)
To evaluate the policy effect of the CCMC, we employed a DID specification with two-way fixed effects (controlling for county and year fixed effects). The model was estimated using xtreg, fe with year dummies (the within estimator), and as a check, we also reported the equivalent least squares dummy variable (LSDV) estimates with county and year dummies, which should yield identical point estimates. We first fitted a DID model with the intercept only to evaluate the policy effect of the CCMC. Then the county-specific characteristics were incorporated into the intercept-only DID model using the same data set to explore if the policy effect could be explained by the specific characteristics.
Third-stage analysis: propensity score matching DID (PSM-DID) model
Policy pilot programmes are typically not randomly assigned. Pilot county-level districts may differ systematically from non-pilot in economic development, health resource endowment, or policy implementation capacity. Such selection bias may lead to biased DID estimators. To enhance the robustness of the results, this study employed the propensity score matching-DID (PSM-DID) method in the third stage to further test the policy effect. In this study, the specific operational steps of PSM-DID method were as follows.
In Step 1, the panel data was converted into cross-sectional data using the year of 2018 as the baseline. Then taking the pilot status as the dependent variable and 13 county-level variables as covariates, the logit regression model was fitted and the propensity scores were calculated. In Step 2, the PSM was performed using the nearest neighbour matching with calliper method. The calliper value was set at 0.05 and the maximum matching ratio was set at 1:2. If multiple samples in the control group satisfied the matching criteria, their variable means were used as the final analysis data. In Step 3, t-tests and the standardized mean difference (SMD) were used to assess the balance of covariates between the two groups after matching. The SMD criterion for covariate balance was set as <25% (0.25). Additionally, a kernel density plot was used to present the propensity score distribution of the two groups before and after PSM. In Step 4, the PSM-DID regression model was fitted based on the matched samples.
To test the robustness of the results more comprehensively, this study constructed two analysis datasets based on the matching result. The first was the full matched sample dataset (denoted as fitted model), which contained all samples that satisfied the matching criteria. The second was the frequency-weighted dataset (weighted model), which accounted for the possibility that one pilot group sample may be matched with multiple non-pilot group samples, thereby weighting each matched pair according to its frequency of occurrence to obtain more robust estimates.
Sensitivity analyses: excluding COVID-19 pandemic years
This study conducted a sensitivity analysis to isolate the policy effect of CCMC from the confounding of the COVID-19 pandemic
The COVID-19 epidemic occurred immediately after the CCMC policy was implemented and may have imposed impose an exogenous shock on the healthcare utilization of the PHC system in China. Between 2020 and 2022, when the pandemic was at its peak period, China implemented stringent public health measures that profoundly disrupted residents’ routine health-seeking behaviour, therefore, the outpatient visits inpatient admissions provided by the PHC system plummeted. Meanwhile, at the end of the epidemic, postponed elective healthcare need and deferred chronic disease management may have led to artificial fluctuations in health service utilization that might be unrelated to the CCMC policy itself. By 2023, the pandemic had been effectively brought under control, and healthcare utilization pattern had returned to pre-pandemic level. To isolate the true policy effect from this pandemic-induced noise, this study excluded the 2020–2022 data and retained only 2019 (the inaugural policy year) and 2023 (the first post-pandemic year with normalized healthcare delivery) as post-policy observations, then the DID and PSM-DID analyses were repeated. Finally, as a robustness check, we compared the estimates from the full sample (2013–2023) with those from the pandemic-excluded sample (2013–2019, 2023) to evaluate whether the pandemic had introduced bias into the estimated policy effect.
Software
DEA efficiency scores were calculated using MaxDEA 8.22 software. DID and PSM-DID analyses were performed using Stata 17.0 MP. All statistical tests were two-side, and the significance level was set as α = 0.10 given the exploratory nature of this study.
Result
Status and trend of health resource of the PHC system
Figure 1 presented the temporal trends in inputs of the PHC system across 183 county-level districts in Sichuan Province from 2013 to 2023. The average number of hospital beds (Panel A in Figure 1) and health workers (Panel B in Figure 1) exhibited an overall upward trajectory over the observation period, yet the divergence between the pilot and non-pilot districts was pronounced. The average number of hospital beds of pilot districts rose in an undulating pattern since 2016, whereas non-pilot districts showed a steady and gradual increase. Overall, the pilot districts consistently maintained higher bed counts than the non-pilot districts. Before 2019, the average number of health workers in the two groups remained almost the same, however, the non-pilot districts surpassed the pilot districts since 2019. The number of healthcare institutions (Panel C in Figure 1) remained comparatively stable before 2017, then followed by a gradual increase until 2019. A contraction emerged since 2020, and the downward trend was followed by a modest rebound until 2023. On the output side, both outpatient visits (Panel D in Figure 2) and inpatient visits (Panel E in Figure 2) displayed the complex fluctuation patterns, and the directional movements of pilot and non-pilot districts remained broadly aligned throughout the study period. However, the pilot districts consistently showed higher outpatient and inpatient visits than the non-pilot districts. A sharp decline in both output indicators was observed during 2020–2021, followed by a steady recovery from 2022 to 2023.
The time trend of health resource of PHC system in Sichuan province from 2013 to 2023.

Figure 1. Long description
Three line graphs depict the trends in health resources of the primary healthcare system in Sichuan province from 2013 to 2023. Panel A: A line graph shows the average number of hospital beds from 2013 to 2023. The y-axis represents the average number of hospital beds ranging from 700 to 900, and the x-axis represents the years from 2013 to 2023. Three lines are plotted: not_pilot (blue), pilot (red), and all (green). The pilot line shows a higher average number of hospital beds compared to not_pilot and all, with a peak around 2018 and a slight decline thereafter. Panel B: A line graph shows the average number of health workers from 2013 to 2023. The y-axis represents the average number of health workers ranging from 1200 to 1800, and the x-axis represents the years from 2013 to 2023. Three lines are plotted: not_pilot (blue), pilot (red), and all (green). The not_pilot line shows a steady increase, while the pilot line shows a slight decline after 2019. Panel C: A line graph shows the average number of primary healthcare institutions from 2013 to 2023. The y-axis represents the average number of primary healthcare institutions ranging from 380 to 460, and the x-axis represents the years from 2013 to 2023. Three lines are plotted: not_pilot (blue), pilot (red), and all (green). The pilot line shows a peak around 2018 and a subsequent decline, while the not_pilot and all lines show a more stable trend.
The time trend of health service of PHC system in Sichuan province from 2013 to 2023.

The health resource allocation efficiency of the PHC system
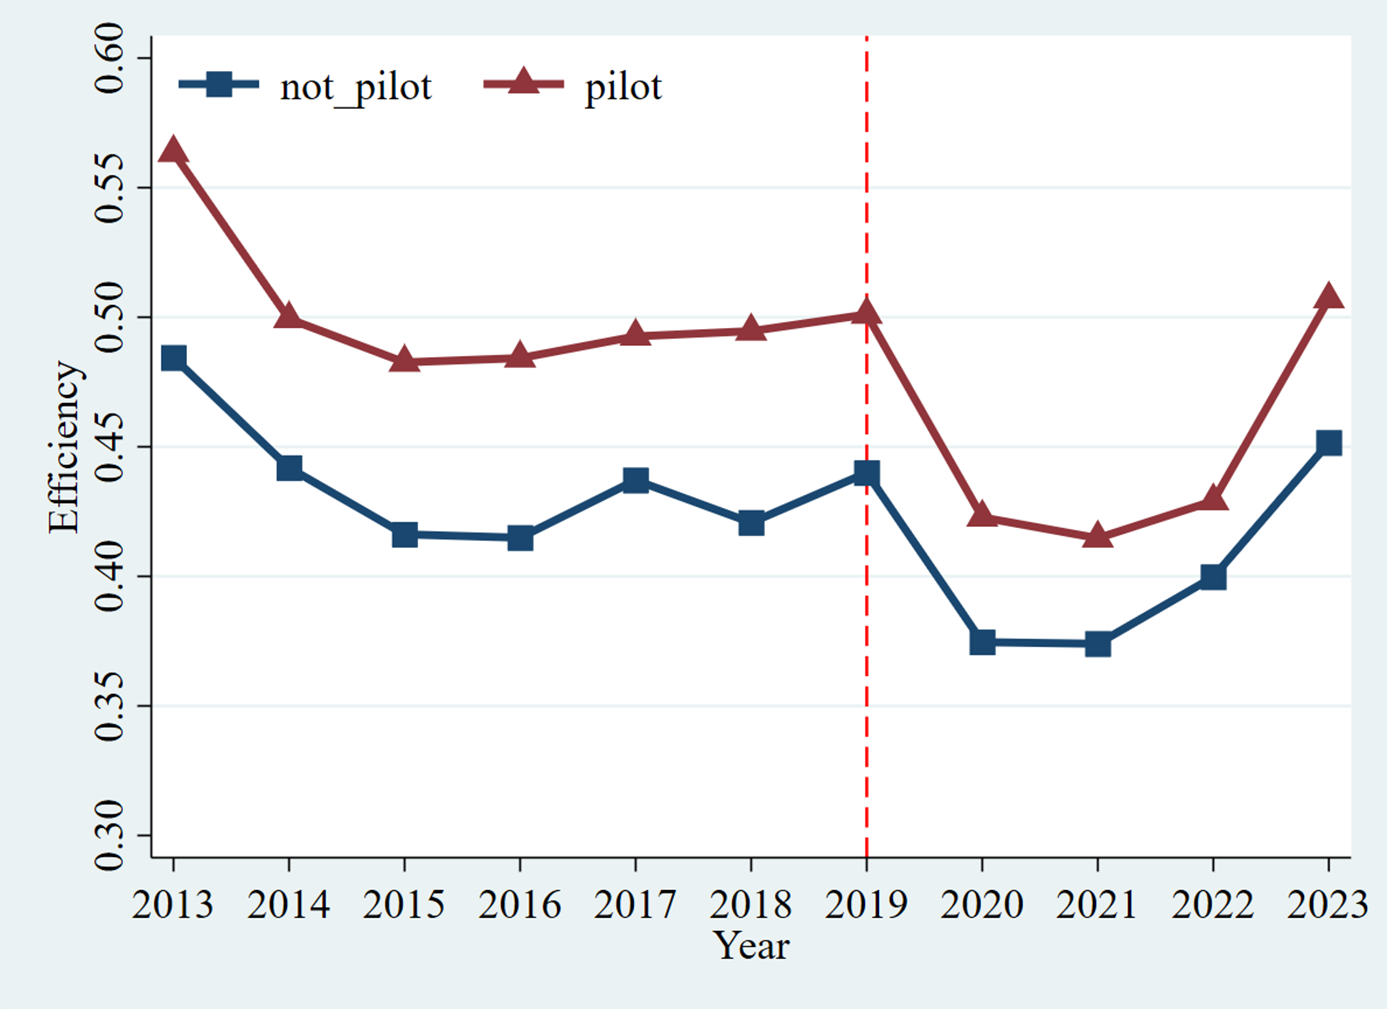
The efficiency of the PHC system in almost all county-level districts was lower than one, only a few districts in some years had efficiency values which was greater than one (Supplementary Table 2). As shown in Figure 3, from 2013 to 2015, the average efficiency of both the pilot and the non-pilot group declined rapidly, thereafter, it increased slowly until 2019. In 2020, the average efficiency encountered a sharp decline, but then, it showed an upward trend since 2022. In addition, the average efficiency of the pilot group was consistently greater than that of the non-pilot group.
The average health resource allocation efficiency of PHC system in the control and intervention group from 2013 to 2023.

Benchmark DID analysis
Parallel trend test
Taking 2018 as the reference, this study first estimated the year-specific dummy coefficients based on the full sample spanning 2013–2023. The results revealed that the coefficient for 2013 was statistically significant, which indicated a violation of the parallel trends assumption. And the coefficients for 2014–2017 remained statistically insignificant (Figure 4). Then, the data of 2013 was drop and the parallel trends test was reconducted. The results showed that none of the pre-policy year dummies (2014–2018) were statistically significant (Figure 5), suggesting that there was no significant pre-existing trend difference between the pilot and non-pilot groups. In view of the results above, the parallel trend assumption was satisfied when excluding the data of 2013, and the subsequent DID analysis was carried out using the data from 2014 to 2023.
The result of parallel trend test including 2013.

The result of parallel trend test excluding 2013.

DID model analysis
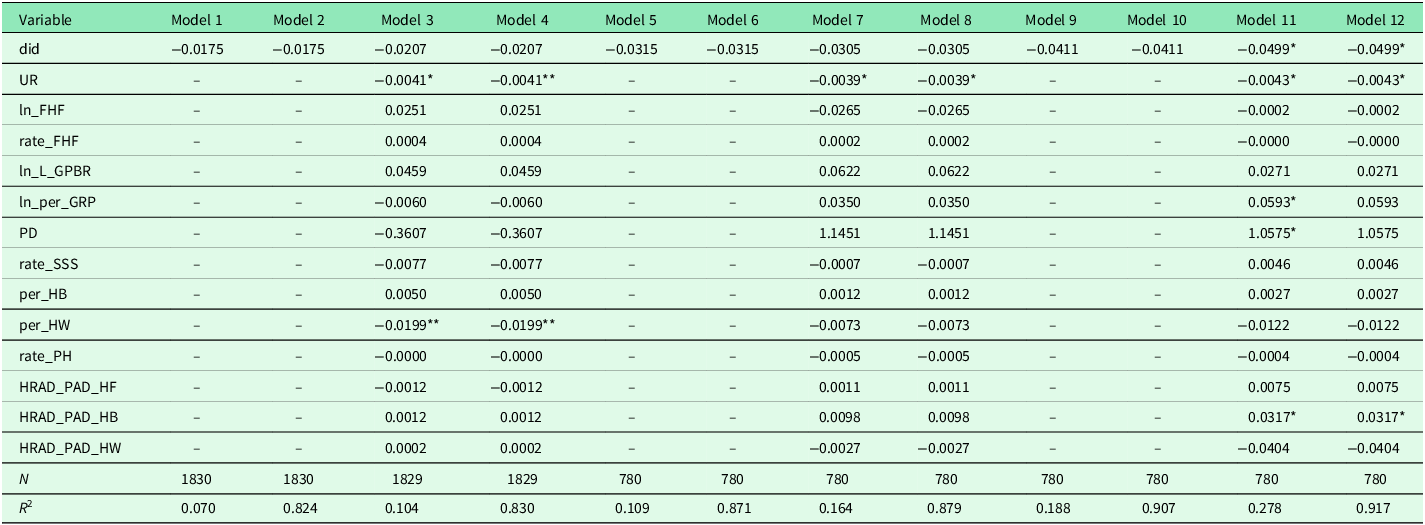
Table 1 presented the benchmark DID regression result. Models 1–2 reported the estimates without control variables, and Models 3–4 was incorporated with 13 control variables. Within each pair, odd-numbered model was estimated by xtreg, fe with year dummies and the even-numbered model by the LSDV approach. The results of all the four models indicated that the coefficient of did (the interaction term between the pilot group and the post-policy period) was negative but failed to reach statistical significance (P > 0.1). In the 2 models without control variables, the coefficient was −0.0175, and it was −0.0207 in both Models 3 and 4 with control variables.
The result of benchmark DID models and PSM-DID models

Table 1. Long description
The table presents the benchmark DID regression results across 12 models. It has 13 rows and 12 columns. The columns are labeled as Model 1, Model 2, Model 3, Model 4, Model 5, Model 6, Model 7, Model 8, Model 9, Model 10, Model 11, and Model 12. The rows are labeled with variables: did, UR, ln_FHF, rate_FHF, ln_L_GPBR, ln_per_GRP, PD, rate_SSS, per_HB, per_HW, rate_PH, HRAD_PAD_HF, HRAD_PAD_HB, HRAD_PAD_HW, N, and R2. Each cell contains numerical values representing the regression coefficients or statistics. The table shows the estimates without control variables in Models 1 and 2, and with 13 control variables in Models 3 to 12. The coefficient of did is negative across all models but fails to reach statistical significance. The values for did range from -0.0175 to -0.0499. The table also includes the number of observations (N) and the R-squared values (R2) for each model.
Note: The full name and definition of the variables was in Supplementary Table 1. Within each pair of model 1 and 2, model 3 and 4, model 5 and 6, model 7 and 8, model 9 and 10, model 11 and 12, both models were two-way fixed-effects DID models, the odd-numbered model was estimated by xtreg, fe with year dummies and the even-numbered model by the least squares dummy variable approach. The two implementations were equivalent in terms of point estimates, but differed in the reported coefficient of determination and in cluster-robust variance, which was owing to the fact that the sandwich formula of xtreg and reg applied different small-sample adjustments and degrees-of-freedom corrections. Model 1 and 2, model 5 and 6, model 9 and 10 were null models, and the other models were incorporated with county-level socioeconomic variables. Model 1–4 were built based on the full data set, model 5–8 based on the full propensity score match dataset, model 9–12 based on the frequency-weighted propensity score match dataset.
**Represented significance at the 5 % level.
*Represented significance at the 10 % level.
Among the control variables, per_HW exerted a statistically significant negative effect on efficiency (β = −0.0199, P < 0.05), suggesting that a simple increase in health worker input did not translate into efficiency gain, and might instead reflect personnel redundancy or misallocation. UR was also negatively associated with efficiency (β = − 0.0041, P < 0.05), hinting at a possible structural mismatch between PHC service demand and supply during urbanization. Other control variables were not statistically significant.
Propensity score matching DID (PSM-DID) analysis
Common support assumption test and balance test
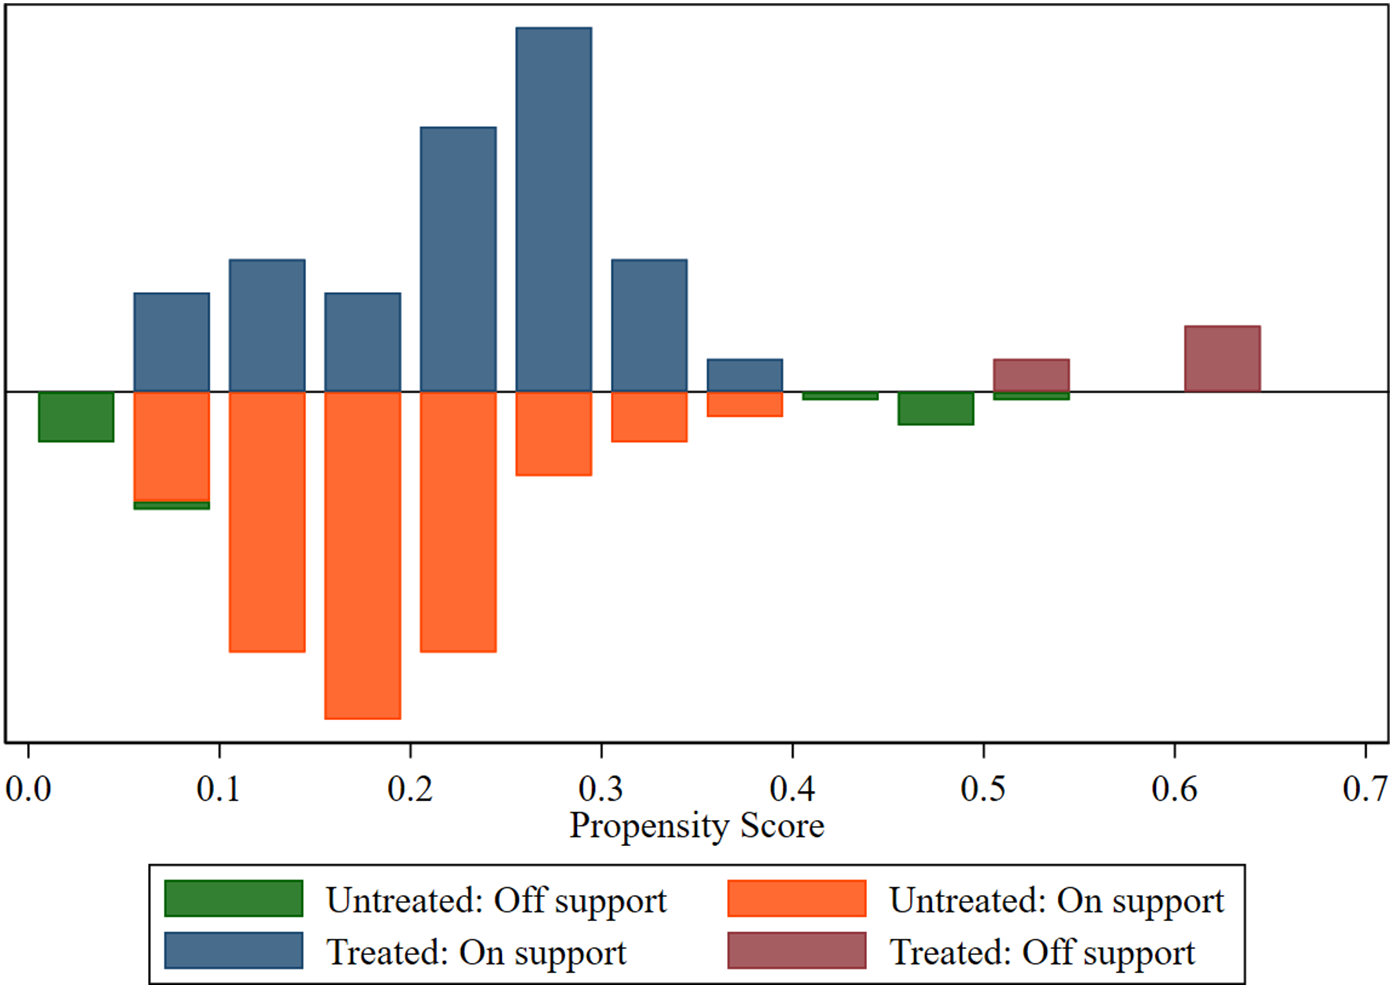
The common support domain assessment was presented in Figure 6. The propensity scores of the pilot group were predominantly concentrated in the 0.15–0.35 range, exhibiting substantial overlap with the non-pilot group across a broad interval. Only a limited number of observations fell outside the region of common support (with propensity scores exceeding 0.45), which indicated a minimal sample attrition. Therefore, the common support assumption was satisfied for a valid PSM estimation.
The result of common support test.

The covariate balance diagnostic before and after PSM was illustrated in Figure 7. Before matching, pronounced imbalance was observed between the two groups across multiple covariates. Following the PSM procedure, the standardized bias for all covariates was reduced to below 20%. The result demonstrated that the PSM procedure effectively eliminated systematic differences in baseline characteristics between the two groups, and substantially enhanced the comparability of the sample.
The absolute deviation of all the control variables.

In addition, the kernel density estimate provided further validation of matching quality (Figure 8). Before matching, the propensity score distribution of the two groups displayed markedly distinct morphologies, the density peak of the non-pilot group was situated at approximately 0.18–0.20, whereas that of the pilot group was located at approximately 0.25–0.28. After PSM, the kernel density curves almost completely overlapped, with both peaks converging at approximately 0.22–0.24. This further confirmed that the PSM procedure achieved sufficient balance between the two groups, which established a robust sample foundation for the subsequent estimation of the net effect of the CCMC policy on the efficiency of the PMC system.
The kernel density before and after PSM.

PSM-DID regression analysis
The result of PSM-DID regression was presented in Table 1. Models 5–8 presented the fitted models, and Models 9–12 presented the weighted models. The coefficient of did was −0.0315 in Models 5–6 and −0.0305 in Models 7–8, none of which reached statistical significance (P > 0.1). However, in the weight model with control variables (Models 11–12), the coefficient of did was −0.0499, which was significant at the 10% level (P < 0.1). This result suggested that, after accounting for matching weights and control variables, the CCMC policy exerted a negative effect on the efficiency of the PHC system.
Sensitivity analysis: excluding COVID-19 pandemic years
After excluding the data of the COVID-19 pandemic period (2020–2022), we repeated all the analytical procedure, including the parallel trend test, balance test, and common support assumption, and all the results were valid under their respective assumptions (see Supplementary Figures 1–4 for details). It should be noted that the coefficient for 2013 was no longer statistically significant in the parallel trend test, so year 2013 was retained in the sensitivity analysis sample.
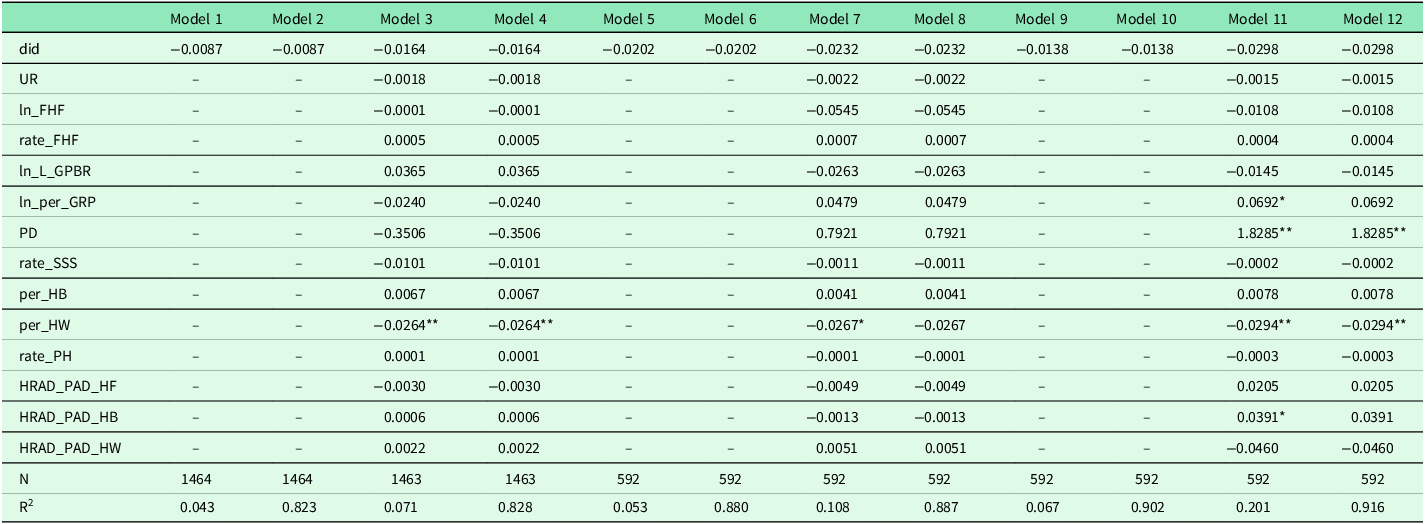
The result of the benchmark DID models and the PSM-DID models was presented in Table 2. In the benchmark DID, the coefficient of did was −0.0087 (Models 1–2) and −0.0164 in (Models 3–4). In the PSM-DID fitted models, the coefficient was −0.0202 (Models 5–6) and −0.0232 (Models 7–8). In the PSM-DID weight model, the coefficient was −0.0138 (Models 9–10) and −0.0298 (Models 11–12). However, all the coefficients were not statistically significant.
The result of benchmark DID models and PSM-DID models after excluding COVID-19 pandemic years

Table 2. Long description
The table presents coefficients from various models, including benchmark DID and PSM-DID models. It has 12 columns labeled Model 1 through Model 12 and 18 rows with different variables. Each cell contains a coefficient value. The table includes variables such as did, UR, ln_FHF, rate_FHF, ln_L_GPBR, ln_per_GRP, PD, rate_SSS, per_HB, per_HW, rate_PH, HRAD_PAD_HF, HRAD_PAD_HB, HRAD_PAD_HW, N, and R2. The coefficients vary across models, with some models showing negative values and others positive values. The R2 values indicate the goodness of fit for each model.
Note: The full name and definition of the variables was in Supplementary Table 1. Within each pair of model 1 and 2, model 3 and 4, model 5 and 6, model 7 and 8, model 9 and 10, model 11 and 12, both models were two-way fixed-effects DID models, the odd-numbered model was estimated by xtreg, fe with year dummies and the even-numbered model by the least squares dummy variable approach. The two implementations were equivalent in terms of point estimates, but differed in the reported coefficient of determination and in cluster-robust variance, which was owing to the fact that the sandwich formula of xtreg and reg applied different small-sample adjustments and degrees-of-freedom corrections. Model 1 and 2, model 5 and 6, model 9 and 10 were null models, and the other models were incorporated with county-level socioeconomic variables. Model 1–4 were built based on the full data set, model 5–8 based on the full propensity score match dataset, model 9–12 based on the frequency-weighted propensity score match dataset.
**Represented significance at the 5 % level.
*Represented significance at the 10 % level.
Discussion
Principal findings and implications for PHC systems
Based on the panel data of 183 county-level districts in Sichuan Province from 2013 to 2023, this study employed the super-SBM DEA model to measure the resource allocation efficiency of PHC systems and applied both benchmark DID and PSM-DID models to evaluate the impact of the CCMC policy on the efficiency of the PHC system. The findings of this study indicated that, both before and after the implementation of the CCMC policy, neither pilot nor non-pilot districts achieved DEA efficiency (efficiency score <1). This finding was broadly consistent with previous studies examining PHC efficiency in China (Niu et al., Reference Niu, Zhang and Ting2018; Zhang and Wang, Reference Zhang and Wang2019; Huang et al., Reference Huang, Li, Shi, Su, Hao, Zhao and Chai2024b; Wan et al., Reference Wan, Ye, Shi, Huang and Huang2026). From the supply-side perspective, persistently low PHC efficiency might stem from excessive resource inputs. In the early stage of health system reform in China, the development of China’s health system was mainly dominated by scale expansion (Jakovljevic et al., Reference Jakovljevic, Chang, Pan, Guo, Hui, Hu, Grujic, Li and Shi2023). Guided by the policy dividend, the great majority of medical institutions had experienced unprecedented expansion in medical resources including hospital beds, occupied area, advanced equipment and other medical facilities. A typical example was the First Affiliated Hospital of Zhengzhou University, the number of beds of this hospital was more than 10,000 (Gou et al., Reference Gou, Hou, Kan, Yao, Zhang, Zhao and Zhou2023), which is almost unimaginable in many other countries in the world. However, there were many such super large-scale hospitals in China, which have brought convenience of medical service to residents at the cost of medical resource waste (Jakovljevic et al., Reference Jakovljevic, Chang, Pan, Guo, Hui, Hu, Grujic, Li and Shi2023).
The PHC system was one of the priority areas of China’s medical reform. Since the launch of the New Healthcare Reform in 2009, the Chinese government has allocated substantial fiscal resources to infrastructure construction and equipment procurement for PHC institutions. (Yip et al., Reference Yip, Hsiao, Chen, Hu, Ma and Maynard2012; Ahmed et al., Reference Ahmed, Hasan, Maclennan, Dorin, Ahmed, Hasan, Hasan, Islam and Khan2019; Ren et al., Reference Ren, Tarimo, Sun, Mu, Ma, Wu and Miao2021; Mei et al., Reference Mei, Kou, Bi, Liu, Huang and Li2023). However, accumulating evidence suggested that efficiency gains did not automatically follow from scale expansion (Wan et al., Reference Wan, Ye, Shi, Huang and Huang2026). Although the Chinese government proposed a series of measures to implement and promote the hierarchical diagnosis and treatment system to guide patients to seek medical service in the PHC system (Yip and Hsiao, Reference Yip and Hsiao2014), residents’ medical-seeking preference of tertiary hospitals had changed a little, resulting in markedly reduced utilization of health service from the PHC system (Mei et al., Reference Mei, Kou, Bi, Liu, Huang and Li2023). The variable analysis in this study further supported the above interpretation. Per_HW was significantly negatively associated with the efficiency of the PHC system (β = −0.0199, P < 0.05), suggesting that quantitative increases in staffing might lead to personnel redundancy and misallocation rather than efficiency improvement. UR was also negatively correlated with efficiency (β = −0.0041, P < 0.05), reflecting potential structural mismatches between PHC service demand and supply during the urbanization process. These findings carry important implications for the PHC system in China: whereas continued resource investment remains necessary, greater attention must be directed toward enhancing managerial efficiency and optimizing resource structure.
Policy effect of CCMC on the efficiency of the PHC system
The core finding of this study was that the coefficients of the policy interaction term did were negative in both the benchmark DID models and the PSM-DID models. However, only the PSM-DID weighted model yielded a statistically significant coefficient at the 10% level (β = −0.0499, P < 0.1), which was consistent with the result of the study conducted by Wei et al. (Reference Wei, Xiang and Long2023). The result above suggested that, based on the observation period and sample scope of this study, the CCMC policy did not demonstrate a clear positive effect on the efficiency of the PHC system, and might even exert adverse influence. That said, it should be emphasized that, given the absence of statistical significance in the majority of model specifications, any inference regarding the policy being ‘ineffective’ or ‘effective’ should be interpreted with great caution. The negative finding might reflect the inherent complexity of policy effect in real-world settings, and could also be attributable to factors such as limited statistical power, sample size constraint, the limited duration of the observation period, and other residual confounding. Therefore, these results should be viewed as exploratory rather than conclusive, and further investigation with longer follow-up and larger samples would be warranted to corroborate the observed patterns.
The CCMC policy was originally designed to optimize resource allocation, promote hierarchical diagnosis and treatment, and strengthen service capacity of the PHC system through vertical integration of county-township-village medical institutions. However, the findings of this study suggested that the CCMC policy had encountered deep-seated institutional barriers in practice. The primary barrier appeared to lie in the absence of an effective multi-sectoral coordination mechanism within the governance structure of the CCMC. A well-functioning CCMC depended, at least to some extent, on the coordinated collaboration of multiple departments, including the Health Insurance Bureau, the Ministry of Human Resources and Social Security, the Ministry of Finance, among others. Nevertheless, the objective functions and interest pursuit of these departments might not be fully aligned (Xiao et al., Reference Xiao, Zhang, Zhang, Morton, Qin and Lin2024). It was observed that the medical insurance department tended to prioritize fund balance and cost containment, the finance department placed greater emphasis on input–output efficiency, the health institutions were more prefer for accessibility and quality of health service, and the human resources department focused primarily on staffing and compensation. This multi-objective and multi-actor governance configuration made it difficult to reach a consensus on the operation of the CCMC, resulting in the formal establishment of the CCMC without deep integration of internal resources (Xu et al., Reference Xu, Zhu, Peng and Chen2024; Cui et al., Reference Cui, Wang and Tao2025). Therefore, the CCMC should be considered as a systematic project. The local government should comprehensively regulate and support the health resources in the medical alliance through policy guidance, medical insurance regulation, and financial support, which could integrate not only different levels of medical institutions, but also the internal medical resource of these institutions (Zhang et al., Reference Zhang, Deng, Yan, Yao, Yu and Zhang2023b).
Second, the absence of a benefit distribution mechanism represented another core bottleneck constraining collaborative incentive within a CCMC. At present, the different departments within the CCMC still maintain separate accounting systems, and a benefit-sharing mechanism has yet to be established. All levels of health institutions within a CCMC had the same incentive to maximize profits, so leading to a certain degree of patient competition among them. In a well-functioning and effective CCMC, county/district hospitals should refer patients with stable conditions to VCs, THCs, CHSs or CHCs and receive corresponding remuneration for management and technical guidance. In return, VCs, THCs, CHSs or CHCs should achieve revenue growth by undertaking more basic diagnostic and therapeutic services. However, in the absence of economic incentive, county/district hospitals in a CCMC tended to sustain their revenues through outpatient service expansion and inpatient care extension, rather than actively diverting patients to township health centres and VCs. The direct consequence for VCs, THCs, CHSs and CHCs was sluggish growth in service volume and difficulty in improving resource utilization, thereby reducing the overall resource allocation efficiency of the entire PHC system. Studies have shown that the CCMC could improve only the total factor productivity efficiency of the leading medical institutions (Feng et al., Reference Feng, Qing, Meng, Lin, Zhang and Zhang2022). Some researchers even believed that the CCMC in China would gradually lead to medical monopoly and further strengthen the patient siphoning effect of tertiary hospitals, which ran contrary to the goal of strengthening the PHC system and activating the hierarchical diagnosis and treatment system (Zhu et al., Reference Zhu, Xin and Qiqing2015; Huang et al., Reference Huang, Wang, Yu and Wang2016). To solve this problem, the Health Insurance Bureau should explore the reform of payment mode to leverage the adjustment function of the medical insurance fund (Ren and Guo, Reference Ren and Guo2021; Huang et al., Reference Huang, Zhang, Liu, Peng, Tan and Feng2024a). For patients, a scientific reimbursement ratio of medical insurance at different levels of medical institutions of the CCMC should be established, which can greatly reduce the medical burden of patients, so that they would seek medical service in the PHC system as intended. For the CCMC, a surplus retention and overspending sharing system based on health performance should be implemented. Only then will the leading medical institution consider the medical alliance as a whole and have the incentive to refer patients to the PHC system (Zhou and Qi, Reference Zhou and Qi2024).
Furthermore, the insufficiency of service capacity of primary-level institutions, coupled with the path dependence of patients’ healthcare-seeking behaviour, imposed a dual constraint on the efficiency of the PHC system (Xu et al., Reference Xu, Gorsky and Mills2020; Liu et al., Reference Liu, Lin, He and Xu2022). Health human resource constituted the core element of the PHC system and represented the key bottleneck constraining efficiency improvements. The PHC system in China was faced with multiple challenges in human resources including insufficient numbers, low professional level, suboptimal structure, and severe attrition (Zhao et al., Reference Zhao, Huang, Zhang and Li2025). Although national programmes such as the Rural Oriented Medical Education Initiative, General Practitioner Special Post Plan, and mandatory rotation of county-level hospital physicians in China have continuously sought to channel health professionals to PHC institutions since 2010, the attractiveness of PHC institutions remained markedly inferior to that of county-level and tertiary hospitals. Although the policy of CCMC required the leading medical institutions to send skilled health personnel to the PHC system to provide technical assistance, such assistance was often driven solely by administrative pressure, making it unsustainable. Since the implementation of the zero-profit drug policy, the income of medical personnel in the PHC system mainly consisted of government salaries and subsidies, which was rather low. At the same time, they bore heavy workload for not only being responsible for the diagnosis and treatment of general diseases, but also for basic public health service, therefore, medical workers were often unwilling to work in PHC institutions. Research has identified that low compensation, limited career development opportunities, and heavy workloads were the primary drivers of workforce attrition in the PHC system (Chen et al., Reference Chen, Zhang, Ma, Yin, Zhao and Jiang2026). Thus, an equitable remuneration strategy should be established to attract and retain health workers to work in the PHC system for the improvement of health service capability (Zhang et al., Reference Zhang, Zhang, Zhou, Xu, Qu, Guo, Wang, Zhong, Gu, Liang, Sa, Wang and Tian2015).
On the other hand, VCs, THCs, CHSs or CHCs in a CCMC exhibited notable gaps compared with district hospitals in terms of equipment configuration and drug supply (Shan et al., Reference Shan, Gan, Yan, Wang, Yin and Wu2024; Xiong et al., Reference Xiong, Huo, Zhou, Bai, He, Zhou, Jia, Quan and Luo2024). In addition, patients’ trust in these VCs, THCs, CHSs or CHCs remained relatively low, and the prevailing healthcare-seeking pattern, characterized by seeking care at district/county or tertiary hospitals even for minor ailments, has not been fundamentally altered (Li et al., Reference Li, Chen and Khan2021; Chen et al., Reference Chen, Sylvia, Wu and Yi2022). This further constrains the scope for long-term improvement in PHC efficiency, which further narrowed the room for sustained improvement in the efficiency of the PHC system.
The COVID-19 disruption and consideration of residual confounding
The sensitivity analysis in this study excluded data from 2020 to 2022, a methodological decision with important implications. The COVID-19 pandemic inflicted unprecedented disruption on China’s healthcare system, with PHC institutions bearing the brunt (Morgan et al., Reference Morgan, Bazemore, Peterson, Phillips and Dai2024). During the pandemic, substantial PHC resources were redirected toward epidemic prevention and control including epidemiological investigation, nucleic acid testing, quarantine site management, and vaccination campaigns, which severely displaced the routine diagnostic and treatment services of the PHC system (Wang et al., Reference Wang, Darmstadt, Rule, Dill, Chen, Zhou, Wu and Rozelle2025a). Research indicated that outpatient and inpatient volumes at PHC institutions nationwide declined dramatically during the pandemic, with decreases exceeding 30% in some regions (Xiao et al., Reference Xiao, Bai, Liu, Cui and Unger2026). This sharp service volume contraction directly affected output indicators in the super-SBM DEA model, leading to systematic declines in efficiency scores. Therefore, including pandemic-period data in the full-sample analysis may have introduced bias into the estimation of the CCMC policy effect due to pandemic interference. The sensitivity analysis results supported this interpretation. After excluding pandemic data, the previously significant negative effect in the PSM-DID weighted model disappeared, and all the coefficients of policy interaction became non-significant while maintaining a negative direction.
This finding suggested that the significant negative effect in the full sample might partially reflect the general efficiency decline of PHC systems under pandemic conditions, rather than the causal effect of the CCMC policy itself. However, it was noteworthy that the consistently negative direction of coefficients in the sensitivity analysis remained unchanged, indicating that even after excluding the pandemic’s extreme disruption, the policy still lacked empirical support for enhancing the efficiency of the PHC system.
Limitation
This study had several limitations. First, the selection of CCMC pilot districts was not strictly random. Although this study employed the PSM-DID method to control selection bias from the observable characteristics, residual confounding from unobservable selective factors (such as local government reform willingness and administrative capacity) might persist. Second, the observation period, particularly the years from 2020 to 2022, experienced severe disruption from the COVID-19 pandemic on PHC service delivery. Although sensitivity analysis excluded this period, the pandemic may have produced lingering effects on the organizational capacity and service models of PHC systems in subsequent years. Third, due to data availability constraints, this study was unable to incorporate service quality, patient satisfaction, and health outcome indicators. The impact of the CCMC policy on the PHC system may manifest not only in resource allocation efficiency but also in dimensions such as service quality and health improvement. Fourth, we only took Sichuan Province as the research setting, which was not representative of other provinces with different socioeconomic characteristics. Based on the limitations above, the results of our study might be biased to some extent and the applicability was limited. Therefore, we plan to carry out further in-depth research based on these limitations above of this study using more representative data in the future.
Conclusion
In conclusion, based on panel data from 183 county-level districts in Sichuan Province, this study employed the super-SBM DEA model and DID/PSM-DID methods to evaluate the impact of the CCMC policy on the PHC system resource allocation efficiency. Our findings indicated that the efficiency of the PHC system remained at low levels both before and after the policy implementation, and the CCMC policy did not demonstrate a statistically significant positive effect on efficiency, with even a negative effect trend under certain model specifications. This finding likely reflected deep-seated contradictions in the governance architecture, benefit distribution mechanisms, PHC human resource constraints, and institutional barriers to hierarchical diagnosis and treatment within a CCMC. Sensitivity analysis showed that the policy effect became non-significant after excluding COVID-19 pandemic interference, though the negative trend persisted, which indicated that the policy effect assessment of CCMC might require a longer time horizon and a more refined research design. Overall, the findings of this study provided empirical evidence for the optimization and adjustment of the CCMC policy especially in terms of health resource allocation, and emphasized the urgency of transitioning from administrative integration to interest integration, reconstructing incentive mechanisms for PHC staff, and strengthening human resource development.
Supplementary material
The supplementary material for this article can be found at https://doi.org/10.1017/S1463423626101959.
Data availability statement
All raw data used and analyzed during this study can be publicly accessed at https://wsjkw.sc.gov.cn/scwsjkw/njgb/tygl.shtml and https://tjj.sc.gov.cn/scstjj/c112132/pic_list.shtml
Author contributions
All authors made substantial contributions to the study conception and design. The two corresponding authors conceived the study and provided study supervision. The first author conducted the data analysis and wrote the first draft of the manuscript. All other authors revised and commented on each version of the manuscript. All authors approved the final manuscript.
Funding statement
This study was funded by the Medical Interdisciplinary Key Project of Sichuan University (202207), and the Frontier Basic Medicine and Innovative Pharmacology Dominated by Biotherapy (20838044G0028).
Competing interests
All the authors have no conflict of interest to declare.
Ethical standards
All the authors adhered to scientific research integrity (Including plagiarism, informed consent, misconduct, data fabrication and/or falsification, double publication and/or submission, redundancy, etc.). The study was granted exemption from ethical review by the Medical Research Ethics Committee of West China Second Hospital, Sichuan University (Ref. No. M08, 30 July 2026), on the grounds that it used publicly available aggregate data. Exemption was sought after the analysis was completed.
Informed consent
Not applicable as the data used in this study was all publicly available.
Patient’s consent
Not applicable as this article does not contain any human participants.








 Open access

