Introduction
The release of dicamba-tolerant soybean [Glycine max (L.) Merr.] has revived concerns about plant growth regulator (PGR) (e.g., WSSA Group 4, 2,4-D or dicamba) injury to non–PGR tolerant soybean varieties that are exposed to low PGR doses due to drift (Al-Khatib and Peterson Reference Al-Khatib and Peterson1999; Andersen etal. Reference Andersen, Clay, Wrage and Matthees2004; Huang etal. Reference Huang, Yuan, Reddy and Zhang2016), vapor movement (Strachan etal. Reference Strachan, Casini, Heldreth and Scocas2010), and/or tank or sprayer contamination (Cundiff etal. Reference Cundiff, Reynolds and Mueller2017). Foliar injury symptoms of non–PGR tolerant soybean to PGR chemicals, which act as the phytohormone auxin, include leaf cupping, epinasty, stunting, and, if the dose is high enough, plant death (Weidenhamer et al Reference Weidenhamer, Triplett and Sobotka1988). Soybean yield reductions due to PGR injury at the end of the season are highly dependent on the dose, soybean growth stage when injury occurs, and climate conditions at and after the injury (Andersen etal. Reference Andersen, Clay, Wrage and Matthees2004; Auch and Arnold Reference Auch and Arnold1978; Steckel etal. Reference Steckel, Chism and Thompson2005).
Postemergent PGR herbicide applications are absorbed rapidly into foliage and translocated throughout the plant (Chang and Vanden Born Reference Chang and Vanden Born1971; Hummel etal. Reference Hummel, Mayer and Clay2005). Petersen etal. (Reference Petersen, Haderlie, Hoefer and McAllister1985) reported that as much as 60% of a radioactive dicamba dose absorbed from the first soybean trifoliate leaf was exuded from the roots within 60 h after application. Endogenous auxin is vital to plant growth and controls root development, including cellular organization, root length, and response to gravity (Overvoorde etal. Reference Overvoorde, Fukaki and Beeckman2010). However, in non–PGR tolerant soybean, an increase in endogenous auxin, creating an imbalance with cytokinin, inhibits root nodule development by reducing nodule primordium formation (Turner etal. Reference Turner, Nizampatnam, Baron, Coppin, Damodaran, Adhikari, Arunachalam, Yu and Subramanian2013; Wang etal. Reference Wang, Li, Chen, Zou, Liu, Tian, Li, Wang, Zhao, Ferguson, Gresshoff and Li2015). Similarly, exogenous application of auxin (2,4-D) to non–PGR tolerant soybean reduced nodule numbers (Nizampatnam etal. Reference Nizampatnam, Schreier, Damodaran, Adhikari and Subramanian2015), although it is unknown if PGR-tolerant soybean exhibits a similar response.
In the literature, there are many USDA Extension bulletins and popular press articles that discuss the benefits and detriments of applying nitrogen (N) to a healthy soybean crop (Davidson Reference Davidson2014; Shapiro Reference Shapiro2017; Schmidt accessed April 20, Reference Schmidt2018). If soybean yield is expected to be 4,053 kg ha−1 or less, then a root system with well-developed nodules theoretically should fix enough N to supply plant needs (Davidson Reference Davidson2014; Shapiro Reference Shapiro2017; Schmidt accessed April 20, Reference Schmidt2018). In areas with higher yield potential (e.g., >4,053 kg ha−1), additional N, applied as a side-dressed or foliar application, has been suggested to maximize soybean yield, as N fixation alone does not have the capacity to provide enough N to the plant (Davidson Reference Davidson2014; LaMenza etal. Reference LaMenza, Monzon, Specht and Grassini2017). However, timing the N application is critical; if it is applied too early, nodulation may be reduced, with no subsequent N fixation (Davidson Reference Davidson2014; Schmidt accessed April 20, Reference Schmidt2018). A review paper on N application to soybean (Mourtzinis etal. Reference Mourtzinis, Gurpreet, Orlowski, Shipiro, Lee, Wortmann, Holshouser, Nafziger, Kandel, Niekamp, Ross, Lofton, Vonk, Roozeboom, Thelan, Lindsey, Staton, Naeve, Casteel, Wiebold and Conley2018) reported that across a wide range of environments and varieties, soybean had limited response to N fertilizers, and in most cases, N application did not increase yield enough to justify the application expense. This led the authors to conclude that N application to soybean is an ineffective method to increase yield.
However, the need for N may differ in PGR-injured soybean, especially if nodulation is reduced. While soybean foliar injury from exposure to PGR herbicides has been well described, the effects of PGR exposure to soybean root nodulation in field studies are undetermined. If exogenous auxin applied in the field has similar nodulation reduction, as reported in laboratory studies (Nizampatnam etal. Reference Nizampatnam, Schreier, Damodaran, Adhikari and Subramanian2015), this may result in reduced N fixation and N stress, which may account for at least part of the measured yield loss reported when soybean injury occurs with PGR herbicides (Andersen etal. Reference Andersen, Clay, Wrage and Matthees2004; Auch and Arnold Reference Auch and Arnold1978; Wax etal. Reference Wax, Knuth and Slife1969; Weidenhamer etal. Reference Weidenhamer, Triplett and Sobotka1988). Therefore, the objectives of this study were to evaluate non–PGR resistant soybean growth, root nodulation, yield, and seed protein and oil content when exposed at low, sublethal (akin to drift or tank contamination) rates of PGR herbicides applied once or twice at various growth stages. Nitrogen was applied to soybean at 5 or 10 d after the PGR application or soybean was left untreated. The null hypotheses of these studies were that PGR-injured soybean would not have reduced nodulation and that applying N to these soybeans would not impact measured parameters.
Materials and methods
Location and treatments
This research was conducted at two South Dakota State University Experimental Research farms, Aurora (44.283°N, 96.686°W) and Southeast Research Farm (located near Beresford, SD) (43.081°N, 96.776°W), in 2015 and 2016. Soybean followed corn (Zea mays L.), and plots were established after spring tillage. At Aurora, the soil was a Brandt silty clay loam (fine-silty, mixed, superactive, frigid Calcic Hapludolls), with residual inorganic N in the 0- to 15-cm depth of about 30 kg ha−1. Roundup Ready® 2 soybean variety (‘AG1431’, relative maturity [RM] 1.4; Asgrow®, Monsanto St. Louis, MO) was planted on May 20, 2015, and May 19, 2016. At Beresford, the soil was an Egan silty clay (fine-silty, mixed, superactive, mesic Udic Haplustolls) with a residual inorganic N in the 0- to 15-cm depth of about 33 kg ha−1. Roundup Ready® 2 soybean varieties were planted on May 28, 2015 (‘2207’, RM 2.2; Channel®, Monsanto St. Louis, MO) and on June 3, 2016 (‘P20T79R2’, RM 2.0; Pioneer®, DuPont, Johnston, IA). The seeding rate was 395,200 seeds ha−1, and row spacing was 76 cm for all plots.
The trial was replicated in four blocks at Aurora (2015 and 2016) and Beresford (2016) and three blocks at Beresford (2015). A split-plot randomized complete block design was used with subplot dimensions of four rows wide by 23-m long at Aurora and 14-m long at Beresford. In 2015, the main plot treatments were no herbicide and 2,4-D or dicamba applied as a single application at V1, V3, or R (R1 at Aurora and R2 at Beresford) or as a double application at V1 + V3, or V3 + R (Table 1). The main plots were split by foliar N application, early (about 6 d after the herbicide application), late (about 12 d after the herbicide application), or no N applied. The non-herbicide controls were treated with N at the same timings to enable comparison with the respective herbicide treatments. In 2016, the main plots had dicamba applied at V1, V3, V5, V1 + V3, and V3 + V5, or no herbicide application (Table 2). The herbicide plots were split into N treatment subplots with no N applied or N applied early or late as either a foliar or soil application.
Dates and soybean phenology at the times of herbicide application (2,4-D or dicamba), foliar nitrogen (N) application (early or late), and in-season sampling at Aurora and Beresford, SD, sites in 2015

a Herbicide treatment for single applications were 32 g ae ha−1 for 2,4-D or 1 g ae ha−1 for dicamba, whereas the double applications were 64 g ae ha−1 for 2,4-D and 2 g ae ha−1 for dicamba.
b Nitrogen treatment = 47.5 kg N ha−1 applied as a foliar treatment. Foliar N source was Super 72™ (The Andersons, Maumee, OH).
c Early N for the V1 + V3 herbicide application was applied after V1 application, and late N was applied after the V3 application.
d Early N for V3 + R treatment at both locations was applied after the last R herbicide application, and late N was applied about 10 d later.
Dates and soybean phenology at the times of dicamba application, nitrogen application (soil or foliar and early or late), and in-season sampling at Aurora and Beresford, SD, sites in 2016

a Dicamba as a single application was applied at 1 g ae ha−1; the double application had a total of 2 g ae ha−1, 1 g ae ha−1 for each treatment.
b N treatment = 47.5 kg N ha−1 as either a soil-applied (urea coated with nitrogen stabilizer and polymer-coated urea) or foliar-applied (24% N + 1% sulfur) treatment.
c Early N for V1 + V3 and V3 + V5 treatments at both locations was applied after the V3 or V5 herbicide application, and the late N was applied about 10 d later.
In 2015, the rates of 2,4-D were 32 g ae ha−1 (2,4-D Amine 4, Winfield Solutions, Decatur, AL) (3% of the maximum label rate of 1.06 kg ha−1 for corn) for the single application and 64 g ae ha−1 (32 g ae ha−1 applied at each date) for the double application. The rates of dicamba in 2015 and 2016 were 1 g ae ha−1 (Clarity®, BASF, Research Triangle, NC) for a single application (0.1% of the maximum label rate of 0.84 kg ha−1 for corn), and 2 g ae ha−1 for the double application. All herbicide treatments were applied using a four-nozzle (8005 XR TeeJet®, TeeJet Technologies, Springfield, IL) CO2 backpack sprayer. Pressure was 275 kPa and delivered at 327 L ha−1. A nonionic surfactant was added at 0.5% (v/v) to all herbicide treatments.
The 2015 N treatment was a foliar application of 47.6 kg N ha−1 of Super 72™ (The Andersons, Maumee, OH) that contained 28% N, of which 72% was in a slow-release form. In 2016, the foliar N applications were NResponse™ (AgroLiquid, St Johns, MI) that contained 24% N and 1% sulfur with an application rate of 47.1 kg N ha−1. The 2016 soil N application was a mixture of urea-coated with N-Fixx® (Helena, Collierville, TN) at 23.5 kg N ha−1 + ESN® Smart Nitrogen (polyurethane-coated urea; Nutrien, Saskatoon, SK, Canada) at 23.5 kg N ha−1 for a total N of 47 kg N ha−1.
Sampling
In 2015, in-season samples for plant greenness, soybean biomass, and nodulation were collected at the R2 growth stage (July 16, Aurora; July 20, Beresford) (based on the growth stage of the nontreated controls) for the V1, V3, and V1 + V3 treatments (Table 1). Plots with the late herbicide treatment (R1, Aurora; R2, Beresford) were sampled at R3 (July 30, Aurora; July 29, Beresford). In 2016, all treatments were sampled when the nontreated controls were in the R3 stage of growth (July 18, Aurora; August 3, Beresford) (Table 2).
Plant greenness was determined on the topmost fully expanded leaflet of four plants per subplot using a Minolta SPAD-502 chlorophyll meter (Spectrum Technologies, Aurora, IL). The relative greenness value has been related to the amount of leaf chlorophyll and N status (sufficient/deficient) of the plant (Bullock and Anderson Reference Bullock and Anderson1998). These four plants were then cut at soil level and dried at 60°C to constant weight, and dry biomass was determined on a per-plant basis.
A 10-cm-deep soil core (soil volume = 850 cm3) was obtained using a 10.8-cm-diameter hole cutter for golf greens. The cutter was centered over stems of the plants cut for biomass with soil bulked by subplot. Soil was removed from the roots by creating a slurry with 0.1 M hexametaphosphate solution to disperse the soil. The slurry was screened through a 2-mm sieve, materials remaining on the sieve were washed, and nodules were counted. Intact roots also were washed, and fully formed and immature nodules remaining on the roots were counted. Average root nodule count per treatment was calculated. While the entire soybean root system was not excavated, the numbers provide relative relationships among treatments, as the soil volumes obtained from each treatment were similar.
Soybean grain from the two middle rows was harvested at soybean physiological maturity using a Massey Ferguson 8 plot combine (Duluth, GA). Soybean harvest occurred on October 9 (Aurora) and October 15 (Beresford) in 2015; and on October 13 (Aurora) and October 27 (Beresford) in 2016. Grain was weighed, and yield (kg ha−1 at 13% moisture) was calculated based on harvest area. Seed protein and oil content were obtained on whole seed using near-infrared transmittance spectrosopy (Infratec® 1229 Grain Analyzer, Foss Tecator AB).
Data analyses
Blocks (B) were considered the random variable. Treatment (herbicide, N application, and their respective time and/or placement) were considered fixed variables. ANOVA analysis for a split-plot design was conducted using library(agricolae) (De Mendiburu Reference De Mendiburu2009) in R (R Core Team 2017). Data were separated by year, because PGR and N treatments differed, and location, because soybean varieties differed. Data then were compared using LSD, if the appropriate F-test was above the critical value at P < 0.05. Main plots (T) were analyzed by PGR herbicide and application timing and compared with appropriate nontreated controls using an F-test and the mean square error of the T by B interaction (error a) as the error term (Steel and Torrie Reference Steel and Torrie1980). The N treatment (subplot) differences used the residual error term B*T*N interaction (error b) for the F-test. Because 2015 in-season samples from the early (V1, V3, and V1 + V3 treatments) PGR treatments were sampled 9 to 14 d before the late PGR treatments, these data were compared within (but not across) each sampling date.
Results and discussion
Climate 2015 and 2016
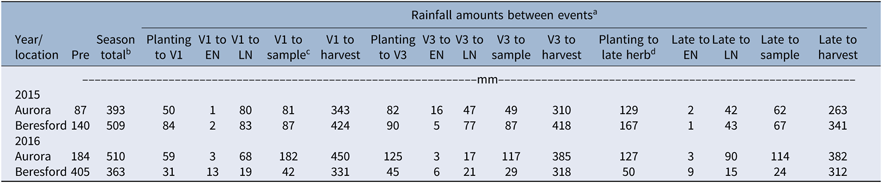
Growing degree days (base 10°C) from planting to harvest totaled 1,242 and 1,337 at Aurora for 2015 and 2016, respectively (South Dakota Mesonet 2018). At Beresford, GDD totals were 1,337 and 1,428, respectively. These values were within 10% of the 20-yr (1990 to 2010) seasonal average for each location. Rainfall from planting to harvest at Aurora and Beresford totaled 393 and 509 mm, respectively, in 2015, and 501 and 363 mm, in 2016, respectively (Table 3). Rainfall from January 1 of each year to planting averaged about 100 mm at each location in 2015. In 2016 these totals were 184 mm at Aurora and 405 mm at Beresford. This early-season rainfall at Beresford delayed planting by about 10 d compared with more typical years.
Preseason precipitation from January 1 to planting, in-season rainfall totals, and rainfall amounts between planting and herbicide application, from herbicide application up to nitrogen (N) application up, from herbicide application up to in-season sampling, and from herbicide application up to soybean harvest for Aurora and Beresford, SD, locations in 2015 and 2016

a Abbreviations: EN, early application (within 5 d of herbicide application); LN, late application (about 10 d after herbicide application); Pre, precipitation total from January 1 until planting.
b Season total is total rainfall from planting to harvest.
c In-season sampling occurred July 16 (R2) for the V1 and V3 herbicide treatments and corresponding N alone treatments and nontreated control, and July 30 (R3) for late herbicide treatments and corresponding N alone treatments and nontreated control, Aurora 2015; July 20 (R2) for V1 and V3 herbicide treatments, and corresponding N alone treatments and nontreated control, and July 29 (R3) for late herbicide treatments and corresponding N alone treatments or nontreated control, Beresford, 2015; July 18 (R3) for all treatments Aurora, 2016; and August 3 for all treatments Beresford, 2016.
d Late herbicide application occurred at R1 at Aurora and R2 at Beresford, 2015; V5 at Aurora and Beresford, 2016.
Rainfall (amounts and timing) affected planting date, plant growth, timing of applications, potential wash-off of foliar applied treatments, and, in 2016, the uptake of soil-applied fertilizer. Rainfall amounts for each season, between treatment applications, and after application to the in-season sampling are provided in Table 3. At Aurora in 2015, about 1.5 mm of rain fell after all PGR applications up before the early N application. However, because PGR herbicides are readily absorbed into the plant after application (60% or more within 24 h after treatment; Chang and Vanden Born Reference Chang and Vanden Born1971; Hummel etal. Reference Hummel, Mayer and Clay2005), PGR uptake should not have been compromised. Total rainfall after the PGR applications up to late N applications averaged 46 (+2 mm). The rainfall amounts from V1, V3, and R1 PGR applications up to in-season sampling were 81, 48, and 62 mm, respectively. In 2016, less than 3.3 mm of rain fell after all timings of dicamba application before early N application. When in-season sampling was done, precipitation amounts after the late N application totaled 182, 117, and 114 mm for the V1, V3, and V5 dicamba application treatments, respectively, which should have aided in N uptake from the soil-applied treatment.
At Beresford in 2015, rainfall was 5 mm or less after each PGR application up to early N application. About 141 mm of rain fell after the V1 and V3 PGR application up to in-season sampling, whereas the rainfall totaled 67 mm from R2 PGR application up to in-season sampling. In 2016, about 10 mm of rain fell about 48 h after V1 and V5 dicamba applications, but before early N application. However, about 5.8 mm of rain fell within 24 h after the V3 dicamba application, which may have lessened dicamba uptake. The rainfall total after the late N application up to in-season sampling was 22 mm for the V1 treatment but only 9 mm for the V3 and V5 dicamba treatments. Therefore, late soil N treatments most likely had no impact on soybean plants at the in-season sampling due to the low rainfall amount. However, by harvest, rainfall amounts were >300 mm after all N treatments, which should have provided an environment that contributed to N uptake from soil-applied treatments.
In-season sampling measurements
2015 plant biomass
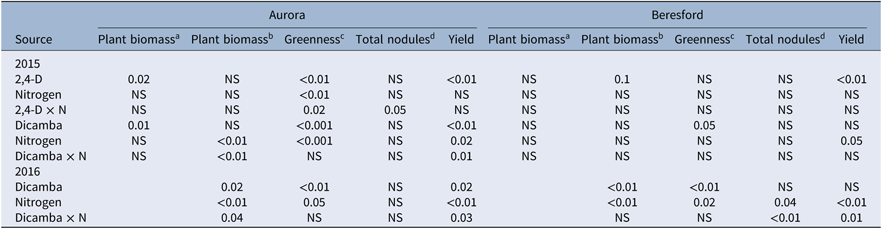
At Aurora in 2015, the main effect of 2,4-D and dicamba treatments applied at V1, V3, and V1 + V3 reduced plant biomass taken at the early (R2) timing (Table 4). Biomass for 2,4-D and dicamba treatments at V1, V3, and V1+ V3 timings averaged 20% less (average dry weight = 10 g plant−1) than nontreated controls (average dry weight = 12.4 g plant−1) (P = 0.01). Plant biomass for 2,4-D treatments at R1 and V3 + R1 was similar to the nontreated control. However, soybean biomass was reduced by as much as 25% when dicamba applied at R1 or applied at V3 + R1 was followed by an early N application, and there was a 10% reduction with a late N application compared with nontreated control (unpublished data) (P < 0.01).
P-value of the F-test from ANOVA analysis that examined the effects of herbicide (2,4-D and dicamba in 2015; dicamba in 2016) and nitrogen (applied foliar early and late in 2015; applied foliar or soil, early and late in 2016) treatments and the herbicide by nitrogen interaction on measured parameters

a Plant biomass taken at R2 stage of soybean growth for V1, V3, and V1 + V3 treatments.
b Plant biomass taken at the R3 stage of growth for V3 + R1 and R1 treatments in 2015; biomass for all treatments 2016.
c Greenness measured with a Minolta SPAD-502 chlorophyll meter (Spectrum Technologies, Aurora, IL).
d Average total nodules (mature nodules plus immature primordia observed on the plant root) per plant.
At Beresford in 2015, plant biomass was similar among all PGR, N, and PGR by N interaction controls regardless of PGR or N timing (Table 4). The biomass of the V1 and V3 treated plants averaged 7 g plant−1, whereas plants sampled 1 wk later for the V3 + R1 and R1 treatments averaged 15 g plant−1.
2015 SPAD measurement
The relative greenness of the soybean plants was impacted by 2,4-D at Aurora and dicamba applications at both locations (Table 4). Plants treated with 2,4-D or dicamba at all timings, except V1 single application, had a relative greenness about 10% greater (average greenness = 33) than nontreated plants (average greenness = 30) (unpublished data). Typically, plants susceptible to PGR herbicides at labeled rates turn yellow (Andersen etal. Reference Andersen, Clay, Wrage and Matthees2004) due to chlorophyll destruction and lack of chlorophyll replacement. However, at sublethal levels, PGR herbicides act as phytohormones that can stimulate photosynthetic pigments and plant growth (Piotrowska-Niczyporuk and Bajguz Reference Piotrowska-Niczyporuk and Bajguz2014). Plants that received the early N application at Aurora had a relative greenness about 5% greater (P < 0.01) than those that were not treated with N, whereas at Beresford, N applications did not influence relative greenness.
2015 nodulation
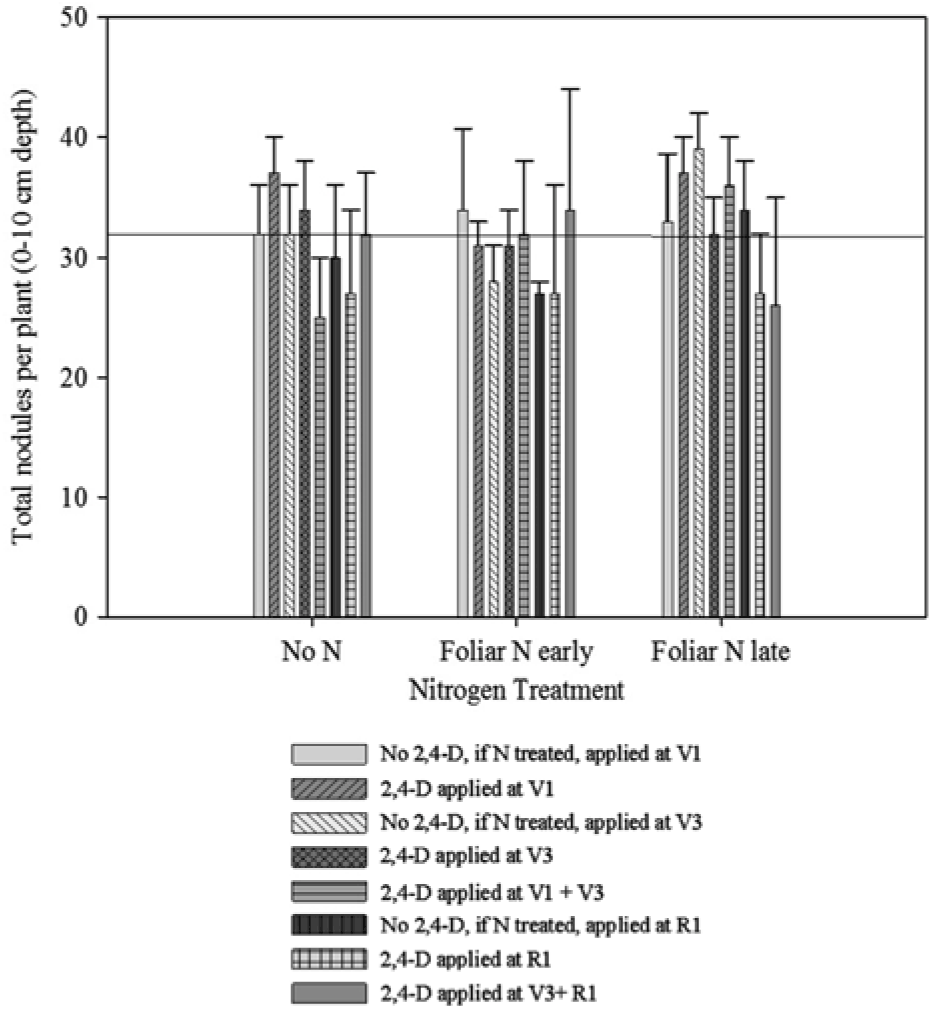
Mature nodules accounted for greater than 90% of the total nodule (mature plus immature primordia observed when examining roots) number for all treatments. At Aurora, total nodule numbers averaged 31 plant−1 for no herbicide/no N controls, and numbers were reduced by 10% for the 2,4-D applied at V3 + R1 and both early and late N treatments (Figure 1).
Total nodules per plant (0- to 10-cm depth by 10-cm diameter) at in-season sampling as influenced by 2,4-D treatment timing (stage of soybean growth) and nitrogen treatment (none, foliar early, or foliar late) treatments at Aurora, SD, in 2015. Samples for the V1, V3, and V1 + V3 treatments were taken at R2 (July 16), whereas R1 and V3 + R1 samples were taken at R3 (July 30). The line represents the average number of nodules for the no 2,4-D/no N treatment. LSD(0.05) = 7.

2016 in-season measurements
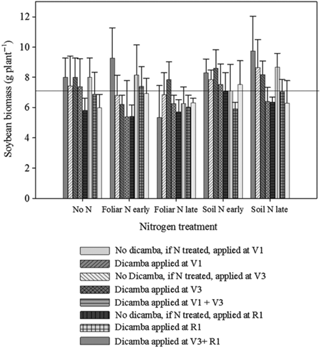
In 2016, only dicamba was used, and N was applied as foliar and soil-applied treatments. Sampling of all treatments occurred on the same day, so that direct comparisons were accomplished for the in-season sampling factors. At Aurora, the dicamba treatment by N application interaction was significant (P = 0.04) (Figure 2). Biomass was reduced by several dicamba applications, and adding N, especially foliar N (either early or late), produced the greatest reductions. At Beresford, each main effect (dicamba [P < 0.01] and N [P < 0.001]) influenced biomass, but the interaction was not significant. The greatest reductions were observed in the double applications of dicamba, which averaged 7 g plant−1, whereas other treatments averaged 9 g plant−1. Plants treated with the early application of foliar N averaged 6 g plant−1 compared with about 10 g plant−1 for other N treatments.
Soybean biomass as influenced by dicamba treatment timing (stage of soybean growth) and nitrogen treatment (none, foliar early, foliar late, soil early, or soil late). In-season samples were collected at R3 (July 18) in 2016 at Aurora, SD. Values below the line differ from the no dicamba/no N treatment. LSD(0.05) = 0.94 g plant−1.

Relative greenness for all dicamba-treated plants was 30% greater at Aurora and 10% greater at Beresford compared with nontreated controls. The total number of nodules per plant was unaffected by N or dicamba treatments at Aurora. At Beresford, the double dicamba treatments averaged 13 nodules plant−1 compared with 20 nodules plant−1 for nontreated or single dicamba treatments. Plants in the soil N treatments had more nodules than those treated with foliar N early applications (19 vs. 14, respectively) (P = 0.04). This may have been due to low rainfall after the soil N application, such that little N was taken up, or sample collection was so soon after application that N had no influence on nodulation.
Yield and yield parameters
2015
Soybean yield for the no herbicide/no N control at Beresford averaged 4,250 kg ha−1. The N treatment and herbicide (2,4-D or dicamba) treatment by N interaction were not significant. However, the main effect of herbicide treatment was a significant parameter. Yield reductions of 25% were observed when 2,4-D was applied twice, either V1 + V3 or V3 + R2, (P = 0.01), whereas an 11% yield loss was observed for plants treated with dicamba at R2 (P = 0.12).
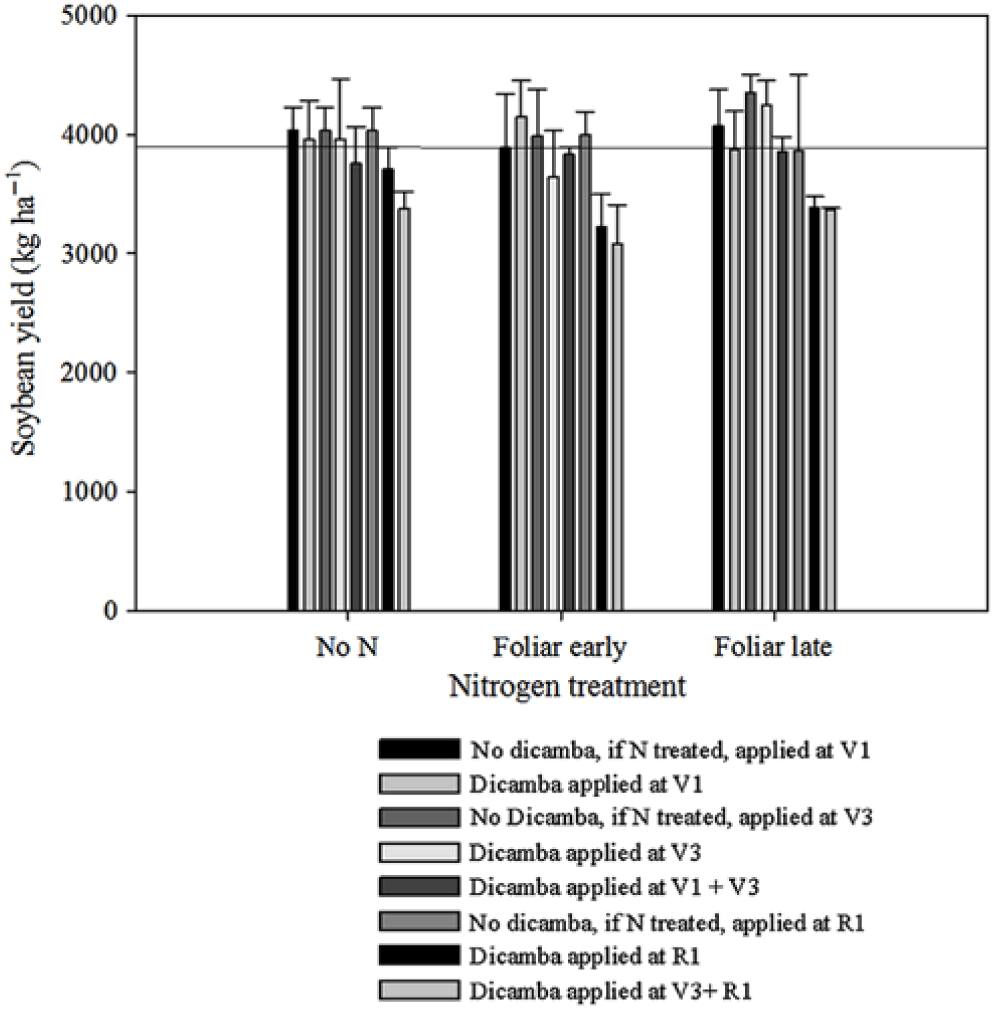
Soybean yield for the no herbicide/no N control at Aurora averaged 4,050 kg ha−1. The main effects of 2,4-D application or N and 2,4-D by N interaction were not significant (P > 0.15). However, the dicamba by N interaction was significant (P = 0.01). The V3 + R1 treatments that were treated with N had 16% yield loss if treated with late N and 24% yield loss if treated with N compared with the no dicamba/no N treatment. Plants with N applied as an early treatment soon after dicamba application had a 10% loss for the V3 dicamba application, and a 20% loss if dicamba was applied at R1. When N was applied later for both of these treatments, losses were 8% or less.
Protein was 2% greater in seed from 2,4-D–treated plants (∼345 g kg−1) than nontreated plants (339 g kg−1) (P < 0.01); however, there was a concomitant decrease in oil (196 g kg−1 in 2,4-D treatment vs. 199 g kg−1 in nontreated controls). These protein and oil contents were within the average range of the 2016 U.S. soybean crop from midwestern states (protein from 315 to 362 g kg−1 and oil from 185 to 207 g kg−1) (United Soybean Board accessed July 16, 2018). The trend for increased protein when oil is decreased is frequently reported (United Soybean Board accessed July 16, 2018) and is often a response to stress, especially stress in early reproductive stages (Bellaloui etal. Reference Bellaloui, Bruns, Abbas, Mengistu, Fisher and Reddy2015).
2016
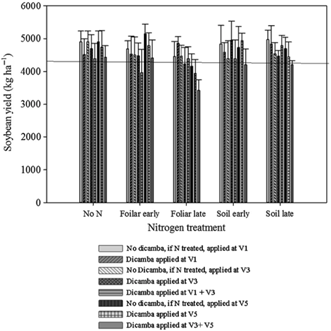
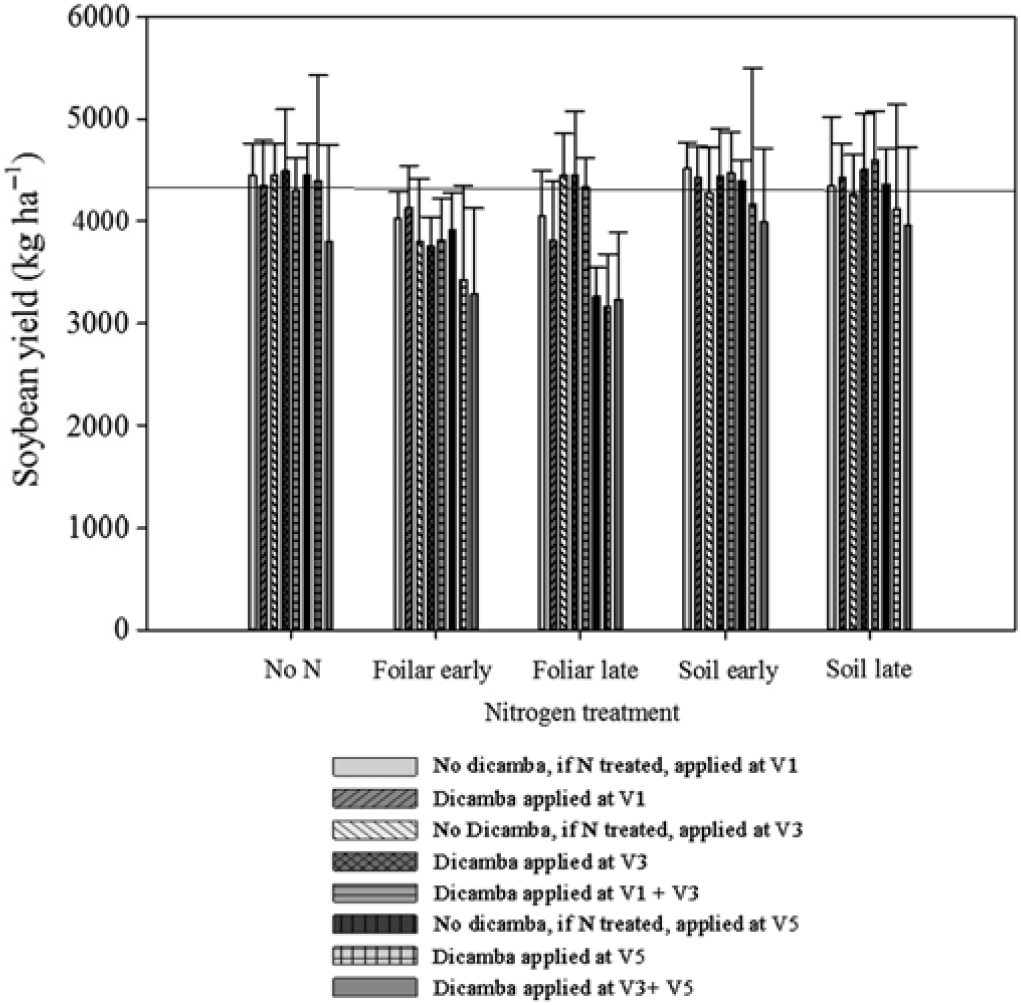
Soybean yields in the no dicamba/no N treatments averaged 4,600 kg ha−1 at Aurora and 4,200 kg ha−1 at Beresford. The dicamba by N treatment interaction for yield was significant at both locations (P < 0.05). Plants that received no N after any dicamba treatment had similar yields to the no dicamba/no N control, except at Beresford with the V3 + V5 treatment, where yield loss averaged 10%. Applying soil N to any treatment at any time did not influence yield.
Foliar N treatments had the greatest negative influence on yield (Figures 3–5). The late foliar N treatment after V3 + V5 dicamba treatment at Aurora had the greatest impact and reduced yield by 30%. Early foliar N treatments reduced yields of the V3 + V5 dicamba treatment by 10% and the V1 + V3 dicamba treatment by 20%. The late foliar application reduced yield of the V1 + V3 dicamba treatment by 10%, the V3 dicamba treatment by 15%, and the V5 dicamba treatment by 20%. At Beresford, late foliar N treatments after dicamba applied at V3, V5, or V3 + V5 reduced yield by about 25%, whereas plants treated with early foliar N after these same dicamba treatments averaged yield losses of about 15%. Seed protein and oil content were similar among all treatments.
Soybean yield as influenced by dicamba treatment timing (stage of soybean growth) and nitrogen treatment (none, foliar early, or foliar late) interaction (P = 0.01) at Aurora, SD, in 2015. Values below the line differ from the no dicamba/no nitrogen check. LSD(0.05) = 142 kg ha−1.

Soybean yield as influenced by dicamba treatment timing (stage of soybean growth) and nitrogen treatment (none, foliar early, foliar late, soil early, or soil late after dicamba application) interaction (P = 0.03) at Aurora, SD, in 2016. Values below the line differ from the no dicamba/no nitrogen control. LSD(0.05) = 600 kg ha−1.

Soybean yield as influenced by dicamba timing (stage of soybean growth) and nitrogen treatment (none, foliar early, foliar late, soil early, or soil late) interaction (P = 0.01) at Beresford, SD, in 2016. Values below the line differ from the no dicamba/no nitrogen control. LSD(0.05) = 104.

Producers often ask about applying N to soybean. A review by Mourtzinis etal. (Reference Mourtzinis, Gurpreet, Orlowski, Shipiro, Lee, Wortmann, Holshouser, Nafziger, Kandel, Niekamp, Ross, Lofton, Vonk, Roozeboom, Thelan, Lindsey, Staton, Naeve, Casteel, Wiebold and Conley2018 pg 80) stated, “Overall, the limited responses to N effects in our study, as well as the costs associated with N application, indicate that these small positive effects would be unlikely to result in positive economic returns from N fertilization decisions.” In our study, N did not diminish the impact of PGR herbicides that were applied at rates akin to drift or tank contamination.
However, one of the understudied impacts of PGR herbicides is the impact on nodulation under field conditions, as nodulation under laboratory conditions has been reported to be reduced when exogenous auxin is present (Nizampatnam etal. Reference Nizampatnam, Schreier, Damodaran, Adhikari and Subramanian2015). If nodulation is reduced, especially in areas where the theoretical limit of nodulation just keeps up with plant demand, N application at an optimal time may maintain yield. We observed reduced nodulation with PGR–N interaction in two environments, but more definitive research is needed to determine whether this response is consistent under field conditions when inoculated soybean seed is present. One of the limitations of this study was that only the upper portion of the soybean root system was examined. However, because seed was inoculated, most nodules were expected to form on the root crown (0- to 5-cm depth) (Hardarson etal. Reference Hardarson, Golbs and Danso1989), with peak nodulation activity between R2 and R5 (pod set) (Abendroth etal. Reference Abendroth, Elmore and Ferguson2006). According to Lofton and Arnall (Reference Lofton and Arnall2017), a well-nodulated soybean plant should have from 25 to 100 root nodules. The nodule numbers at Aurora were in this range; however, at Beresford, nodule numbers were in the low 20s, even without PGR treatment. Unfortunately, nodule activity was not examined, but seed protein and yield were not influenced by the additional N.
One explanation of why PGR effect on nodulation was not as pronounced as we expected is that PGR herbicides can be metabolized and/or conjugated to inactive end products in soybean. About 70% of 2,4-D can be metabolized or conjugated in soybean to form water-soluble and ether-soluble extracts within 24 to 48 h after application (Feung etal. Reference Feung, Hamilton and Witham1971; Hummel etal. Reference Hummel, Mayer and Clay2005). Dicamba can be metabolized to 5-hydroxy-2-methoxy-3,6 dichlorobenzoic acid (in wheat [Triticum aestivum L.] and Kentucky bluegrass [Poa pratensis L.]) or conjugated as glucosides within 2 d after application (Broadhurst etal. Reference Broadhurst, Montgomery and Freed1966). In a soybean field study, dicamba concentrations in soybean foliage were reduced about 50% within 6 d after application when applied with crop oil concentrate (Andersen etal. Reference Andersen, Clay, Wrage and Matthees2004). The application of sublethal PGR doses and the fairly rapid rate at which conjugates or metabolites form may reduce the auxin activity to levels that, while still influencing shoot growth, are not enough to affect nodulation. Several studies (Al-Khatib and Peterson Reference Al-Khatib and Peterson1999; Robinson etal. Reference Robinson, Simpson and Johnson2013; Wax etal. Reference Wax, Knuth and Slife1969) reported that PGR herbicide injury during the soybean vegetative stages had minor influence on seed protein and oil content, but exposure to PGRs during soybean reproductive stages has been shown to impact these values.
Soybean yields in nontreated controls in both years and locations were at the tipping point where N provided by nodulation may not be sufficient for plant needs (Davidson Reference Davidson2014; Shapiro Reference Shapiro2017; Schmidt accessed April 20, Reference Schmidt2018). However, adding foliar or soil N did not increase yields in control treatments, and foliar-applied N, especially when applied soon after PGR injury occurred, had more detrimental impacts on vegetative growth and final yield than positive consequences. Soil-applied N had fewer negative impacts on vegetative growth; however, there was little or no rainfall from the time of N application through vegetative sampling, so N was most likely not available to the plant until later in the season. By the end of the growing season, at least 300 mm of rain occurred between all N applications and harvest, but the soil N treatments did not definitively increase yield or seed protein content.
In summary, PGR injury to soybean during the late V or early R stages of development, or if the plant was injured twice during a season, often resulted in 10% or greater yield reductions. Foliar N applications should be avoided if PGR herbicide injury has occurred, as these treatments resulted in increased plant injury and yield loss.
Author ORCID
Sharon A. Clay https://orcid.org/0000-0003-4166-6995
Acknowledgments
This research was partially funded by the South Dakota Soybean Research and Promotion Council and the South Dakota Ag Experiment Station. No conflicts of interest have been declared.