I. INTRODUCTION
Double tungstates containing rare-earth ions are attractive laser host materials due to very high stability of emission, high efficiency, long lifetime, and low excitation threshold as well as excellent chemical and thermal durability in air. This group of crystals is good candidate for efficient stimulated Raman scattering as well as for fabrication of high efficiency lasers with high output energy.Reference Kumaran, Babu, Ganesamoorthy, Bhaumik and Karnal1 They create a family of compounds with general formula AIREIII(WVIO4)2 where A denotes an alkali metal ion and RE denotes a rare-earth ion. These compounds crystallize in the structure, whose prototype is the scheelite- or wolframite-type structure. RE3+ and A+ ions can be coordinated by oxygen ions and have 8 and 12 coordinated number, respectively. Rare-earth oxygen polyhedra form square antiprism units, while the alkali metal polyhedra form distorted icosahedron units. In dependence of kind of alkali metal, tungsten atoms build isolated WO4 tetrahedra or deformed WO6 octahedra connected by a common edge forming double chains of W2O10.Reference Macalik, Hanuza and Kaminskii2–Reference Perets, Tseitlin, Shneck, Mogilyanski, Kimmel and Burshtein6
The KY(WO4)2 (KYW) and KGd(WO4)2 (KGW) tungstates crystallize in the monoclinic structure C2/c = C2h6 with Z = 4.Reference Pujol, Aguiló, Díaz and Zaldo4, Reference Macalik, Hanuza, Macalik, Ryba-Romanowski, Gołąb and Pietraszko7 In this structure, the tungstate units built the WO6 octahedra joined through the single and double oxygen bridges. The RE3+ ions occupy the sites of C1 and C2 symmetry. These materials reveal polymeric structure. Raman spectra show the bands in the gap region between 450 and 750 cm−1 where the stretching modes of the MOM and MOOM oxygen bonds are observed.Reference Macalik, Hanuza and Kaminskii2 Spectroscopic g factor shows anomaly at low temperatures suggesting the presence of some kind of internal magnetic fields, assigned, e.g., to one-dimensional (1D) chains.Reference Fuks, Kaczmarek, Leniec, Macalik, Macalik and Hanuza8
Due to the structure, we have chosen electron paramagnetic resonance (EPR) technique, besides Raman spectra analysis, to find clear differences between KGW single crystal and KGW powder samples.
Magnetic properties of KGW single crystals were analyzed in detail by Borowiec et al.,Reference Borowiec, Zayarnyuk, Pujol, Aguiló, Díaz, Zubov, Prokhorov, Berkowski, Domuchowski, Wisniewski, Puzniak, Pietosa, Dyakonov, Baranski and Szymczak9 but our findings differ from them due to wider range of investigated temperatures taken into account in our measurements. For comparison, we have taken single crystals of the above stoichiometry: KYW and KGW and powder samples of KYW tungstate variously doped with gadolinium. Diluted and concentrated materials should differ for many features. The aim of this paper was to find differences in structure, kind of magnetic interactions, and local symmetry of the compounds having various form and different concentration of gadolinium ions.
II. EXPERIMENTAL
Starting materials: KNO3 (99.9%, Sigma-Aldrich Co., St. Louis, MO), rare-earth Y2O3 and Gd2O3 oxides (99.9%, Aldrich), and WO3 (99.9%, Fluka Chemie AG, Buchs, Switzerland) were used for powder synthesis. Before use, the rare-earth oxides were heated in air at 1123 K for 12 h to remove adsorbed traces of water and carbon dioxide. First, the polycrystalline sample of potassium tungstate was obtained. For this purpose, the KNO3/WO3mixture was heated in air at 893 K for 12 h. After cooling to room temperature, the sample was reground and heated again three times at 1013 K for 12 h to complete the reaction according to the equation:
 $${\rm{4KNO}}_{{\rm{3(s)}}} + {\rm{2WO}}_{{\rm{3(s)}}} \!= {\rm{2K}}_{\rm{2}} {\rm{WO}}_{{\rm{4(s)}}} + {\rm{4NO}}_{{\rm{2(g)}}} + {\rm{O}}_{{\rm{2(g)}}}\quad .$$
The final product was checked by x-ray diffraction (XRD) method and characterized as the monoclinic potassium tungstate, K2WO4, with C2/m symmetry.Reference Koster, Kools and Rieck10 The polycrystalline samples of KGW and the KY1−xGdx(WO4)2 solid solutions (x = 0.005, 0.10, and 0.20) were prepared by the solid-state reaction according to the Eqs. (2) and (3), respectively.
 $${\rm{K}}_{\rm{2}} {\rm{WO}}_{{\rm{4(s)}}} + {\rm{Gd}}_{\rm{2}} {\rm{O}}_{{\rm{3(s)}}} + {\rm{3WO}}_{{\rm{3(s)}}} = {\rm{2KGd(WO}}_{\rm{4}} {\rm{)}}_{{\rm{2(s)}}} \quad,$$
 $${\rm{K}}_{\rm{2}} {\rm{WO}}_{{\rm{4(s)}}} + (1 - x){\rm{Y}}_{\rm{2}} {\rm{O}}_{{\rm{3(s)}}} + x{\rm{Gd}}_{\rm{2}} {\rm{O}}_{{\rm{3(s)}}} + {\rm{3WO}}_{{\rm{3(s)}}} = {\rm{2KY}}_{1 - x} {\rm{Gd}}_x {\rm{(WO}}_{\rm{4}} {\rm{)}}_{{\rm{2(s)}}}\quad .$$
Stoichiometric amounts of K2WO4, Gd2O3, and WO3 as well as K2WO4, Y2O3, Gd2O3, and WO3 were mixed homogeneously in an agate mortar. Next, they were sintered in corundum crucible several times, during 12-h periods, at selected temperatures from 873 to 1083 K. After each heating period, all samples were cooled to ambient temperature and ground. The powder diffraction patterns of prepared samples were in good agreement with the literature data for KGW and KYW.Reference Borisov and Klevtsova11 The indication of gadolinium content is nominal but the doping in this kind of material is proceeded easily as it is resulted from our previous experience; the KY1−xGdx(WO4)2compounds are stoichiometric.
KYW and KGW single crystals were grown by a low gradient Czochralski technique (modified top-seeded solution method) in Pt crucibles using oriented seeds along the crystallographic b-axis. All the samples were checked for purity by the x-ray powder diffraction, infrared (IR) absorption spectra, Raman, and EPR spectra.
XRD powder patterns of the powder samples were recorded at room temperature by using X’Pert PRO powder diffractometer (PANalytical, Almelo, Netherlands) working in the reflection geometry and using Cu Kα1radiation in the 2θ range from 10° to 65° with a step of 0.026°.
The IR absorption spectra were measured with a BioRad 575C FTIR spectrometer (Bio-Rad Laboratories Inc., Benicia, CA) in KBr pellets for the 1000–400 cm−1 region and in Nujol suspension for the 500–50 cm−1 region. Raman spectra were measured using a Bruker RFS 100/S Raman spectrometer (Bruker Optic GmbH, Ettlingen, Germany) with the backscattering configuration. The 1064-nm line of Nd:YAG laser was used as an excitation. Signal detection was performed with the LN–Ge (D418-T) liquid nitrogen-cooled NIR detector (Bruker Optik GmbH, Ettlingen, Germany) with an integrated preamplifier and high voltage power supply. The resolution of the Raman and IR measurements was 2 cm−1.
EPR spectra were recorded on a conventional X-band Bruker ELEXSYS E 500 CW-spectrometer (Bruker Analytik GmbH, Rheinstetten, Germany) operating at 9.5 GHz with a 100-kHz magnetic field modulation. The investigated samples were in fine powder form [besides, KGW and KYW single crystals]. The first derivative of the powder absorption spectra has been recorded as a function of the applied magnetic field. Temperature dependence of the EPR spectra of the powder samples in the 80–300 K temperature range was recorded using an Oxford Instruments ESP nitrogen-flow cryostat (Oxford Instruments Ltd., Witney, UK). EPR-NMR program was applied to recognize spin Hamiltonian parameters for comparison purpose.Reference Mombourquette, Weil and McGavi12
III. RESULTS AND DISCUSSION
A. XRD measurements
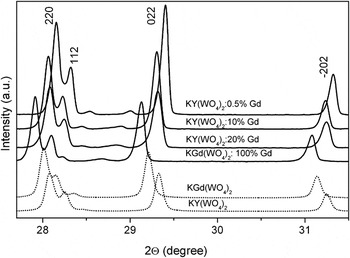
The purity and structure of KY1−xGdx(WO4)2 powders (signed later as KYW:Gd) were checked by the x-ray powder diffraction. Figure 1 shows the XRD profiles of measured samples together with the characteristic reflections of KYW (ICSD Collection Code No. 90378) and KGW (ICSD Collection Code No. 68249) single crystal enlarged from 27.7° to 31.5° to show the distinct differences. Line assignment has been done according to the International Center for Diffraction Data (PDF Card No. 01-080-0455) using the published structural data.Reference Pujol, Sole, Massons, Gavalda, Solans, Zaldo, Diaz and Aguilo5, Reference Viscakas, Mochalov, Mikhailov, Klevtsova and Liubimov13, Reference Pujol, Rico, Zaldo, Sole, Nikolov, Solans, Aguilo and Diaz14 The XRD results for pure and Gd-doped KYW samples confirm that they crystallize in the monoclinic system with the C2/c space group. The recorded x-ray patterns presented in Fig. 1 are almost identical for all phases in respect of number of peaks and their mutual intensity. The slight displacement of lines for powder samples and crystals are due to differences in zero correction for both experiments made with different diffractometers. The crystalline nature and lattice parameters of KYW:Gd do not change much from the values for pure KYW. Increase of the gadolinium ions concentration does not also influence the crystalline structure; the Gd3+ ions occupy the same positions as Y3+.Reference Pujol, Sole, Massons, Gavalda, Solans, Zaldo, Diaz and Aguilo5 KYW and KGW crystallographic structure was described in detail in previous works.Reference Macalik, Hanuza and Kaminskii2, Reference Macalik, Hanuza, Macalik, Ryba-Romanowski, Gołąb and Pietraszko7, Reference Macalik, Hanuza and Kaminskii15
X-ray powder diffraction patterns of the double potassium lanthanide tungstates with the patterns of corresponding crystals for comparison (KYW—ICSD No. 90378, KGW—ICSD No. 68249).

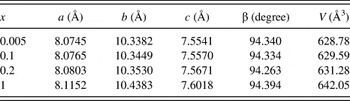
Nevertheless, there are some differences in positions of diffraction peaks between the patterns. Peaks of KYW are shifted slightly toward high angle side if compared to those of KGW. Situation is the same for the powders; the shift toward the higher angles is the biggest for KYW:0.5% mol Gd3+. This tendency is expected and reflects the differences in lattice constants. Ionic radius of Gd3+ and Y3+ equals to 1.060 and 1.015 Å, respectivelyReference Shannon and Prewitt16; the lattice parameters for KYW are less and their diffraction patterns are represented at the higher angles. The lattice parameters for KY1−xGdx(WO4)2 powder samples calculated from the XRD data using powder diffraction data analysis software are shown in Table I. These parameters have been taken from the indexing of the powder diagram for equivalent crystallographic description to I2/c space group. The dependence of unit cell parameters on values of gadolinium concentration is almost linear that confirms the assumed gadolinium concentration.
Lattice parameters for monoclinic KY1−xGdx(WO4)2, for I2/c space group.

B. IR and Raman spectra
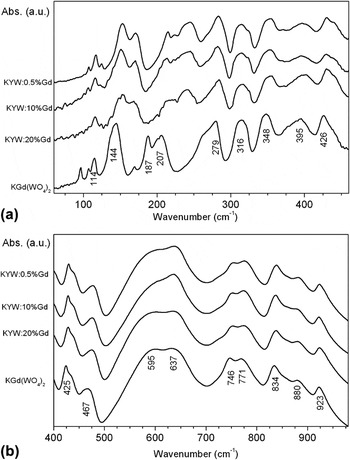
Figures 2(a) and 2(b) show the IR spectra in the far- and midrange for gadolinium ions variously doped KYW powders. The IR spectra of all phases consist of group of bands in the 720–1000 cm−1 range, two strong and broad bands in the 550–680 cm−1 range, two bands of medium intensity in the 420–500 cm−1 range, and several medium intensity bands in the 260–420 cm−1 range [Fig. 2(a)]. They reflect stretching and bending vibrations of W–O and oxygen bridge bonds.Reference Macalik, Hanuza, Macalik, Ryba-Romanowski, Gołąb and Pietraszko7, Reference Macalik, Hanuza and Kaminskii15 Some distinct differences can be observed in peak positions of the absorption bands between the phases. Peaks of KGW absorption bands are clearly shifted toward lower wave number when compare to KYW and gadolinium ions-doped KYW. The bands below 260 cm−1 differ noticeably for bulk KGW in compare to the others. They reflect the external vibrations: translatory and libratory lattice modes, which are coupled with the low-energy vibrations of the oxygen bridges. Translatory modes of the gadolinium ions T′(Gd3+) are observed at 206 and 188 cm−1 and modes of the yttrium ions T′(Y3+) at about 223 cm−1.Reference Macalik, Hanuza, Macalik, Ryba-Romanowski, Gołąb and Pietraszko7, Reference Macalik, Hanuza and Kaminskii15
IR spectra in the (a) far- and (b) midrange of the Gd3+-doped KYW powders.

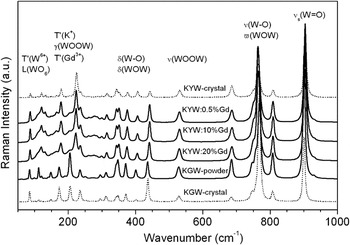
In Fig. 3, Raman spectra of the analyzed samples are presented. Raman spectra of doped gadolinium ions double tungstates are almost identical for the three concentrations of Gd3+ ions. They consist of multiplets of the stretching W–O vibrations showing four strong bands in the 740–1000 cm−1 range and the bending vibrations with medium intensity bands in the 270–470 cm−1 range. The appearance of the medium intensity bands in the range of 500–700 cm-1 of Raman spectra is confirmation of the KYW and KGW polymeric structure. In this region, the stretching modes of oxygen bridge bonds are observed. They play an important role in the electron–phonon coupling and consequently in the energy transfer in these crystals. The group of medium bands in the 70–260 cm−1 range corresponds to the external modes connected with the translational motions and vibrations of the tungstate polyhedra. The assignment to the respective normal modes presented in Fig. 3 was done according to the previous works.Reference Macalik, Hanuza and Kaminskii2, Reference Macalik, Hanuza, Macalik, Ryba-Romanowski, Gołąb and Pietraszko7, Reference Macalik, Hanuza and Kaminskii15 The spectra for both powdered and KGW single crystal are the same as for the doped tungstates regarding the number of bands with simultaneous shift of a large majority of bands toward lower wave numbers. In the present studies, T′(K+) modes are observed at 236 cm−1 and translatory modes of the lanthanide ions T′(Gd3+) and T′(Y3+) are observed at about 205 and 222 cm−1, respectively.
Raman spectra of the Gd3+-doped KYW powders and single crystals.

C. EPR spectra of KYW:Gd3+ powders
The electron configuration of Gd3+ is [Xe]4f 7; hence, the spin quantum number, S, is 7/2 and the ground state of Gd3+ is 8S7/2. The state 8S7/2 splits into 2S + 1 = 8 states; then, the seven allowed transitions according to the selection rule, ΔM S= ±1, are obtained.
As could be seen from Figs. 4 and 5, some of the lines of fine structure could be clearly seen. Usually, between the lines, hyperfine structure lines could be also observed, arising from isotopes 157Gd3+ (I = 3/2) and 155Gd3+ (I = 3/2),Reference Fuks, Kaczmarek, Macalik and Hanuza17 but in our samples, we could not recognize the lines. The EPR signal with a fine structure originates from the isolated gadolinium ions. It has been known that crystal fields of the KGW interact weakly with the 8S7/2 ground state of Gd3+. The crystal field splitting for Gd3+ is generally smaller than that produced by the Zeeman interaction in the x-band electron spin resonance (ESR) experiments. So, the EPR spectra can be described by a spin Hamiltonian incorporating with Zeeman interaction and crystal field operators (neglecting hyperfine interactions) in the form of the following equationReference Weil and Bolton18:
 $$H = H_{{\rm\,{ZEEMAN}}} + H_{{\rm{exch}}} + H_{{\rm{SS}}}\quad ,$$
 $$H = g_0 {\rm{\mu }}_{\rm{B}} BS + JS_1 S_2 + D[S_z^2 - (1/3)S(S + 1)] + E(S_x^2 - S_y^2 )\quad,$$
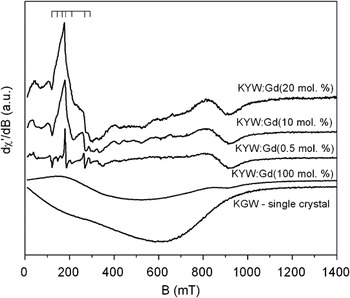
Room temperature EPR spectra of powdered KYW:Gd3+(0.5, 10, 20, and 100 mol%) and KGW single crystal.

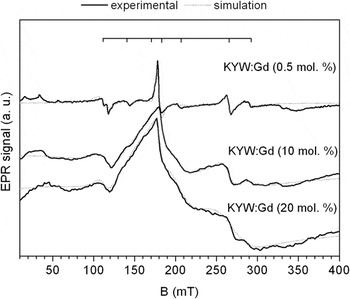
Experimental room temperature EPR spectra and fitting curves obtained from EPR-NMR programReference Mombourquette, Weil and McGavi12 for KYW:Gd3+0.5, 10, and 20 mol% powders.

where H ZEEMAN term with B—magnetic field, μB is Bohr magneton, and Sx, Sy, Sz are electron spin operators, H exch is a Hamiltonian of electron exchange interaction with an isotropic electron exchange coupling constant, J, H SS is a Hamiltonian of dipolar electron spin interaction with D and E being the zero field splitting constants (reflects the local symmetry of the crystal); the value of g—factor of the ion—is isotropic and equals to g 0as in a case of free ion.
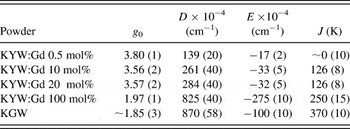
Room temperature EPR spectra for the investigated KYW powders doped with 0.5, 10, 20, and 100 mol% of Gd3+ ions and comparative KGW single crystal are presented in Fig. 4. The resolution of the lines is better for lower concentrations of gadolinium. For the fourth curve (100 mol% of Gd3+), the EPR signal, as in a case of KGW single crystal, is an envelope of unresolved anisotropic fine structure of the Gd3+ ions in powder. Applying EPR-NMR program,Reference Mombourquette, Weil and McGavi12 we were able to find parameters of the spin Hamiltonian (4) for all the investigated powders. The results of the fitting are gathered in Table II.
Spin Hamiltonian (1) parameters describing EPR spectra of the all investigated powders.

As one can see from Table II, values of D and E parameters are typicalReference Cherney, Nadolinny and Pavlyuk19 and evolve with a concentration of gadolinium ions according to very well-known rules, e.g., D ∼ 1/R 3, where R is a distance between Gd3+ions. The results of analysis of other magnetic properties of KGW powders were described in the next part of Sec. III based on the EPR measurements in a range of 80–300 K. In this range of temperature, we expected to observe changes in the type and strength of magnetic interactions.
To find parameters of the resolved spectra, we have applied fitting procedure of the EPR spectra line shapes using superposition of seven Lorentzian functions. Figure 5 shows the effect of the fitting. Solid lines are experimental curves of the EPR spectra; dotted lines are fittings obtained from the above procedure. As could be expected, only in a case of low doping, all fine structure lines are clearly resolved.
Nevertheless, the positions of all resonance lines of the fine structure for all the investigated powders do not depend on the concentration of gadolinium ions. We have found, moreover, that besides seven Lorentzian lines, one wide Gaussian line had to be added to the above superposition to obtain good enough fitting.
The width of the line increases with increase of concentration of Gd3+ ions. It indicates the presence of some more complex magnetic entities and their magnetic interactions in the investigated compounds. The conclusion can be verified by performing deconvolution of line shapes of the EPR lines measured at different temperatures. We have performed some fittings for KYW:Gd (10 mol%) solid solution, based on the following equationReference Gubin20:
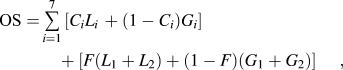 $${\rm{OS}} = \mathop\sum\limits_{i = 1}^7 {[C_i L_{i\,} + (1 - C_i )G_i ] + [F(L_1 + L_2 ) + (1 - F)(G_1 + G_2 )]} \,\quad,$$
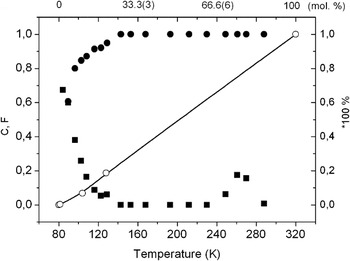
where OS is overall shape of the EPR spectrum, Li and Gi represents Lorentzian and Gaussian shapes of EPR curve, C and F are percentage contributions of a given kind of magnetic interaction to overall interaction (C and F = 0—Gaussian shape—dipole–dipole interactions, C and F = 1—Lorentzian shape—exchange interactions); the presence of F parameter reflects a wide line share to overall EPR spectrum of gadolinium ions in the compound. Figure 6 shows the dependencies of C and F parameters on a temperature.
C (upper curve, circles) and F (bottom curve, squares) parameters of overall shape of the EPR spectrum for KYW:Gd3+10 mol% (left and bottom scales) and dependence of the share of Gaussian shape in an overall shape of a given EPR spectrum (right and upper scales).

As one can see from Fig. 6 (left and bottom scales), the wide line (F parameter) and a superposition of fine structure (seven lines, C) show mainly Gaussian- or Lorentzian-like line shape above 140 K, respectively. This temperature may be a temperature of structural phase transition or a temperature separating different kinds of magnetic interactions. Because the Raman spectra versus temperature (not added here) had not confirmed conclusion on structural phase transition, the second reason stay actual. So, Gaussian shape of the additional wide line, dominating above 140 K, indicates dipolar interactions between gadolinium ions within local cluster-/chain-like magnetic structure.
We also have performed corresponding fittings of the EPR spectra of the samples under studies and obtained almost linear dependence of the share of Gaussian shape in an overall shape of a given EPR spectrum. For 0.5 mol% of Gd3+, it was 0.3 (9)%; for 10 mol% of Gd3+, it was 6.9 (3)%; for 20 mol% of Gd, it was 18.7 (3)%; and for 100 mol% Gd, it was 100% (see Fig. 6: right and upper scales). It means that the share of dipolar interactions in overall magnetic interactions linearly increases with gadolinium ions content.
As a result of further temperature analysis of the EPR spectra, we have found that the investigated powder samples show basically antiferromagnetic kind of magnetic interactions between gadolinium ions (similarly, as in the case of KGW single crystal). On the other hand, the strength of these interactions is different and depends on the gadolinium concentration and a temperature. The exceptions were found only for compounds with 10 and 20 mol% of Gd3+.
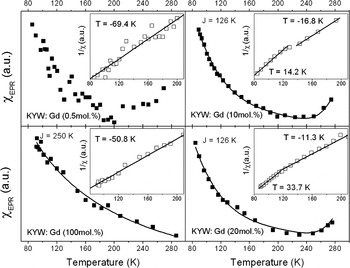
In Fig. 7, we present the overall integral intensity and reciprocal of the integral intensity of EPR spectra of the all phases. Only for one of them, the shape of the integral intensity dependence does not show complex behavior (100 mol%). All others reveal strong deviations from the Curie–Weiss law especially above 240 K. The reason of such behavior may be the following: when gadolinium ions reach a concentration of 10 mol%, clusters of gadolinium ions are expected to be formed, or generally, more complex magnetic entities.Reference Kliava, Edelman, Potseluyko, Petrakovskaja, Berger, Bruckental, Yeshurun, Malakhovskii and Zarubina21 Moreover, the investigated phases are polymeric in a structure, so we expect to find some modifications of the shapes of temperature dependences of the EPR spectra, reflecting the presence of, e.g., internal magnetic fields. The evidence of such behavior may supply the analysis of line widths and changes in a position of the resonance lines with the change of a temperature.
The integral intensity of the EPR spectra of KYW:Gd3+0.5, 10, and 20 mol% and KGW compounds. Solid curves reflect the Curie–Weiss law. In the insets, fitting parameters to the law are also collected.

The fittings of the curves from Fig. 7 to the Curie–Weiss law allowed finding Curie–Weiss temperatures equal to about −51 K for KGW and −69.4 K for KYW:Gd3+ 0.5 mol% powders. It indicates strong antiferromagnetic interactions between gadolinium ions in the samples under studies. The shapes of the integral intensities suggest the presence of more complex magnetic entities in the compounds, at least pairs of gadolinium ions. As an example, we performed a fitting of the experimental points measured for, e.g., KYW:Gd3+ 10 mol% powder, applying the following Bleaney–Bowers expression for gadolinium ion electron spin S = 7/2:
 $$\eqalignb{ I(T) = \,{1 \over T}{{P_1 \exp ( - J/kT) + P_2 \exp ( - 3J/kT) + P_3 \exp ( - 6J/kT) + P_4 \exp ( - 10J/kT)} \over {1 + 3\exp ( - J/kT) + 5\exp ( - 3J/kT) + 7\exp ( - 6J/kT) + 9\exp ( - 10J/kT)}} \cr + {{P_5 \exp ( - 15J/kT) + P_6 \exp ( - 21J/kT) + P_7 \exp ( - 28J/kT)} \over {11\exp ( - 15J/kT) + 13\exp ( - 21J/kT) + 15\exp ( - 28J/kT)}}\quad, \cr} $$
where Pi (i = 1, …, 7) are coefficients related to the transition probability within each multiplet of total spin S = 0, 1, 2, 3, 4, 5, 6 of gadolinium exchange coupled pair.Reference Guskos, Likodimos, Glenis, Zolnierkiewicz, Typek, Szymczak and Blonska-Tabero22 The intensity was directly calculated according to the Boltzmann law,Reference Bencini and Gatteschi23 yielding the total intensity from the excited energy levels of Gd3+ exchange coupled pair. Parameter J in the above expression is an antiferromagnetic exchange constant expressed in K. The best fit was achieved for J = 126(8) K and  $P_1 \cong P_2 \cong P_3 = P_4 = P_5 $,
 $P_7 > > P_6 $. It indicates strong exchange interactions between Gd3+ ions in the KYW:Gd3+10 mol% powder.
Figure 7 also shows that the slope of the reciprocal of integral intensities give Curie–Weiss temperatures being negative and large for the investigated compounds excluding compounds with 10 and 20 mol% concentration of Gd3+. In these two cases, complex behavior can be observed. For low temperatures, up to about 140/120 K, gadolinium ions interact ferromagnetically, with Curie–Weiss temperatures equal to +14.2/33.7 K, while above the temperatures, subsequently, the interaction stays antiferromagnetic like, with Curie–Weiss temperatures equal to −16.8 and −11.3 K, respectively.
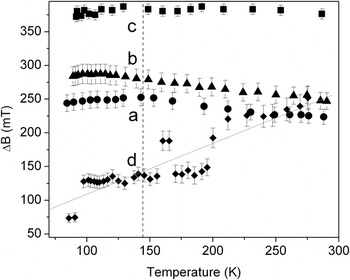
To know a reason of such behavior, we analyzed overall line widths of the registered EPR spectra. From Fig. 8, one can see that at about 140/120 K, the line widths of the EPR spectra of KYW:Gd3+ 10/20 mol% powders reveal maxima. The line widths of the EPR spectra of KGW and KYW:0.5 mol% of Gd3+phases do not show such anomaly. So, for the two former samples, one can observe a change in magnetic ordering at least near 140/120 K, respectively.
Overall line widths of the KYW:Gd3+[10 mol% (a), 20 mol% (b), 100 mol% (c), and 0.5 mol% (d)] powders.

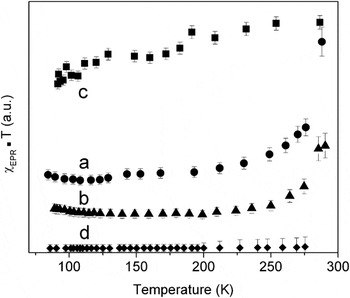
Figure 9 presents the product of the overall magnetic intensity and a temperature, which is proportional to a square of magnetic moment of the investigated compound. Lowering of the magnetic moment with a temperature decrease is characteristic for antiferromagnetic interactions. As one can see, it is not true in a case of magnetic moment plotted for KYW:Gd3+10 and 20 mol% powders, for which, below 140/120 K, ferromagnetic behavior one can observe (growth of the magnetic moment with a decrease of temperature).
Product of the overall integral intensity and a temperature for the EPR spectra of the KYW:Gd3+[10 mol% (a), 20 mol% (b), 100 mol% (c), and 0.5 mol% (d)] powders.

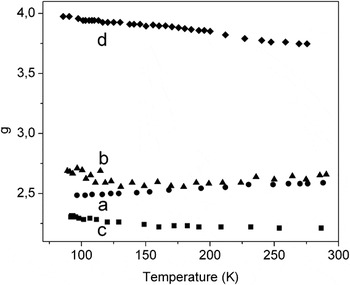
In Fig. 10, the temperature dependence of the overall resonance lines position, g, is presented. As one can see, some differences with temperature increase are observed: decrease of g for KYW:Gd3+ [0.5 mol% (4) and 100 mol% (3)] powders and increase for KYW:Gd3+10 mol% (1) and 20 mol% powders (2). This may be due to the presence of some internal magnetic field in the sample caused by complex interactions of gadolinium ions.
The overall position of the EPR resonance lines for KYW:Gd3+[10 mol% (a), 20 mol% (b), 100 mol% (c), and 0.5 mol% (d)] powders. The error bars are as high as the size of the symbols.

EPR spectra of KGW single crystals reveal broad asymmetric lines. The integral intensity versus temperature, equal to double integral of measured EPR signal and proportional to magnetic susceptibility, shows complex behavior of gadolinium ions. The magnetic interactions between the ions are generally antiferromagnetic like but the strength of the interactions is different below 120 K (T C = −3 K) and above the temperature (T C = −48 K).Reference Fuks, Kaczmarek, Leniec, Macalik, Macalik and Hanuza8 This is the difference between Borowiec et al.Reference Borowiec, Zayarnyuk, Pujol, Aguiló, Díaz, Zubov, Prokhorov, Berkowski, Domuchowski, Wisniewski, Puzniak, Pietosa, Dyakonov, Baranski and Szymczak9 and our findings. The behavior is confirmed by the dependence of the reciprocal intensity versus temperature and the product of the integral intensity and temperature versus temperature, proportional to a square root of magnetic moment. The position of resonance line represented by g factor starts to increase from 1.67 at ∼8 K to almost 1.95 when the temperature reaches ∼100 K. With further increase of temperature, it becomes constant and equals to ∼1.85. Such behavior of the resonance line position suggests the presence of some kind of internal magnetic fields inside KGW single crystal, assigned to, e.g., 1D, two-dimensional (2D) chains or clusters.Reference Fuks, Kaczmarek, Leniec, Macalik, Macalik and Hanuza8 Fittings of the EPR spectra with use of the EPR-NMR programReference Mombourquette, Weil and McGavi12 expose a low local symmetry of gadolinium ions in the KGW crystal. It was found by Borowiec et al.Reference Borowiec, Zayarnyuk, Pujol, Aguiló, Díaz, Zubov, Prokhorov, Berkowski, Domuchowski, Wisniewski, Puzniak, Pietosa, Dyakonov, Baranski and Szymczak9 that the paramagnetic Curie temperatures in KGW crystals depend, besides a type of rare-earth ion, on magnetic field direction and have both positive and negative signs. So, their conclusions confirm our findings. The conclusions derived by Borowiec et al.Reference Borowiec, Zayarnyuk, Pujol, Aguiló, Díaz, Zubov, Prokhorov, Berkowski, Domuchowski, Wisniewski, Puzniak, Pietosa, Dyakonov, Baranski and Szymczak9 from magnetization measurements of KGW single crystals differ slightly from ours but they analyzed magnetization of the crystal only within the range 2–100 K. Our investigations reach room temperature range, where we found some distinct differences between KGW single crystal and KYW:Gd3+ powders. In the former, one can observe mainly a change in strength of antiferromagnetic-like interactions, while in the latter, besides strength, we also observed changes in magnetic ordering leading to a change in a type of magnetic interactions (in KYW powders doped with 10–20% of Gd3+).
IV. CONCLUSIONS
XRD data do not show distinct differences between KGW and KYW single crystals and KYW:Gd powders in position of the diffraction peaks. Vibrational characteristics as Raman and IR spectra of samples under investigations confirm that these phases are isostructural. EPR measurements were useful to explain the changes in kind and strength of internal magnetic interactions. KGW single crystal and KGW and KYW:Gd3+ (0.5 mol%) powders reveal strong antiferromagnetic interactions between gadolinium ions (T C = −48, −50.8, and −69.4 K, respectively). The former one shows more complex behavior below 120 K (T C = −3 K) and above 120 K (T C = −48 K). KYW:Gd3+ powders doped with 10 and 20 mol% of Gd3+ reveal changes in a kind of magnetic interaction at temperatures 140 and 120 K, respectively, from ferromagnetic-like behavior (T C = 14.2/−16.8 K) to antiferromagnetic-like behavior (33.7/−11.3 K). This is almost the same temperature as the one recorded for the KGW single crystals (not found by Borowiec et al.Reference Borowiec, Zayarnyuk, Pujol, Aguiló, Díaz, Zubov, Prokhorov, Berkowski, Domuchowski, Wisniewski, Puzniak, Pietosa, Dyakonov, Baranski and Szymczak9), now being gadolinium ion concentration dependent. The position of a resonance line, g, differs between all the compounds showing higher value for isolated gadolinium ions in KGW powders (g > ∼3.75) and lower value for KGW compound (g ∼ 1.75). In case of KGW single crystal, it is equal to ∼1.85.Reference Fuks, Kaczmarek, Leniec, Macalik, Macalik and Hanuza8 The temperature dependencies of the line position, line width, integral intensity, its reciprocal, and the product of integral intensity and temperature show on low local symmetry of gadolinium ions in all the compounds and confirm a change in a kind of magnetic interaction at 140/120 K for KGW:Gd3+doped with 10 and 20 mol%, respectively. They are also evidence of a complex nature of the magnetic interactions that could be clusters or 1D, 2D chains of gadolinium ions.
ACKNOWLEDGMENTS
Authors deeply thank Dr. E. Tomaszewicz for samples synthesis and for useful comments and MSc E. Bukowska for XRD measurements.