Introduction
In this article we analyze why a moderate disciplinary regime based on principles of general deterrence shifted toward much greater penal severity. To do so, we consider the Royal Navy during the period from 1740 to 1820, at the height of the age of sailing warships (Dull Reference Dull2009). Punishment by summary flogging at the discretion of a ship’s commander was part of a disciplinary regime designed to achieve and sustain onboard social order. Prior to 1789, a loose system of social control prevailed that allowed for much give and take between officers and seamen (Lavery Reference Lavery2010; Rodger Reference Rodger1986) and the moderate use of flogging. But this social compact frayed with the onset of the political upheaval that engulfed Europe in the late 1700s, as officers apparently became more punitive.
The authors are grateful for the invaluable consultation of N. A. M. Rodger and the expert research services rendered by Moira Bracknell. We would like to thank Bob Crutchfield, Aimee Dechter, Edgar Kiser, Ross Matsueda, and outstanding reviewers at Social Science History for their comments and suggestions. The paper benefited from presentation at the Sociology Department at the University of Washington and the annual conference of the Association for the Study of Religion, Economics and Culture (ASREC). Research assistance was provided by University of Washington students Lindsey Beach, Jayleen Bowman, Elizabeth Cady, Dale Coleman, Lauren Ho, Christopher Prather, Sarah Reinecke, Heather Reyes, Jocelyn Sayler, Kristin Smith, Samuel Stabler, Thomas Stanton, Timothy Thomas, Meral Tunador, and Rachel Tweet. Funding for this research was supported by grants from the Air Force Office of Scientific Research (FA9550-09-1-0502) and the Harry Frank Guggenheim Foundation.
What caused this shift in the disciplinary regime of the Royal Navy? To what extent did perceived threat and the fear of social disorder lead captains to resort to more frequent and more severe flogging? We analyze flogging with a random sample of Royal Navy ships drawn from a complete set of ship years between 1740 and 1820 (a description of the sample follows). Daily records allow us to assess the incidence and severity of flogging on these ships over the course of a given year and to model the factors that are associated with flogging. Our study includes periods of war and peace and several decades before the onset of the revolutionary crisis at the end of the eighteenth century.
Within this period penal conditions aboard Royal Navy ships varied from relatively moderate to very harsh. At the outset of our period of study, naval authorities sought to attain social control by normalizing flogging as a form of deterrent punishment in the hands of commanders who were permitted to flog at their own discretion. The data we collected suggest that captains generally punished to enhance the performance of the ship’s company and to ensure the security of their command. These patterns are broadly consistent with a traditional deterrence framework predicated on the maintenance of social control (Gibbs Reference Gibbs1977; Matsueda Reference Matsueda2013). However, we also find that the incidence and severity of flogging increased sharply by the end of the 1700s in tandem with contextual changes that threatened the British ruling classes. The increase in penal severity that we observe departed from the preceding disciplinary regime that emphasized naval performance over morality and deference.
Deterrence and Naval Discipline
The traditional depiction of life at sea in general, and in the Royal Navy in particular, focuses on adversarial relations between officers and seamen and the routine violence that putatively backed the exercise of command (Claver Reference Claver1954; Frykman Reference Frykman2009, Reference Frykman2010; Neale Reference Neale1985; Rediker Reference Rediker1987). The eighteenth-century navy was the most important arm of the British state and the kingdom’s largest employer. The navy required large crews that were diverse in terms of their skills, experience, recruitment circumstances, social origins, and ethnicity. In the dangerous conditions faced by warships, obedience to command was a vital matter, and seamen needed to be motivated to perform their duties in sailing, operating the ships, and fighting enemies. Fear of the lash was far from the only inducement, of course; the navy provided seamen with pay, victuals, alcoholic drink, and opportunities for modest enrichment through the taking of prizes. In addition, skilled seamen had a strong occupational culture that emphasized professionalism and responsibility.
Although traditional accounts dwell on the horrors of the lash, many contemporary historians, while acknowledging that conditions on naval vessels could be harsh, have argued that the Royal Navy’s reputation for brutal discipline and unchecked flogging has been overstated (Byrn Reference Byrn1989; Eder Reference Eder2004; Rodger Reference Rodger1986). These historians contend that flogging in the Royal Navy cannot be considered cruel or unusual by the standards of the day, most commanders used punishment judiciously, and despotic captains who punished excessively were exceptional.
Rodger (Reference Rodger1986) argues that the Royal Navy adopted a set of loose conventions concerning obedience and punishment anchored by a partial and ambiguous legal code. Nevertheless, both penal practice and naval law—the Articles of War—reflected eighteenth-century conceptions concerning the utility of punishment. Eder (Reference Eder2004: 5) describes the “undisputed function” of corporal punishment in British society to be deterrence. As Byrn (Reference Byrn1989: 55) notes, the British ruling classes treated the principle of general deterrence as axiomatic. Corporal punishment was seen as appropriate and practical: “From the elite point of view, whipping constituted a happy compromise between excessive leniency and the overreaction of the death penalty” (McLynn Reference McLynn1991: 282; see also King Reference King2000 and Sharpe Reference Sharpe1999). It was held that offenders should be dealt with severely, even if few might be caught and even fewer punished; the few would serve as examples for the many. Naval officers hoped that a general deterrence strategy based on summary flogging would generate “the immediate, unhesitating, unquestioning reaction to orders—in one word: Obedience” (Claver Reference Claver1954: 1).
The Articles of War and associated instructions provided the basis of criminal justice in the Georgian navy. They were a “haphazard assembly of regulations and admonitions, with a good deal of duplication and little order” (Rodger Reference Rodger1982: 8). Although informed by the spirit of common law, the Articles served a military function and superseded civilian law, even going so far as to instruct that the law must defer “to the laws and customs in such cases used at sea” (12). The Articles dealt with a variety of offenses, including moral infractions, crimes against the Crown and the king’s officers, and strictly naval infractions. Reflecting a growing confidence in deterrence among legislators, the Georgian-era Articles and related regulations introduced in the 1740s were harsher and more comprehensive than their predecessors in that they specified flogging for many different offenses. The government gave the commanders of ships nearly unlimited rights to inflict summary punishment by flogging on seamen. Commanders were limited in that they could only inflict flogging for offenses specified in the Articles, but some of these were so broadly worded as to provide a rationale for punishing nearly any remotely deviant behavior.
The conduct of flogging reflected the logic of general deterrence. The public flogging ritual was designed such that “simple mariners, having witnessed the spectacles, would be left trembling at the prospect that such tremendous force—the power of life and death—might one day be used against them in the event that they violated the law” (Byrn Reference Byrn1989: 55). The impression of such punishments could last a lifetime. Samuel Leech, who had been a serving-boy on the frigate Macedonian in 1811, recalled how, shortly after joining the ship, he witnessed a man receiving a severe flogging for drunkenness on the quarterdeck of his ship: “His flesh creeps…the sufferer groans; lash follows lash…. Four dozen strokes have cut up his flesh and robbed him of all self-respect; there he hangs, a pitied, self-despised, bleeding wretch…and the hands, ‘piped down’ by the boatswain, sullenly return to their duties” (Leech 1843: 50).
At sea, naval commanders had nearly absolute authority over seamen. A standard manual called the captain “like a King at Sea” and made clear that his authority depended on “rules of discipline and subordination” that were to be upheld by threat of punishment (Rediker Reference Rediker1987: 208). The stakes for naval commanders were high. Gilbert (Reference Gilbert1980: 118–19) finds that naval officers saw themselves as in greater danger than their counterparts in the army: “At sea, there was no place to turn for help. As a result, the naval justice system tried to nip disorder in the bud and punish its manifestations with rigor.” For naval commanders, the loss of control over a ship’s company threatened not only poor performance and diminished authority, but the decay of the ship’s moral universe: “First, there was the disorder of nature, exacerbated at sea by storms; second there was the disorder of men who were no longer working together to counteract and defeat the worst chaos of nature” (ibid.: 115).
As harsh as public flogging on the deck of a ship surely was, the intent of the Articles was to moderate punishment. For early modern governments bent on rational reforms, flogging was an attractive alternative to traditional punishments (gagging, branding, stocks, keelhauling, etc.). It could be standardized and calibrated to particular offenses by specifying the number of lashes (Garland Reference Garland1990: 241); it was “a rough and ready and swift justice aimed at fitting the crime” (Pope Reference Pope1981: 215). In fact, the penal reforms associated with the Articles and related instructions succeeded in reducing irregular forms of seagoing punishment and established conventions governing the size and weight of the cat-o’-nine tails (Eder Reference Eder2004: 67). Regulations that sought to limit punishments to no more than a dozen lashes per offense were flouted (ibid.: 66; Rodger Reference Rodger1986), but by insisting that flogging be carried out in routine ways and be reported in ships’ logs the Royal Navy took important steps toward more a regular system of discipline.
Whereas the reforms enhanced the capacity of the captain to punish at his own discretion, they also were intended to make punishment more uniform and reliable. Although commanders had the power to refer offenders to naval courts martial (which could impose death), public flogging on the decks of warships was the principal means of deterring deviance and disobedience. Although “starting”—blows from knotted ropes or canes—could be spontaneously and more casually applied, flogging was subject to stricter conventions, including the recording of punishments in the ship’s logs, the size and weight of the cat, and, in principle, limitations on the number of lashes to be applied. In practice, commanders facing a man accused by his superiors of an offense often held an informal hearing that would allow him to answer the charge and call witnesses. Robert Wilson, a petty officer on the Unite from 1805 to 1809, recalled that the men accused of crimes were “called before the Captain one by one to make their defence; they are allowed a fair trial. If any officer speaks in their favour, they are acquitted or their punishment is mitigated; if they can clear themselves, well and good. In short, it is like a court of judicature” (Lavery Reference Lavery2010: 277).
Whatever attractions it might have had to officers who believed in its necessity and deterrent power, there were practical limitations on flogging. First, commanders were ultimately accountable to the admiralty and could face potentially ruinous inquiries into alleged brutality. Second, punishment was costly. Severe floggings could leave seamen injured or debilitated, putting them on the sick list and removing them from the ship’s labor supply. Commanders and seamen alike understood that captains who flogged excessively or too frequently risked their professional reputations and the legitimacy of their rule. Captains who punished excessively might provoke resistance, even a general mutiny that risked the ship and the reputation of its commander (Hechter et al. Reference Hechter, Pfaff and Underwood2016).
As captains were entrusted with broad powers to inflict summary punishment, this inevitably meant that they occasionally strayed into brutality. The great weakness of the navy’s disciplinary regime was that officers had a virtual license to act upon their prejudices and emotions. As the reform-minded Admiral Philip Patton (1739–1815) observed, “The same possession of absolute power will also account for the frequent instances which occur in the Navy, of men whose conduct has been unexceptionable in subordinate situations on being advanced to the command of ships becoming capricious and tyrannical in a high degree, neglecting even the common rules of justice and the rights of humanity, which are concealed from themselves under the mistaken idea of rigid discipline” (Lavery Reference Lavery1998: 624). Lacking effective restraints, the insecurities of naval officers were largely unchecked while at sea.
The Revolutionary Crisis and Naval Punishment
Once the officer caste felt itself to be imperiled by radical political change, the opportunity for commanders to inflict more frequent and severe punishment was already in place. For several decades after 1740, the goals of naval reformers to rationalize punishment by normalizing flogging and deferring to the discretion of commanders resulted in a moderately severe disciplinary regime. Naval historians, however, have noted that there was a shift at the end of the century and in the Napoleonic era. Discipline became tighter; tolerance for rowdiness and petty disorder declined; and flogging became more common and more severe (Gilbert Reference Gilbert1983; Lavery Reference Lavery2010). This transformation has variously been explained by intensifying class conflict between officers and seamen (Frykman Reference Frykman2009; Neale Reference Neale1985), the rapid expansion of the officer corps (Lavery Reference Lavery2010; Pope Reference Pope1981), and the strains placed on the navy by decades of wartime mobilization (Rodger Reference Rodger1986, Reference Rodger2004).
Whereas these existing explanations of increasingly severe punishment are credible, we propose that the transformation also resulted partly from the coming of the revolutionary era. The appreciation that insurrection had become more likely and more dangerous, along with new fears of the restiveness of the lower classes, became part of the political culture of Britain during the Age of Revolution. This change appears to have affected the sentiments of officers and altered shipboard social relations such that there was a profound increase in tensions between officers and men and, as a result, more frequent and severe floggings.
The comprehensive data we have collected for this study shed new light on the issue. They indicate that the incidence of flogging aboard ships probably increased sharply from the 1790s onward. During the years 1740 through 1789, the average annual rate of punishment per member of a ship’s company by number of lashes in our sample was 1.34. In the period between 1790 and 1820, flogging was much more common, rising to an annual rate of 4.35 lashes per seaman. Flogging became not only more frequent but also more severe. The average flogging inflicted on a seaman in the ships in our sample in the period 1740 through 1789 comprised 13.6 lashes—somewhat above the official norm. However, in the period from 1790 through 1820, the average flogging consisted of 19.5 lashes—an increase in penal severity from the earlier period of about 70 percent.
Could the revolutionary crisis have instilled a heightened perception of threat among officers that can account for the increase in violent punishment aboard His Majesty’s ships? A sense of profound crisis accompanied the dawn of the Age of Revolution in Britain (Cookson Reference Cookson1797; Hobsbawm Reference Hobsbawm1962; Jenks Reference Jenks2006; Philp Reference Philp2006). The revolutionary events that began in France rocked Europe. The optimism and hopes for constitutional reform that had led many Britons initially to sympathize with the revolution were replaced by fear and dismay as the French political situation radicalized. Public opinion was rent between the supporters of Paine’s radicalism, who sympathized with France, and those taking Burke’s critical posture toward the revolution. Meanwhile, in the midst of an agonizing constitutional crisis, France was convulsed by factionalism, royalist rebellions, and Jacobin militancy.
Even as Burke’s pessimism spread, the matter soon became a life or death struggle for the British monarchy. Elite opinion swung decisively against the revolution from 1792 onward. The year 1793 began with the execution of Louis XVI, an act that horrified the British public. The French government devolved into dictatorship and the Reign of Terror, as thousands of noblemen, royalists, and suspected enemies of the new state were arrested and executed (Schama Reference Schama1989). French revolutionary armies turned back invaders and overran neighboring territories. The leaders of the revolution were fighting for its life and assailed the monarchies of Europe. In February, France declared war on Great Britain. This war was an ideological struggle; French political goals were not limited to a conventional contest of arms but rather sought to liberate “despotic” societies and inspire domestic insurrections (Doyle Reference Doyle1990). In making the case to Parliament for financing a major war effort against the revolution, Prime Minister William Pitt decried France’s “presumptuous attempts to interfere in the government of this country and to arm our subjects against ourselves; to vilify a monarch, the object of our gratitude, reverence, and affection,” warning that, “We are at war with those who would destroy the whole fabric of our Constitution” (Churchill Reference Churchill1956: 287). So grave was the threat that, in the 1790s, Pitt was able to convince the British elite to impose upon itself the nation’s first income tax.
The government passed a series of repressive measures to throttle internal sedition and suppress insurrection. Even mild criticism of the monarchy or the government could lead to arrest (Philp Reference Philp2006; Thompson Reference Thompson1980). Facing what it perceived as an existential threat, Britain’s leaders believed that the kingdom’s democratic reformers, “Jacobin” radicals, and Irish nationalists were all, to varying degrees, the inspired allies of France. Domestic pressures and civil unrest reinforced this impression. In addition to the severe economic strains of fighting a global war on land and sea against republican France and her satellites, the situation at home became highly unsettled. The late 1790s witnessed a variety of civil disturbances by radical reformers, growing labor unrest, desperate Irish rebellions backed by the French, and even a general mutiny in the Channel and North Sea fleets in 1797 (Thompson Reference Thompson1980; Wells Reference Wells1983).
Whereas reactionaries were quick to blame political discontent and social conflict on France and her agents, the evidence for large-scale collaboration is scant. Aside from Ireland’s anticolonial rebellions, the linkages between political dissent and domestic unrest and French Jacobinism were tenuous (Brown Reference Brown2006; Goodwin Reference Goodwin1979; Wells Reference Wells1983). But the fear of social revolution and political radicalism among the British elites was real. Colley (Reference Colley2003) argues that popular British nationalism overcame class conflict and political differences as the struggle with France progressed. Although there is evidence of spontaneous popular support for the Crown that should have been consoling, the government and leading public figures nevertheless had “grave concerns about the basic loyalty of the British population” (Philp Reference Philp2006: 4). Cookson (Reference Cookson1797: 182) argues that the British ruling classes were obsessed with the idea that “behind any popular opposition lurked a dangerously subversive secret radicalism”—fears that were out of proportion to the threat and that inspired a demand for repression and order.
Popular disorder, once a tolerable feature of British life, was now treated as a mortal threat. The alarmism surrounding the radical menace became manifest in a host of repressive laws, a muzzling of the press, and, in practice, greater penal severity (King Reference King2000; McLynn Reference McLynn1991; Sharpe Reference Sharpe1999). Langford (Reference Langford1984: 383) observes that fear of revolution achieved “the destruction of the old tolerance” between the social classes and instilled “the popular riot among the bugbears of the propertied mind.” The British elite had previously regarded rowdiness as a safety valve and saw the popular classes as posing no elemental threat (Sharpe Reference Sharpe1999: 198), but this confidence had been shattered by the events of the 1790s. The fear that the revolution had changed the world in adverse ways endured beyond the crisis decade. In 1803–5 Britain experienced another invasion scare as Napoleon assembled forces on France’s northern coast. As Colley (Reference Colley2003: 150) notes, “Even after Napoleon Bonaparte had muffled the egalitarianism of the early French Republic, the prospect of Britain’s traditional rulers losing face (if not their heads) persisted…. Napoleonic France could still be seen—and was seen by its British opponents—as a meritocracy.”
The same shift in elite attitudes seems to have occurred at sea. There was no substantial change in laws governing the conduct of seamen aboard ships after 1789 that would account for greater use of the lash. Nevertheless, the general spirit of repression and reaction that convulsed British society did not spare the navy. Naval families shared the same anxieties as other well-off Britons. The French Revolution stirred fears of Jacobinism in the fleets and calls for tighter discipline by the officer caste (Gill Reference Gill2016: 220–28). The upper ranks of officers were drawn largely from the British elite, including the aristocracy and the landed gentry (Lewis Reference Lewis1960). Such officers were strongly influenced by the Georgian establishment’s ideals of hierarchy, deference, and paternalism. But the naval career was also open to talented members of the middle classes who tended to emphasize duty and service to the nation over aristocratic honor (Rodger Reference Rodger2002). In spite of differences in their social backgrounds, officers as a whole feared the radicalization of seamen and were shocked by mutinies and insurrections (Frykman Reference Frykman2009; Pfaff et al. Reference Pfaff, Hechter and Corcoran2016).
Admiral Keith, who assumed control of the North Sea fleet in the wake of the mutiny at the Nore, expressed the conventional wisdom when he attributed the great mutinies to “a dangerous spirit of republicanism, springing directly from the principles and examples of the French Revolution” (Allardyce Reference Allardyce1883: 137). Episodes of naval mutiny, including examples such as those aboard the Hermione (Frykman Reference Frykman2010) and the Danae (Pope Reference Pope1987), which involved political radicals among their leaders, further shook confidence among officers. Many were convinced that Jacobinism and “mob rule” could only be kept in check by tightening discipline and punishing manifestations of disorder and disrespect. Admiral Saint Vincent, commander of the Mediterranean Fleet in the late 1790s and of the Channel Fleet in 1800–1, was a prominent exponent of this view. In the name of “traditional values” and stern discipline, he expected strictness and frequent punishment by subordinate commanders (La Fevre and Harding Reference La Fevre and Harding2000: 337). In turning to flogging as a way to maintain control, such officers had broad support in English public opinion where many voices called for “unrestrained severity” to undo the putative decay of naval discipline (Jenks Reference Jenks2006: 108).
In this context, the power to inflict summary punishment at a commander’s discretion created conditions that made penal severity more likely. Martinets in positions of command were unleashed. One of the most infamous was Richard Corbet, captain of the frigate Nereide. Corbet was a strict but respected officer, having been praised by Nelson for bravery and efficiency. After Corbet assumed command of the Nereide in 1806, he gained a reputation for brutality; in a crew numbering only about 250 men he inflicted 134 floggings in just 211 days, with an average punishment of 17 lashes. That was a severe if not outrageous regime by the newly prevailing standards in the Royal Navy, but matters soon grew much worse. In 1808, Corbet inflicted 198 floggings and the average punishment he inflicted consisted of 25 lashes. Eventually, in January 1809 Corbet provoked a mutiny against his command.
Corbet was recognized as having been exceptionally severe and his case was a public embarrassment to the Admiralty. Accordingly, he was tried by court-martial for misconduct, including excessive flogging and irregular beatings (“startings”) of men with large sticks. At trial, Corbet made a spirited defense of his actions, noting that naval regulations granted commanders discretion to maintain discipline as they saw fit. If he had been harsh, it was because harshness was justified by the lazy and insubordinate tendencies of seamen. Concluding his defense, Corbet praised flogging as a moral necessity and guarantor of British naval supremacy:
Convinced as I am that whenever discipline is relaxed, whenever a captain feels his power incompetent to support subordination, activity and exertion, that the service I delight in has passed its zenith; that our discipline constitutes its superiority over all others, that we meet enemies as brave as ourselves, that our country has experienced its greatest damage from relaxing on its support and safety from infliction of discipline. Under these ideas I count the public character of a strict and rigid discipline.
Corbet’s jury of fellow officers acquitted him of the most serious charges, although they admonished him not to use large sticks when starting seamen.Footnote 1
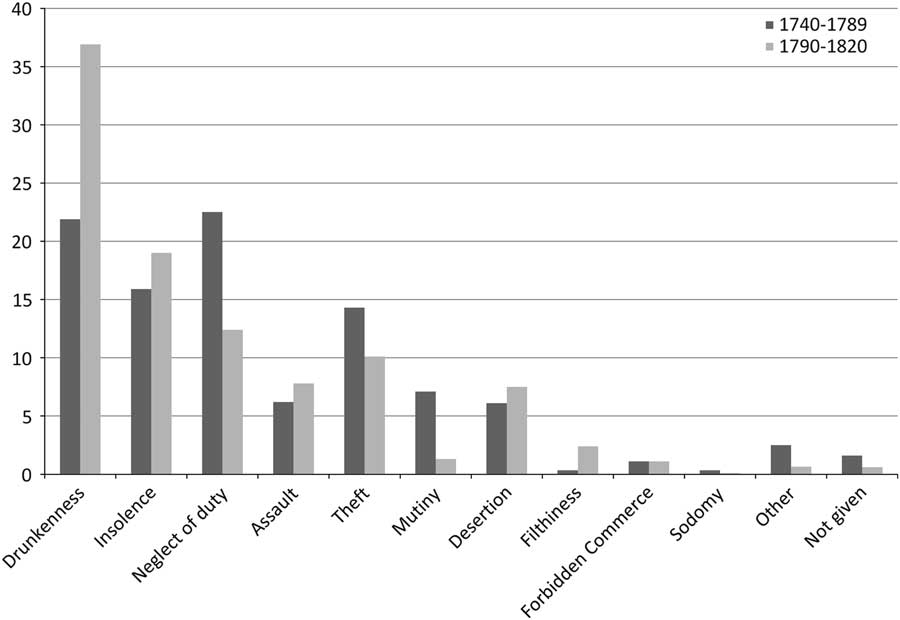
Qualitative evidence about the offenses that were punished prior to and after 1789 sheds further light on increased penal severity. The data we coded from hundreds of logbooks suggest that an increase in general criminality or deviance cannot fully explain increasing penal severity, but rather is indicative of the insecurity of officers and their growing distance from and distrust of seamen (see figure 1).
Reasons given by commanders by primary offense for flogging, 1740-1789 (N=1,172) and 1790-1820 (N=2,905), by percent of all punishments.
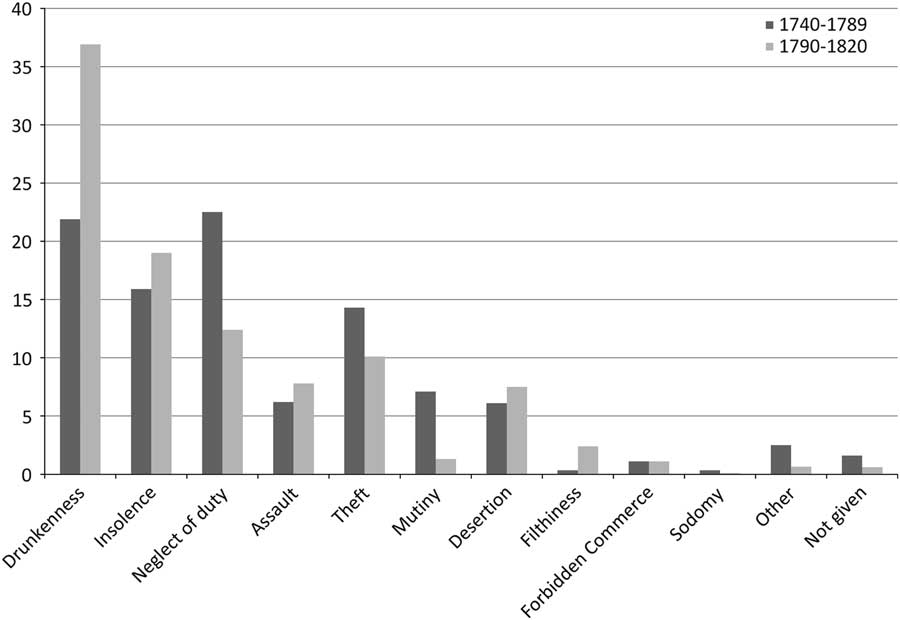
The data indicate that the share of floggings given by commanders during the two periods for serious violations of shipboard social order such as assault, theft, desertion, and the sale of alcohol and other contraband was not substantially different. In the first period, however, punishment appears to have been focused more on offenses deleterious to the performance of the vessel, such as neglect of duty and mutiny (which rather broadly included individual defiance of command). In the second phase, commanders seem to have given greater attention to the morality of seamen, putting greater emphasis on drunkenness, insolence, and filthiness (including “filthy” behavior and personal uncleanliness). A similar trend has been observed in court-martial prosecutions during this era (Gilbert Reference Gilbert1976). Particularly noteworthy is the startling increase in the proportion of floggings given for drunkenness, which nearly doubled after 1789.
Moreover, the data make clear that the increase in penal severity that we have identified at the end of the eighteenth century and early nineteenth century is not the result of a long-term secular increase in punishment. Prior to the revolutionary era, flogging seems to have increased modestly during wartime, but our data do not suggest a strong upward trend. As figure 2, which plots the observed punishment in the ships we have analyzed for this study over time illustrates, there is no marked trend toward harsher punishment observed until after the mid-1790s, when it increases sharply.
Floggings given on Royal Navy ships by Total Lashes Given and Total Episodes of Punishment, 1740-1820.

There appears to be a degree of inertia to temporal effect of the French Revolution. The frequency and severity of flogging did not jump immediately upward in 1790. The radical direction that the revolution would take was not apparent at first. Even once it made its radical turn it took time for the implications to make their way through British society, officers to conclude that the threat was real, and their posture toward social control to change. Nevertheless, the upward trend is conspicuous by the mid-1790s and peaks in the early 1800s.
The data suggest that the increase in the frequency and severity of flogging after 1789 may have reflected less a change in the conduct of seamen than a change in the disposition of commanders toward seamen. If, as Rodger (Reference Rodger1986) has argued, a live-and-let-live attitude toward the lower-deck characterized the officers of the mid-century Georgian navy, the willingness to overlook minor forms of deviance in the interest of winning compliance is less observable in their counterparts at the end of the century. As the ration of alcohol given to Royal Navy seamen did not change between the two periods, what appears to have changed was captains’ tolerance of its attendant potential for rowdiness and disorder.Footnote 2
Feeling themselves under threat, officers seem to have believed that morality had to be upheld so as to preserve fighting spirit and discourage rebellion. Despite misgivings about the cruelty of flogging, even pious evangelical officers believed that it could only be relaxed “once lower-deck conduct improved” (Blake Reference Blake2008: 290). In the wake of the French Revolution, many agreed with Captain (later admiral) John Duckworth that seamen were worsening and that good order called for more Bibles and more floggings (83). Gilbert’s (Reference Gilbert1976) study of naval courts-martial finds that there was a substantial increase in prosecution and harsher penalties for moral offenses of all kinds at the end of the eighteenth century. Following his great victory over Napoleon’s fleet at the Nile, Admiral Nelson opined that it was superior discipline that gave the Royal Navy its military edge; this in contrast to the “riotous behavior of the lawless Frenchman” (87). Officers widely believed that British naval success owed to the stringent discipline of the Royal Navy, which exceeded that of its disordered adversaries (see, e.g., Boucher Reference Boucher2012; Lloyd Reference Lloyd1995; Marshall Reference Marshall1823).
The punishment of relatively trivial offenses suggests growing social distance between officers and men. As seamen were entitled to a daily ration of strong rum or other alcoholic drink, drunkenness had always been commonplace aboard naval ships (including among officers), as it was generally in British society (Byrn Reference Byrn1989: 127). Rodger (Reference Rodger1986: 74) observes of the Royal Navy during the era of the Seven Years’ War, “Even excessive drinking was only a slight offence, and no man who was peaceably drunk would normally be punished for it,” unless it resulted in the neglect of duty. But the live-and-let-live attitude toward the lower-deck that characterized the officers of the mid-century Georgian navy appears to have been replaced with a new sternness at the end of the century. Other historians observe similar changes in social relations, including nascent class-conflict and growing severity by commanders (Frykman Reference Frykman2009; Neale Reference Neale1985) and an increasing moralism among officers (Blake Reference Blake2008).
Perhaps the seamen of the Royal Navy were becoming more insubordinate from the 1790s onward. The number of mutinies in the Royal Navy did increase after 1789, however the wartime population of seamen in the Royal Navy more than doubled between the 1740s and the 1810s, as did the number of battleships and cruisers in service, without a proportionate increase in the rate of mutiny (Rodger Reference Rodger2004: 608, 637–39). Even so, the number of reported and prosecuted incidences of mutiny did increase in the 1790s, perhaps because officers became more scrupulous in referring insubordination to courts-martial or because there was a change in the baseline rate of rebelliousness among Royal Navy seamen. In any event, it is probable that officers took note of large-scale insurrections (such as the mutinies of 1797) and the increasing incidence of rebellion, regardless of its true rate, reinforcing the general impression that this was an age of crisis, social conflict, and danger.
Beginning in 1806, cases like those of Richard Corbet prompted a series of piecemeal regulations to reign in excessive flogging and better supervise officers. Enforcement was poor and historians argue that they did little to reduce flogging (Byrn Reference Byrn1989: 19). However, the changes indicate that naval authorities were aware that summary punishment was not operating as intended and that excessive flogging was becoming counterproductive. It was not until after Napoleonic era that flogging fell out of favor, but it was not abolished fully in the Royal Navy until a century later (Claver Reference Claver1954).
The descriptive data demonstrate a marked increase in the frequency and severity of flogging aboard ships after 1789, providing initial support to our proposition that threat increases penal severity. But does the pattern remain in the presence of other possible determinants of the punishment rate? Flogging is associated with several factors that could have increased tensions or made it harder to manage the crews of naval ships, such as increasing recruitment of “foreigners” (including Irishmen) into the fleets, the burden of impressment, foreign deployments, material grievances, or tensions caused by long periods of warfare. To assess these possibilities, we conduct a multivariate analysis of flogging.
Theory and Hypotheses
Punishment serves as a means by which captains exert authority and maintain control over their crews. We should expect flogging to be more frequent and more severe aboard ships whose captains perceive heightened threats to authority and control. But commanders would have faced a dilemma in inflicting flogging on their subordinates. On the one hand, historical sources make clear that most were confident that flogging was necessary to maintain discipline, particularly if they felt their authority was threatened or that the ship’s performance was compromised. On the other, they were aware that most deviance could not be detected and that flogging was a potentially costly way to secure shipboard social order. Worse, commanders had almost no way of knowing whether punishment was effective and, if so, at what level of severity or frequency.
Given these considerations, why should naval commanders punish at all? Punishment is costly and the positive incentives to punish are not immediately obvious. Horne’s (Reference Horne2009) research suggests that people sanction norm violators most robustly in the context of high social interdependence, as aboard naval ships. Beyond their professional norms, commanders would have had natural incentives to punish, at least so as to enhance their security and the success of their command. In fact, we found that less than 10 percent of captains in our sample never flogged seamen over the course of a ship year.
But why did the frequency and severity of punishment increase so markedly during the 1790s? Our principal argument is that the revolutionary age prompted increased insecurity and distrust of the lower classes among (socially elite) naval officers that, in turn, caused them to increase use of the lash aboard ships. Historical evidence suggests that the revolutionary crisis awakened reactionary sentiments in the navy. Commanders became increasingly fearful of “mob rule,” sedition, and the radicalization of their crews, fears that were probably exaggerated.
This may have led to a greater willingness to inflict flogging on seamen. A large body of social-psychological research supports the notion that when people are provided with information about general threats to social order they punish more severely, due to emotional states justifying retribution (Goldberg et al. Reference Goldberg, Lerner and Tetlock1999; Lerner et al. Reference Lerner, Jesse and Philip1998; Rucker et al. Reference Rucker, Polifroni, Tetlock and Scott2004; Tetlock Reference Tetlock2002). This line of argument is reinforced by research that shows that when subjects perceive general threats to social order it increases their desire for retribution, which, in turn, increases their punitiveness (Rucker et al. Reference Rucker, Polifroni, Tetlock and Scott2004). Even quite general information to this effect, such as providing a statement that “crime is on the rise,” can increase the propensity to punish.
Although people often perceive themselves as acting on a sound moral basis when they punish, the sources of their moral judgments are emotionally malleable even when they can provide normative rationalizations for the punishments they inflict (Haidt and Kesebir Reference Haidt and Kesebir2010). We expect that a similar process influenced the disposition of Royal Navy commanders as a result of ideological and political threats to the British government after 1789. From that point forward, commanders would have been more likely to use flogging as a way of demonstrating their authority, suppressing disorderly behavior, and deterring potential troublemakers.
H1: Captains should inflict greater punishment on crews operating after 1789.
One of the most direct and threatening challenges to command was collective insubordination, which was generally understood under the rubric of mutiny (Gilbert Reference Gilbert1983; Rodger Reference Rodger1982, Reference Rodger1986). If officers had experienced collective insubordination they would be prone to interpret subsequent deviance as threatening. We expect that commanders who reported having faced collective insubordination aboard their ships would flog more severely to establish their authority and deter rebellion.
H2: Captains should inflict greater punishments on crews that have engaged in collective insubordination.
Alternative Explanations
Prudent captains would seek to punish at levels adequate to show that they were firmly in command, deter deviance and threats to their authority, and avoid costs and dangers, but no more. They would be attentive to conditions and relations aboard their own ships, rather than on global factors such as political changes and revolutionary struggles. Commanders could afford to be magnanimous if they thought that they had a happy ship of satisfied, compliant, seamen. Commanders would have relied more heavily on flogging when they felt that they could not trust the crew or when the crew faced hardships, such as the burdens of long periods of wartime mobilization, foreign or tightly knit crews, and grievances.
Wartime Pressures
It is possible that punishment was more severe during wartime, when the demands for discipline and performance might have been greater. Moreover, long wars resulted in fatigue. Perhaps, as suggested by Black (Reference Black1976: 101–2), long periods of warfare enhance hierarchical power and create greater propensity to punish. If so, rather than local or global perceptions of threat, periods of uninterrupted warfare could have increased burdens on seamen and made the command of warships more difficult.
Foreign Crews
Commanders may have regarded “British” crews as more cooperative and loyal. Distrust for “foreigners”—which in the British mind included the Irish (Colley Reference Colley2003; Hechter Reference Hechter1998)—was widespread among the officers of the Royal Navy, who commonly regarded Irishmen and other foreigners as sources of opposition and disorder (Frykman Reference Frykman2009). Coethnicity has also been found to be an important source of obedience and military cohesion such that commanders may have felt more secure with crews that were predominantly British (Costa and Kahn Reference Costa and Kahn2008). Crews that were more ethnically diverse might have been more severely punished by commanders.
Grievances
Collective hardships might have generated dissatisfaction and grievances among seamen that posed a challenge to command. Under these pressures, commanders may have been inclined to increase flogging. Prior research demonstrates that grievances are associated with rebelliousness in Royal Navy ships (Hechter et al. Reference Hechter, Pfaff and Underwood2016). Such grievances include dissatisfaction with wages, resentment against having been impressed into Royal Navy service, and foreign deployments. Foreign deployment was associated with longer voyages, greater incidence of illness, and inferior rations.
Data and Analysis
In our analysis, we include measures indicative of our hypotheses alongside several variables intended to explore alternative factors that may have influenced commanders’ decisions to inflict punishment.
To generate our sample, we drew from the total population of ship years selected at random from the entire population of Royal Navy ships active from 1740 to 1820. Our sampling frame is Lyon’s (Reference Lyon1993) Sailing Navy List. It contains every ship and its years of service, permitting a ship’s chance of being selected to be conditioned on its duration in the Royal Navy. We sampled ship years: Each potential control appears as a particular ship in a particular year, for example, Adamant-1785. Initially, we selected 284 ship years from the resulting list of all valid ship years. However, archival records proved too incomplete to allow coding for 104 of these ship years, resulting in a final sample of 179 ship years (akin to a 63 percent response rate). Although incomplete records introduce the possibility of a biased sample, particularly because records of smaller ships might be less likely to be preserved than those of larger, more important warships, the resulting sample does not appear to be biased. Our ships have an average rating of 5.43 (on a scale of 1–7 by class of ship) and weigh an average of 710 tons; the ships whose records were missing/incomplete have an average rating of 5.48 and a weight of 699 tons. The two groups are indistinguishable by class and size of ship, which indicates that absent records are probably missing at random. The diversity of ship types in our sample is also comparable to the characteristics of the population of Royal Navy ships. Our sample is random and diverse, but because of its size statistical power is limited and generalizations must be made with caution.
We obtained the data on the cases in our sample and coded them from documents collected in the Admiralty files of the Public Records Office deposited at the British National Archives (TNA: PRO ADM). Our sources include captains’ logs (TNA: PRO ADM) that record the proceedings of the voyage and daily events, including reported disciplinary violations, the name of the offender, and punishments and punishments given; and masters’ logs (TNA: PRO ADM) that record the proceedings of the voyage, the navigation and management of the ship, and daily events, including reported disciplinary violations, the name of the offender, and punishments. Our dependent variables are coded from daily reports made in captains’ and masters’ logs over the course of a given ship year.
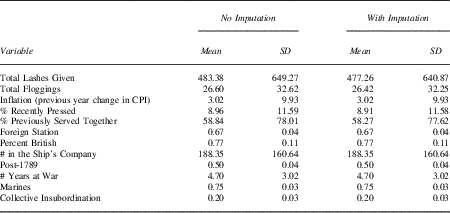
We also employ ships’ muster books (TNA: PRO ADM) that contain information about all the individuals aboard a ship. This includes surname, place and country of birth, nature of recruitment (volunteer or impress), previous ship served (if any), naval rank, desertion, discharge and death, and age at entry onboard. Musters were updated weekly. For the purpose of our analysis, the muster taken in the middle of the month of June of that ship year was used to code data related to the population of the ship. At minimum, coding of the variables we have identified required a ship’s muster book and either captains’ or masters’ logs (see table 1).
Descriptive statistics of variables included in the analysis

Dependent Variables: Total Lashes Given
This measures the number of lashes inflicted in all episodes of flogging during a ship year as noted in captains’ and masters’ logs. In a few instances, floggings are noted in logs, but the number of lashes is unreported. In those instances, we use an estimate of 12 lashes, as it was the standard punishment in naval regulations. In the very rare instances in which flogging is inflicted by running the gauntlet, we treat it as 24 lashes.
Total Punishments Given
This variable measures the total number of floggings inflicted on all crew members (of whatever number of lashes) by summary punishment on board a ship during a ship year as reported in captains’ and masters’ logs.Footnote 3
Independent Variables: Post-1789
To test for our hypothesis about the effect of the Age of Revolution on sentiments concerning social control, an indicator of whether a case is observed after 1789, the year that the French Revolution commenced.Footnote 4
Collective Insubordination
One of the most direct challenges to authority was collective insubordination, which under naval conventions could capaciously be defined as mutiny (Gilbert Reference Gilbert1983; Rodger Reference Rodger1982, Reference Rodger1986). This indicator variable measures if defiant collective action occurred on a ship during the relevant ship year. It is defined as incidents in which two or more seamen were involved in defying command and that was described in ships’ logs as mutinous or insubordinate conduct.
Percent British
We measure the share of the ship’s company that was English, Welsh, and Scottish—the peoples included in Britain’s emerging sense of nationality (Colley Reference Colley2003). The ethnicity of ship’s company is coded by the place of birth for each seaman as reported in the muster book. In cases in which it does not record the place of birth, then ethnicity is inferred from the crew member’s surname. If a surname’s origin is indeterminate ethnically (e.g., the surname “Green”) then the name is coded as English. All surnames originating from continental European ethnicities are coded as European. Estimating ethnicity from surnames, although imperfect, has been used in other studies of military organization (Costa and Kahn Reference Costa and Kahn2008).
Years at War
To explore the possibility that wartime pressures account for penal severity, we calculated for each ship year the corresponding number of years of hostilities in which the Royal Navy was engaged. The wars in our period of study are the Austrian Succession (1740–48), the Seven Years’ War (1756–63), American Independence (1775–83), and the wars of the French Revolution (1793–1802) that ended with the Treaty of Amiens, followed 14 months later by the Napoleonic Wars (1803–15).Footnote 5
Percent Pressed
As a control for impressment, we calculated the share of a ship’s company reported as having been pressed into service in a ship’s muster book.
Foreign Station
We employ an indicator variable measuring whether a ship was in foreign waters for all or part of a relevant ship year, as reported in log books. For coding purposes, foreign stations include operations in the Mediterranean, the West and East Indies, Africa, the Americas, and the Pacific. Excluded are the English Channel, the North Atlantic, and the North and Baltic Seas.
Consumer Price Index
As a control for wage grievances that might have created tension aboard ships (wages were not generally altered with inflation), we measure the change in the consumer price index (CPI) in the year prior to the observation of the case. The historical CPI data for Britain is reported in Twigger (Reference Twigger1999).
Other Covariates
We also include measures as proxies for group cohesion and shipboard security and a control for the size of a ship’s crew.
Percent Joint Service on a Prior Ship
This variable measures the proportion of the ship’s crew that had served with other crew members on the same vessel prior to their assignment to the ship that is the unit of analysis. A high degree of cohesion among seamen on a given vessel may have enabled it to maintain order horizontally (Black Reference Black1976). Alternatively, high social solidarity among seamen may have been seen as a challenge to the commander’s authority, particularly after 1789. It is coded from the muster book.
Marines
One of the roles of marines was to be an armed guard in support of the officers. This indicator variable reports whether a detachment of marines was part of the ship’s company as reported in muster books.
Number in the Ship’s Company
As a control for the size of a ship’s crew, we included it as recorded in its muster book. All things being equal, the larger a ship’s crew the greater the opportunity to inflict punishments.
Limitations of the Data
The logs, in their detail and completeness, provide an incomparable data source for the study of punishment in an early modern setting. All historical research on naval discipline has relied on them (Byrn Reference Byrn1989; Eder Reference Eder2004; Rodger Reference Rodger1986). As Eder (Reference Eder2004: 16) explains, “For naval crime summarily punished on board ship, the best source is the logbooks of individuals ships. The great value of this source material lies in the fact that it provides a more representative description of day-to-day offences, whereas courts-martial mainly focus on serious infractions.” Moreover, the reasons recorded for the floggings run the full gamut from petty to dire offenses (64).
Despite their richness, naval data sources do have limitations (Cock and Rodger Reference Cock and Rodger2006; May Reference May1976). For example, the reported number of men pressed is probably undercounted because some officers gave pressed men the opportunity to enter the books as “volunteers” so as to be eligible for a wage bonus. Another limitation is that captains were not always scrupulous in reporting every flogging or its severity. Fortunately, whenever possible, we code punishment from both captains’ logs and masters’ logs. Redundant sources provide greater reliability; masters were not responsible for inflicting punishment and had little incentive to neglect reporting punishments (in fact, we found masters to be more scrupulous in listing the number of lashes inflicted than captains).
Estimation
In our analysis we regress selected independent variables on two measures of punishment: the total number of floggings (as a measure of frequency) in a given ship year and the total number of lashes inflicted (as a measure of severity). We utilize a two-part regression model to explore and properly account for the discontinuity after 1789. Although this results in a modest increase in Type I error, it is necessary to model the potential changes in the underlying social processes driving the phenomena under study prior to and after the onset of the Age of Revolution that would be lost if we modeled a single stationary time process (see note 6).
We face three challenges in conducting the analysis. First, the size of our random sample of ship years is modest (179 cases). Second, there are missing data on the dependent variable for 15 cases. Given our sample size, we did not want to eliminate these cases and so elected to utilize a multiple imputation strategy. After checking that data were missing at random, we employed the Multivariate Imputation with Chained Equations (MICE) approach because it allows for separate probability models to be used in the imputation of different missing variables and utilizes the full likelihood for estimation. We employed the R package MICE for the imputation procedure (Van Buuren and Oudshoorn 1999).
Table 1 displays means and standard deviations for all variables for both raw and imputed data. The differences in means are very small, which suggests that there are no outsized effects on estimates owing to imputed values.
The third issue is that our sample includes several ship years in which no punishments were inflicted. For both dependent variables we must answer two questions: Are punishments/lashes administered? Given that punishments/lashes are administered, how many are administered? Statistically, these questions take the form of (1) the probability that punishments/lashes are administered and (2) given that punishments/lashes are administered, what is the expected amount given?
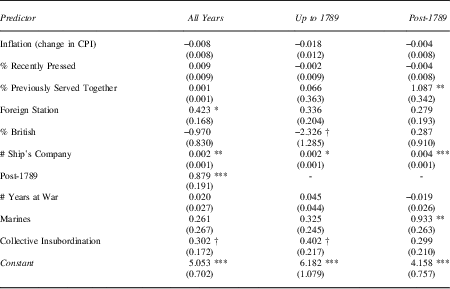
Statistical structures like this are commonly represented using a class of models grouped under the label of “hurdle models.” A common use of such models is to estimate whether an outcome is greater than zero (the “hurdle”) and, if so, the expected value of the outcome (Wooldridge Reference Wooldridge2009). In our case, we model the probability of the number of punishments/lashes being greater than zero with a probit distribution, and we model the expected number of punishments/lashes as a negative binomial distribution (also commonly referred to as a zero-inflated negative binomial model). For the sake of brevity, the probit coefficients and measures related to the imputation process are not reported in the tables. Table 3 shows the effect of each independent variable on the expected value of total number of punishments/lashes, given that the number is greater than zero.
Results
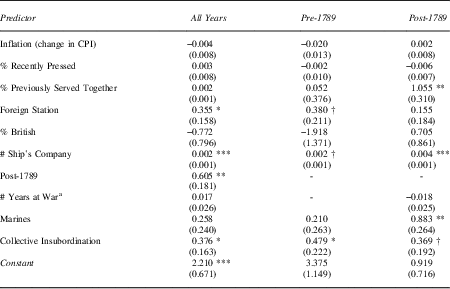
We estimated regression models for our two dependent variables, the total number of lashes inflicted on a ships’ company in a given ship year and the total number of all episodes of floggings in a given ship year. Whereas the total number of lashes is meant to capture the severity of punishment and the total number of floggings its frequency, the measures are very highly correlated (.96). This suggests that the tendency to punish did not divide between strategies of infrequent but severe punishment (perhaps indicative of a general deterrence strategy) or frequent and less severe punishment (perhaps indicative of specific deterrence). Consequently, most of the same factors associated with total lashes are also associated with the total number of floggings, though there are a few differences. The results of our analysis are reported in tables 2 and 3.
Regression coefficients for total lashes given

Note: N=179 for each full imputed data set.
* p<.05, ** p<.01, *** p<.001, † p<.10
Regression coefficients for total instances of flogging

Note: N=179 for each full imputed data set.
a Relationships among this covariate, the DV, and other covariates necessitated its removal to maintain computational tractability in the pre-1789 subsample.
* p<.05, ** p<.01, *** p<.001 † p<.10
For both the models estimating the total number of lashes given and for the total number of punishment events (floggings), the results are in line with our hypotheses that the disposition to punish is affected by perceived threats to political authority and social control.
The results are consistent with our principal hypothesis (H1) about how global threats to social order may affect dispositions toward punishment. Even in the presence of covariates associated with rival explanations, the indicator variable for the post-1789 period is positively and significantly associated with both measures of punishment. This finding is in accordance with the descriptive evidence we found that captains punished more frequently and severely in the revolutionary era than they had before. Our finding is robust to a Chow test of our models of flogging frequency and severity.Footnote 6 When we partition the data on the year 1789, both frequency (X2=74.25, p<.001) and severity (X2=2.16, p=.004) yield significant associations, indicating a structural break in the relationship between the dependent variables and the covariates in the year 1789.
We also find support for our second threat hypothesis (H2). Collective insubordination is positively and significantly associated with both measures of punishment. Commanders punished more severely on ships in which this occurred. This association is consistent with our contention that commanders used flogging to stave off threats to their authority—that is, they not only punished rebellious seamen specifically but punished their crews more harshly generally when they felt challenges to their authority.
The variables we included in our models as proxies for alternative explanations for penal severity have mixed associations with the dependent variables. As expected, the size of a ship’s company is associated with greater punishment—all other things being equal, larger crews provide more opportunities for both deviance and punishment. We do not find that the pressures unleashed by warfare or the enhancement of state power during wartime as measured by years at war are significantly associated with flogging. In the case of the Royal Navy, this may be because wartime did not result in administrative reorganization or substantial changes in penal institutions during our period of study.
The share of the crew that was British is negatively associated with both measures of punishment, although the relationship is not statistically significant. The share of a ship’s company that had served with others on a previous ship is positively associated with both measures of punishment but likewise is insignificant.
Our models also provide support for the alternative explanation that captains perceived the need to flog seamen when they were facing conditions that made command more difficult. As a result, this may have made seamen less compliant. This conclusion is indicated by the positive and significant association between serving in a foreign station and both measures of punishment. However, other measures of stresses that may have made command more difficult (wage depreciation, impressments, the pressures associated with long periods of warfare), as well as alternate models with indicator variables for wartime and 1797, the year of mass mutinies in the Royal Navy (not reported here), have no significant association with flogging.
So as to be more confident about period effects, tables 2 and 3 also report estimates from separate models that analyze observations up through 1789 with those after 1789. When we separate the data into two subpanels, the general impression as to the factors that increased punishment is much the same as when we combine the data, though there are some differing associations. It does not appear that material stresses arising from prolonged periods of hostility were the cause of increasing punishment after 1789. However, in the post-1789 period, two associations are noteworthy. First, the share of the ship’s company that had served together previously is associated positively with both measures of flogging. This is consistent with the intuition that officers would have been more fearful of social solidarity among their crewmen during the revolutionary age. Second, the presence of marines is associated with greater flogging in the revolutionary era. This is surprising but may be consistent with growing insecurity. Despite the hopes of naval officials that they would reinforce social control and enhance security, some officers came to see marines as unreliable, unwilling to go against more skilled seamen, and themselves prone to rowdiness and drunkenness (Lavery Reference Lavery2010: 271).
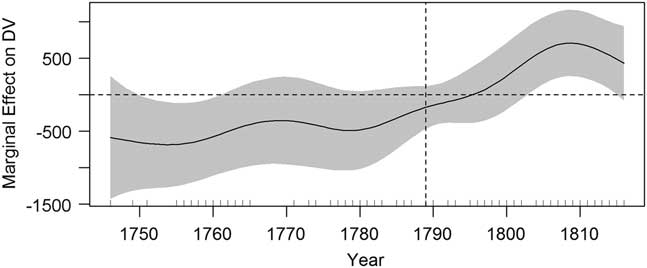
To test the robustness of our findings, we explore whether our hypothesis (H1) that the onset of the revolutionary era increased punishment severity and frequency is temporally bounded. We find that the effect of the revolutionary era on punishment (and, by implication, collective insecurity) does appear to attenuate over time. Figures 3 and 4 display estimates of the effect of time on expected number of punishments and expected lashes, respectively. The figures are visualizations of a semiparametric regression model with all covariates from our model included as parametric terms and year of observation included as a nonparametric spline-based predictor.Footnote 7 The solid line displays the marginal effect of time on the dependent variable. The shaded region represents the 95 percent confidence interval of the spline-based estimate. The horizontal and dashed vertical lines are references to indicate a marginal effect of zero and the year 1789, respectively. Tick marks on the inner x axis indicate the year of each observation.
Estimated Effect of Time on Expected Number of Punishments.
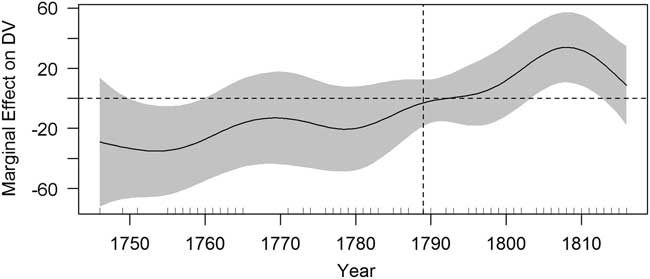
Estimated Effect of Time on Expected Lashes.
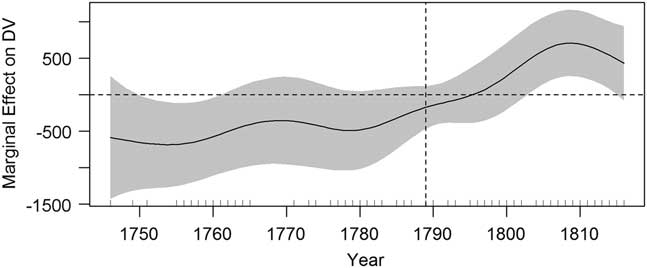
As can be seen in both figures, the pre-1789 period of our data contains a gradual downward trend in frequency and severity of punishment, holding all other variables constant. However, shortly following 1789, the marginal effect of time on frequency and severity becomes positive, indicating a shift toward increasing frequency and severity of flogging over time. Finally, roughly around 1809, the increase over time in frequency and severity begins to attenuate. While this nonparametric estimate is fit entirely to the data and thus is not generalizable to the population of all Royal Navy ships, it is consistent with our expectation that flogging frequency and severity increased in response to the revolutionary crisis and that the effect attenuated over time.
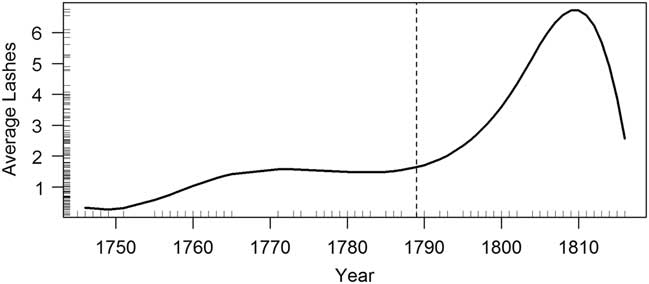
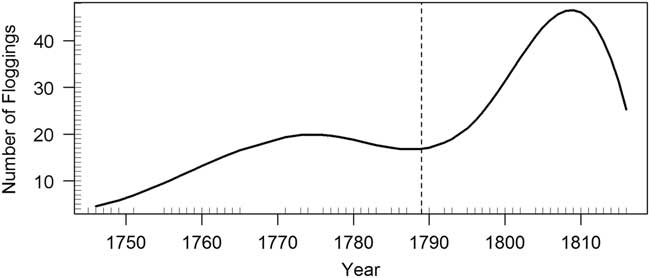
Further evidence that is consistent with our theory is provided by figures 5 and 6 that show the average number of floggings and average lashes per seaman in our sample over time. The solid line shows a B-spline fit to the data, which here serves as a moving average. The dashed line in each figure is a visual reference showing the year 1789. Tick marks on the inner side of the axes indicate observed data values. Taken together, the figures show a clear increase in the frequency and severity of punishment following 1789. Both figures also indicate that, following a peak near 1809, frequency and severity of flogging began to decrease.
B-Spline Average of Observed Number of Punishments.
B-Spline Average of Observed Lashes.
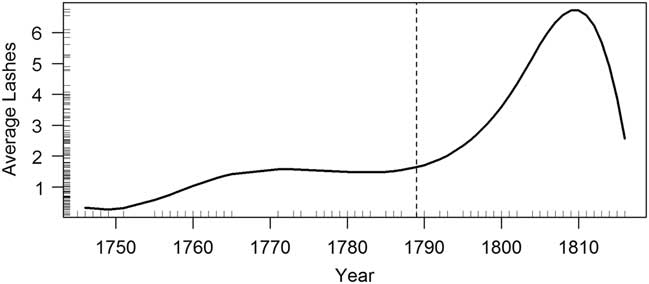
Both the expected effect of time and the observed average levels of flogging presented here are consistent with our argument that captains became increasingly punitive in response to the threat posed by the Age of Revolution. The upward trend in punishment that is conspicuous from the 1790s onward reaches an inflexion point around 1809. As the revolutionary crisis receded, the sense of threat among Royal Navy officers probably ebbed. This would have been reinforced by the impression that Napoleon’s goals had become less revolutionary, as well as by confidence that France and her allies would not be able to repeat an invasion of Ireland (as it had in 1798) or invade England after the decisive defeat of the Napoleonic navies at Trafalgar in 1805. Whereas the observed level of punishment after 1810 is still greater than it was before 1789, a downward trend is observable. The attenuation over time is consistent with our understanding of the underlying social-psychological dynamics that inform our explanation of threat and penal severity.
Conclusion and Implications
Rather than assessing the putative effects of punishment on the commission of crimes, as has been done in much empirical research on social control, our data allow us to take another tack. We analyze the punishments that commanders inflicted in their efforts to secure social order, shifting the focus from offenders to enforcers.
Flogging on Royal Navy ships was instituted to rationalize punishment. In many instances, flogging was an alternative to harsher punishment and to the judicial process. Although many offenses were punishable by hanging under the Articles, flogging was preferred at sea, just as it was in civilian courts on land. Even capital offenses, such as desertion, insubordination, striking superiors, and so on, were usually handled through summary punishment by flogging (Byrn Reference Byrn1989; Eder Reference Eder2004). Partly this was because commanders were loath to send men before courts-martial that might inflict fatal punishments (Rodger Reference Rodger1986), but partly because convening courts-martial and serving on them were costly nuisances (Pope Reference Pope1981: 221).
Summary punishment by flogging was swift and efficient but it is less clear that it was appropriately severe. Used judiciously, flogging does not appear to have been illegitimate. Within customary limits, contemporaries did not regard flogging as cruel or unusual punishment (Earle Reference Earle1998; Rodger Reference Rodger1986).Footnote 8 In civilian merchant ships too, the law gave ships’ masters the right to flog or beat seaman “in a reasonable manner” for “disobedience and disorderly conduct” (Earle Reference Earle1998: 45). Seamen evaluated the justice of punishment in terms of its predictability and proportion, accepting (Lavery Reference Lavery2010; Rodger Reference Rodger1986) “due punishment” and “moderate correction” as an inevitable element of seagoing life (Lavery Reference Lavery2010; Rodger Reference Rodger2004). Yet our analysis suggests that the implicit compact between seamen and officers that undergirds discipline was altered by the Age of Revolution. Behaviors that had been largely tolerated in an informal compact between seamen and their officers became subject to harsher, more oppressive treatment at the end of the 1700s, apparently because officers became more fearful of disorder, intolerant of deviance, and, consequently, more punitive.
The sharp increase in the incidence and severity of punishment in the wake of the revolution suggests that the prejudices and insecurities of naval officers were not kept in check by the penal institutions of the Royal Navy. Systematic analysis of the kind we have presented here could test for period effects in the broader British penal regime. Future research could examine whether changing punitive practices at sea were part of an overall shift in the penal system outside of the navy, as some sources suggest (King Reference King2000, Reference King2006; Sharpe Reference Sharpe1999). Did the frequency and severity of civilian incarceration, flogging, and hanging increase with the onset of the revolutionary age?
Due to the limitations of available historical data we do not have direct systematic evidence of the attitudes of commanders. Nevertheless, this study’s findings are more consistent with our arguments than with most of the rival explanations currently on offer from naval historians. Our findings are also congruent with a literature on punishment showing that threats to an established order can have profound consequences for social control. Societies facing generalized threats to social order impose more severe criminal and penal legislation and, in the courtroom, enforce greater penal severity (Baumer and Martin Reference Baumer and Martin2013; Beckett 1997; Beckett and Sasson Reference Sharpe2000; Garland Reference Garland1990, Reference Sharpe2002; Gottschalk Reference Gottschalk2006). Whereas the triggering events that give rise to a sense of threat may be ephemeral, the resulting attitudinal changes can influence discourses and practices for some time afterward. In the penal domain, beliefs that severity in maintaining security and inflicting punishment are justified may become normative.
Erikson (Reference Erikson2005: 68) proposes: “Whenever a community is confronted by a significant relocation of boundaries…it is likely to experience a change in the kinds of behavior handled by its various agencies of control.” In the Age of Revolution, the increasing tendency to punish seamen for drunkenness and similar affronts may indicate the boundary crises that Erikson has predicted. Drunkenness was always a convenient pretext for inflicting the lash, as seaman Jacob Nagle recalled in his memoirs (Dann Reference Dann1988: 58–63). In the Age of Revolution, however, captains’ tolerance of the rowdiness or disrespect they associated with alcohol appears to have changed. Given that the love of drink and the official alcohol ration did not change, the evidence suggests that increasing severity and upsurge in punishments directed at petty deviance reflect increased insecurity among naval officers and growing distrust of seamen. Fearful of the consequences of disorder and unsure of where their men’s loyalties lay, officers in the revolutionary era became more concerned with moral enforcement, even at the cost of undercutting spontaneous compliance. This is not peculiar to the case of the Royal Navy. For example, officers of the US Army prosecuted drug offenses more zealously in in the context of the Vietnam War era, a period during which they felt threatened by a shifting political culture and perceived attacks on their status (Lennon Reference Lennon1991). In both instances, the unintended consequence appears to have been a further erosion of the sense of community between officers and men and the semivoluntary compliance that made units effective.
If alcohol furnished the pretext for flogging in the Royal Navy, marijuana enforcement may today serve as the pretext for stop-and-frisk policing in American cities (Geller and Fagan Reference Geller and Fagan2010). “Broken windows” doctrines and “zero-tolerance” policies toward petty deviance have empowered street-level law enforcers to tighten control and take action against those deemed threatening to social order (Gelman et al. Reference Gelman, Fagan and Kiss2012). As the case of the Royal Navy instructs, facing perceived threats to political order across times and places, local enforcers are prone to emphasize morality and control at the expense of consensus and consent.