

1. Introduction
The sub-Permian unconformity is a pronounced feature of the geological map of northern England and southern Scotland. It records several tens of millions of years of regional uplift and erosion during and following the Variscan Orogeny (Chadwick et al. Reference Chadwick, Holliday, Holloway and Hulbert1995; Stone et al. Reference Stone, Millward, Young, Merritt, Clarke, McCormac and Lawrence2010), and resulted in strata ranging from probable mid-Permian to early Triassic in age resting discordantly on rocks of Early Ordovician to Asturian (Moscovian) age. As a consequence, the youngest, largely red-bed Carboniferous rocks (Bolsovian–Asturian) are only locally preserved in the region and are not well understood.
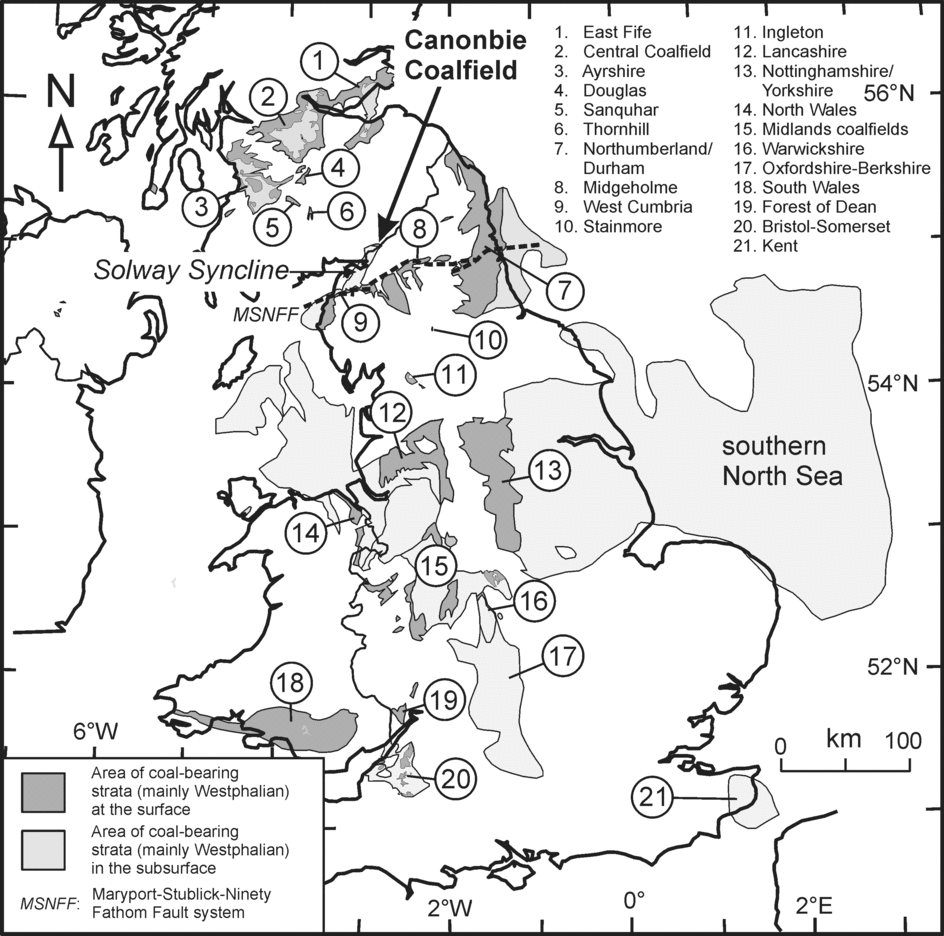
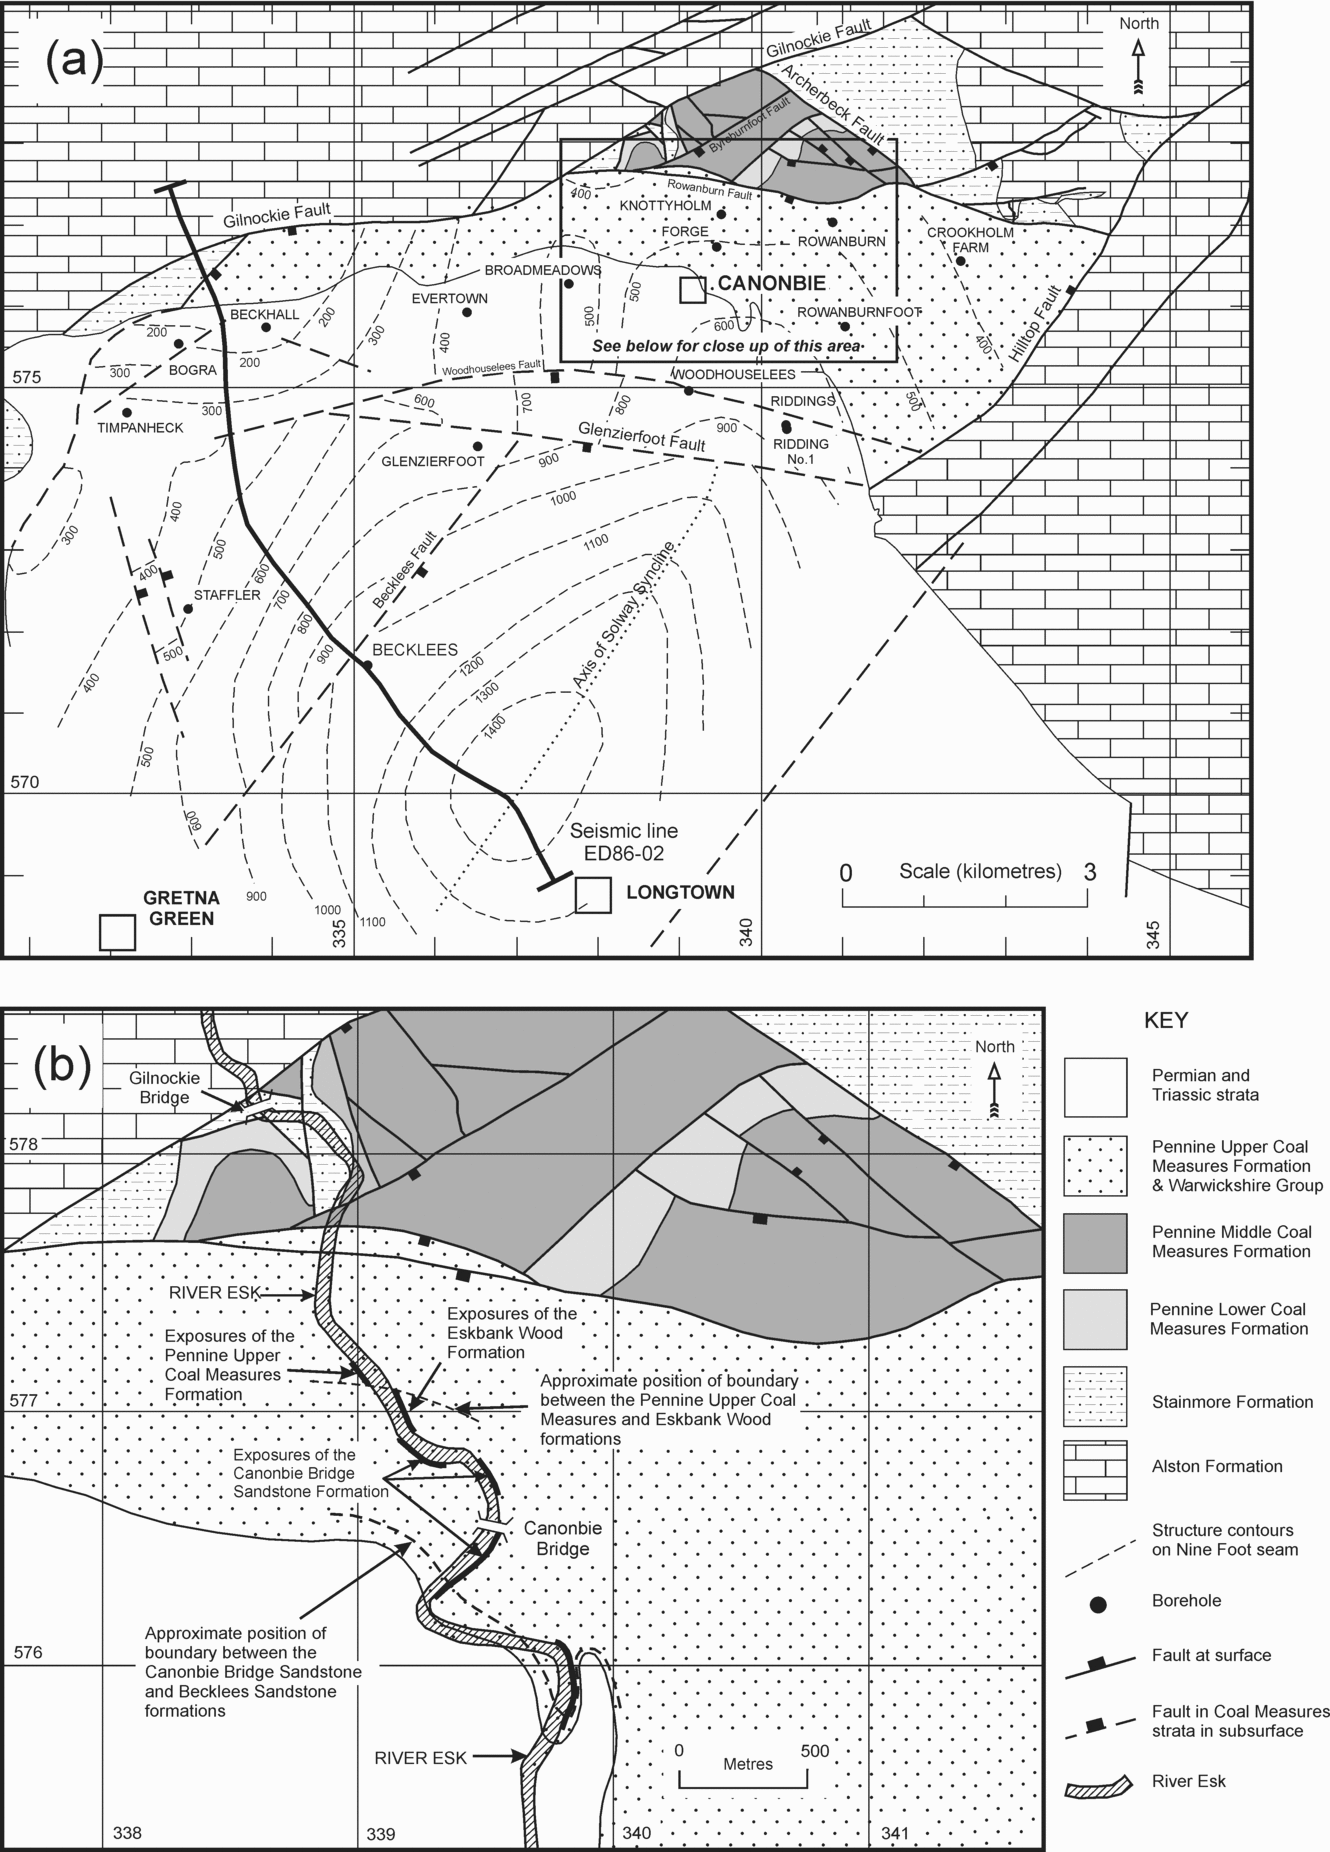
The largest area in northern England and southern Scotland where Upper Carboniferous (Bolsovian–Asturian) strata are preserved is to the south of the Canonbie Coalfield, along the axis of the NNE-trending Solway Syncline (Figs 1–3). They are mainly concealed by the younger Permo-Triassic rocks of the Carlisle Basin but, in a relatively small area straddling the England–Scotland border near Canonbie, they are locally exposed, notably in the River Esk (Fig. 2), providing a rare opportunity in this region to examine these rocks in the field.
General location map for the Canonbie Coalfield and the other UK coalfields mentioned in the text (modified from British Geological Survey, Reference Chapman1999). MSNFF – Maryport–Stublick–Ninety Fathom Fault system.
(a) Geological map of the Canonbie Coalfield and adjacent areas. The positions of the main boreholes used in the study are also marked. (b) Close-up of the outcrop localities studied. Geological linework from BGS 50 000 scale Digmap data with additions from Picken (Reference Picken1988). The map falls within the National Grid 100 km square NY.
Isopach map showing the preserved thickness of Pennine Coal Measures and Warwickshire group strata along the Solway Syncline between the Canonbie and West Cumbrian coalfields. Redrawn with modifications from Map 14 of Chadwick et al. (Reference Chadwick, Holliday, Holloway and Hulbert1995, p. 88). Contours spaced every 200 metres. GF – Gilnockie Fault; MFS – Maryport Fault system; PCMG – Pennine Coal Measures Group; WG – Warwickshire Group.

Previous research in the area has concentrated on the older coal-bearing successions because of their potential economic importance (Peach & Horne, Reference Peach and Horne1903; Barrett & Richey, Reference Barrett and Richey1945; Lumsden et al. Reference Lumsden, Tulloch, Howells and Davies1967; Ramsbottom et al. Reference Ramsbottom, Calver, Eager, Hodson, Holliday, Stubblefield and Wilson1978; Picken, Reference Picken1988). Apart from establishing a broad, generalized lithological sequence, and the presentation of some faunal and floral data, little has been published on the strata above the cambriense Marine Band (Fig. 5).
Stratigraphical subdivision of the younger parts of the Carboniferous is often hampered by the common occurrence of reddening of the strata. Besly & Turner (Reference Besly, Turner and Wilson1983) and Besly, Burley & Turner (Reference Besly, Burley, Turner and Parker1993) have described three phases of reddening of Carboniferous strata: (1) an early syndepositional oxidation of sediments at the time of deposition (termed primary red-beds in this paper), (2) oxidation of initially grey siderite- and coal-bearing sediments by penetrative weathering beneath the Carboniferous land surface soon after deposition, and (3) penetrative or diagenetic reddening of Carboniferous rocks below the sub-Permian unconformity, linked to the ingress of oxidizing groundwaters as a result of periods of subaerial exposure. This penetrative oxidation has been described in detail by Bailey (Reference Bailey1926), Trotter (Reference Trotter1953, Reference Trotter1954), Mykura (Reference Mykura1960), Turner (Reference Turner1980) and Besly (Reference Besly and Glennie1998). The latter two are grouped here as secondary red-beds.
In this account we present the results of a largely field-based stratigraphical and sedimentological study of the red-beds that occur above the Cambriense Marine Band in the Canonbie area. The paper proposes a new lithostratigraphical nomenclature for these red-beds and comparisons are made with other areas of the UK, both onshore and offshore. At the time of field investigation (March 2004 and July 2005), the strata were particularly well exposed along the River Esk at Canonbie as river levels were low and relatively little river sediment was present (Fig. 2). This has allowed us to present a more detailed description than given previously by Barrett & Richey (Reference Barrett and Richey1945) and Lumsden et al. (Reference Lumsden, Tulloch, Howells and Davies1967) of the main River Esk section. Observations from the outcrop sections are supplemented by information from 17 boreholes, drilled into the coal-bearing Langsettian–Duckmantian (Bashkirian) strata (Table 1), and by seismic reflection surveys (Fig. 4). Many of the boreholes were drilled by open-hole rock-bit methods through these mainly red rocks as they were regarded as being of little economic interest. Where cores were taken, they have since been discarded, and descriptions are of variable quality. Fortunately, some of the more recent boreholes, mainly drilled in the 1980s (Picken, Reference Picken1988), have wireline geophysical well-log suites (abbreviated hereafter to well-logs) through this part of the succession.
General metadata for boreholes used in this study
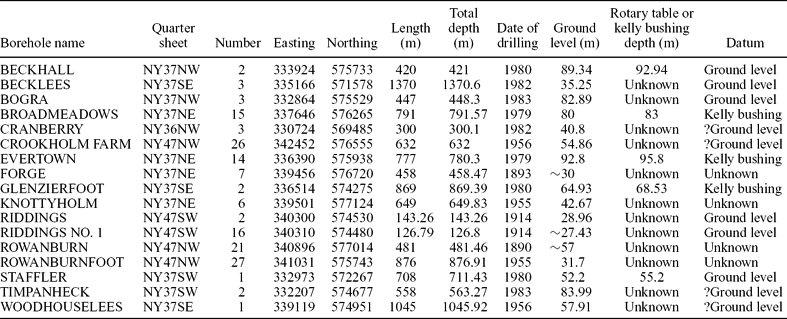
Borehole locations are marked on Figure 2.
(a) Uninterpreted and (b) interpreted NW to SE seismic profile (ED-86-02) across part of the Canonbie Coalfield. The position of this line is shown on Figure 2. BSF – Becklees Sandstone Formation; Carb – Carboniferous; Hercyn u/c – Hercynian unconformity; PCMG – Pennine Coal Measures Group; PUCM – Pennine Upper Coal Measures Formation; SF – Stainmore Formation.

While it was not the primary purpose of this work to carry out a detailed petrographical study, a few samples were analysed by standard optical methods in order to provide further information on the nature of the detrital components within the sandstones (Table 2). These samples were also analysed for their heavy mineral assemblages in order to compare them with the extensive published dataset (Hallsworth, Reference Hallsworth1992; Hallsworth & Chisholm, Reference Hallsworth and Chisholm2000; Hallsworth et al. Reference Hallsworth, Morton, Claoué-Long and Fanning2000; Morton, Claoúe-Long & Hallsworth, Reference Morton, Claoué-Long and Hallsworth2001; Morton, Hallsworth & Moscariello, Reference Morton, Hallsworth, Moscariello, Collinson, Evans, Holliday and Jones2005). Heavy mineral separations from the 63–125 μm fraction were analysed petrographically using the technique of Morton & Hallsworth (Reference Morton and Hallsworth1994, Reference Morton and Hallsworth1999), and using the ribbon counting method of Galehouse (Reference Galehouse and Carver1971) for 200 non-opaque heavy mineral grains (Table 3). A portion of the heavy mineral residue for two samples (22 garnets from Canonbie 1 and NJN101; Table 2) were analysed by wavelength-dispersive electron microprobe (Cameca SX-50) operating at 15 kV and 20 nA. In addition, zircon grains were separated from a Canonbie Bridge Sandstone Formation heavy mineral sample and U–Pb isotopic age dates were made using the Sensitive High Resolution Ion Micro Probe Reversed Geometry (SHRIMP RG); the results of this work are reported elsewhere (Morton, Fanning & Jones, Reference Morton, Fanning and Jones2010).
General metadata for the Warwickshire Group thin-section and heavy mineral samples used in this study
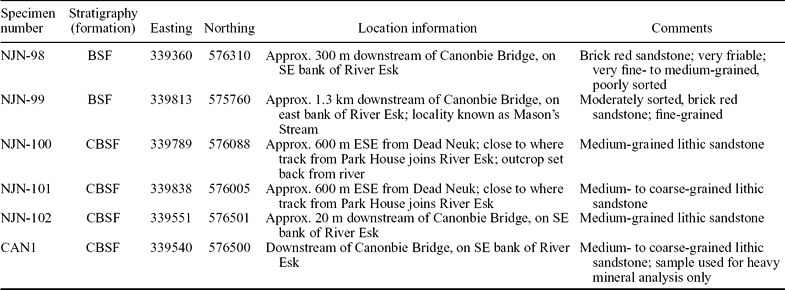
BSF – Becklees Sandstone Formation; CBSF – Canonbie Bridge Sandstone Formation.
Heavy mineral data for the Canonbie Bridge Sandstone Formation (CBSF) and Becklees Sandstone Formation (BSF): (a) point-counted data, and (b) main ratios of heavy minerals with similar grain sizes and densities that determine the relative abundances of minerals with similar hydraulic and diagenetic behaviour

Italicized numbers indicate heavy mineral index data of relatively poor statistical quality.
Mineral abbreviations: Zir – zircon; Rut – rutile; Tor – tourmaline; Apa – apatite; Gnt – garnet; Mnz – monazite; Cr-S – Cr-spinel; Ana – anatase; Amp – amphibole; Sta – staurolite; R – rare. ATi – apatite–tourmaline; CZi – Chrome-spinel–zircon; GZi – garnet–zircon; MZi – monazite–zircon; RuZi– rutile–zircon.
2. Tectonic and regional setting
The Pennsylvanian rocks of the Canonbie Coalfield are terminated to the north by the Gilnockie Fault (Barrett & Richey, Reference Barrett and Richey1945; Lumsden et al. Reference Lumsden, Tulloch, Howells and Davies1967) (Figs 2–4), one of a set of en échelon ENE-trending structures that form the northern margin of the Northumberland–Solway Basin (Chadwick et al. Reference Chadwick, Holliday, Holloway and Hulbert1995). Up to 8000 m of Carboniferous strata were deposited in this basin which was initiated by rifting in Tournaisian times. The Gilnockie and related southerly-directed faults are interpreted as being antithetic syndepositional structures on the northern margin of the basin. Phases of rifting continued until the end of Visean time, but thereafter, dip-slip faulting was much subdued and basin thermal subsidence dominated. The youngest rocks now preserved are Asturian in age and form the subject of this paper.
Towards the end of Carboniferous time, sedimentation ceased and the rocks of the basin were deformed during the Variscan Orogeny when the rocks were faulted, locally thrust, and gently folded. In several parts of northern England and in the southern North Sea, it has been suggested that deposition of the latest part of the basin-fill was contemporary with the early phases of the Variscan Orogeny and that many of the folds are in part syndepositional (e.g. Leeder & Hardman, Reference Leeder, Hardman, Hardman and Brooks1990; Chadwick et al. Reference Chadwick, Holliday, Holloway and Hulbert1995, p. 36; Corfield et al. Reference Corfield, Gawthorpe, Gage, Fraser and Besly1996). Within the study area, Chadwick et al. (Reference Chadwick, Holliday, Holloway and Hulbert1995, fig. 27) and Jones & Holliday (Reference Jones and Holliday2007) have inferred syndepositional thickening of strata into the Solway Syncline beginning in late Visean time. The folding probably occurred as a response to dextral displacement on the Gilnockie Fault and other basin-bounding faults (de Paola et al. Reference de Paola, Holdsworth, McCaffrey and Barchi2005).
3. Pennine Upper Coal Measures Formation
Following the lithostratigraphical subdivision of Carboniferous rocks proposed by Waters et al. (Reference Waters, Browne, Dean and Powell2007) for onshore Great Britain, the oldest rocks described in this account are referred to the Pennine Upper Coal Measures Formation and the overlying red-beds are placed in the Warwickshire Group (Fig. 5). The Pennine Upper Coal Measures Formation comprises mainly grey strata, although secondary red-beds become more common upwards. The formation is about 150 m in thickness in the Becklees and Glenzierfoot boreholes (Fig. 7; Table 1). On the NW flank of the Solway Syncline the full thickness of the Pennine Upper Coal Measures Formation is generally not preserved due to erosion beneath the sub-Permian unconformity.
Lithostratigraphical classification of Pennsylvanian strata in the Canonbie area (based on Trueman & Weir, Reference Trueman and Weir1946; Ramsbottom et al. Reference Ramsbottom, Calver, Eager, Hodson, Holliday, Stubblefield and Wilson1978 and Waters et al. Reference Waters, Browne, Dean and Powell2007). The base of the Westphalian at Canonbie is marked by the presence of a non-sequence locally in parts of the basin centre and an angular unconformity on basin margins. C. – Cravenoceras; Lst – Limestone; U. – Upper.
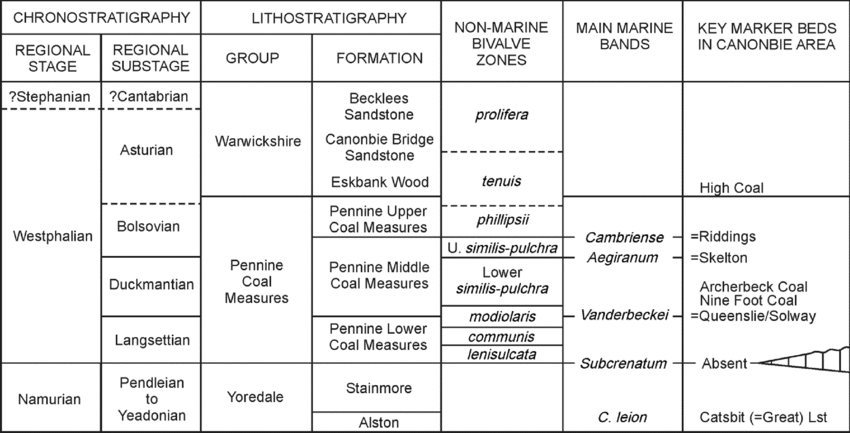
The base of the formation is taken at the Cambriense Marine Band (Figs 5–7), and Picken (Reference Picken1988) suggested that there was a major unconformity at this level, with about 155 m of strata (including the upper part of the Pennine Middle Coal Measures Formation) eroded on the flanks of the coalfield. However, no indication of such a major unconformity has been identified on the seismic reflection sections, and the excellent well-log correlation between boreholes across the coalfield suggests that in fact no strata are missing. There is some indication that the strata are generally thicker along the axis of the Solway Syncline than on its flanks, and also the gradation to primary red-beds may occur at lower stratigraphical levels on the flanks than in the syncline. The basin flanks do appear to contain much more sandstone than along the axis of the syncline, but the log correlations suggest that these are localized channel sandstones present at several different stratigraphical levels and that they do not constitute evidence for the more widespread unconformity suggested by Picken (Reference Picken1988).
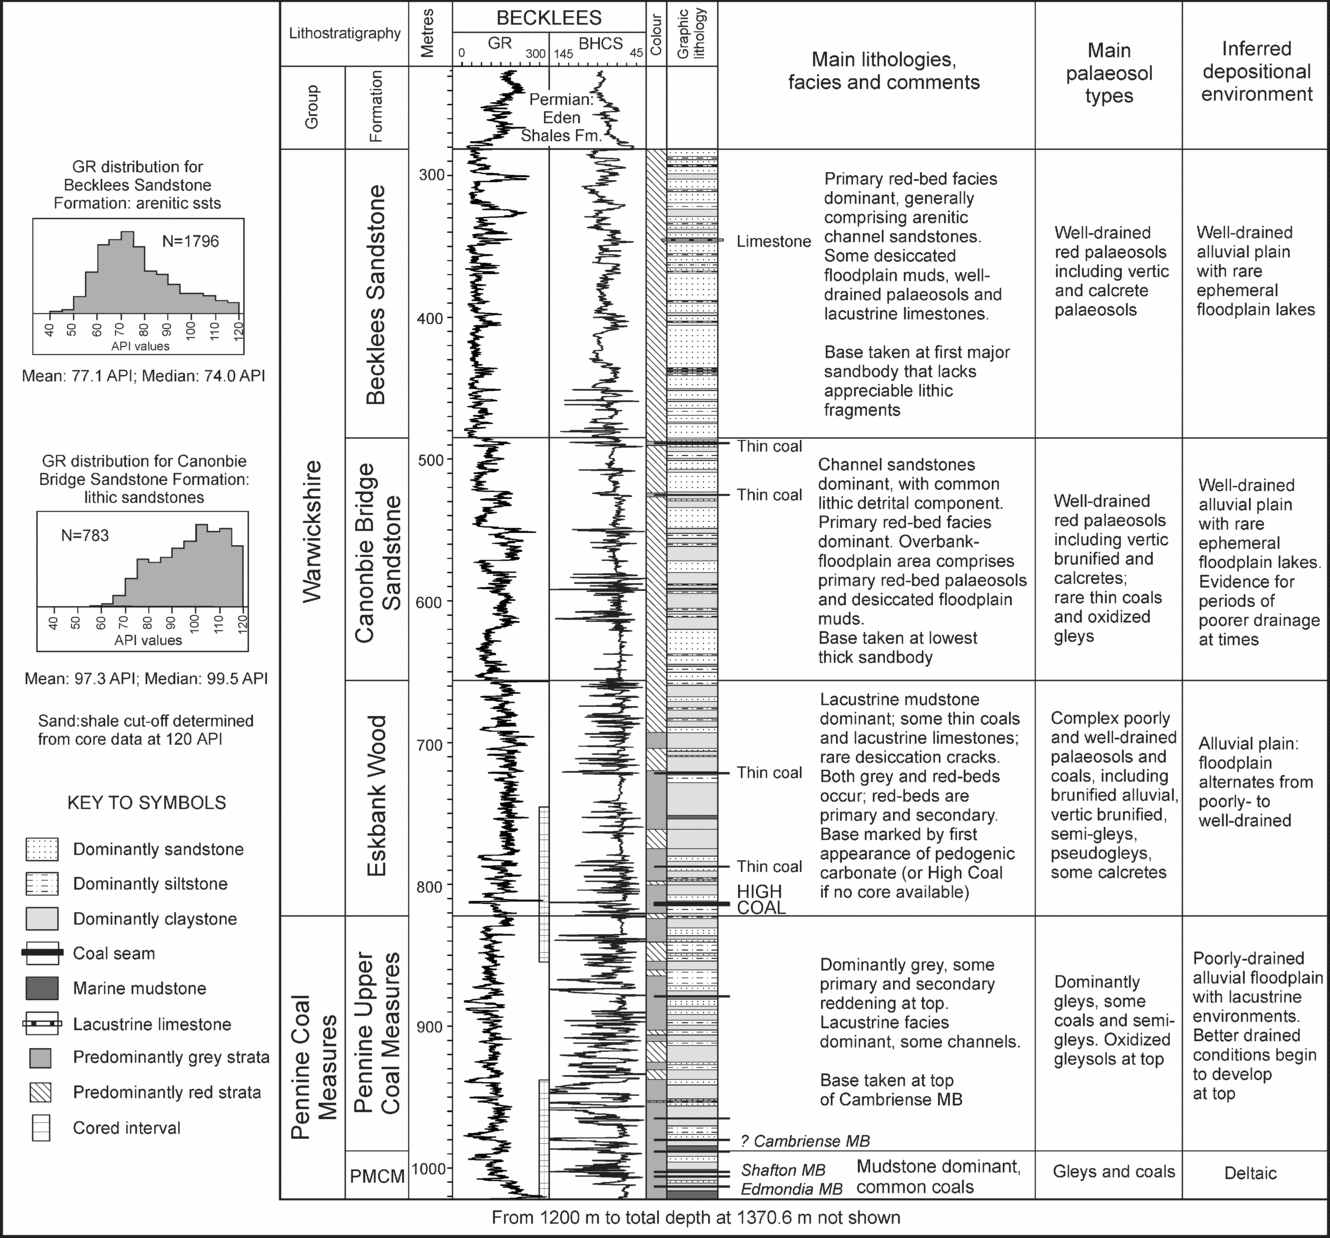
Summary of the main features of the Warwickshire Group from the Canonbie Coalfield (Becklees Borehole). The side panel shows distribution plots of gamma-ray values for the Canonbie Bridge Sandstone and Becklees Sandstone formations and clearly shows that the Canonbie Bridge Sandstone is dominated by higher gamma-ray values, linked to the presence of abundant rock fragments. API – American Petroleum Institute; BHCS – Borehole Compensated Sonic log; GR – Gamma-Ray log; MB – Marine Band; PMCM – Pennine Middle Coal Measures Formation; PUCM – Pennine Upper Coal Measures Formation.
Correlation of the Warwickshire Group and upper part of the Pennine Coal Measures Group from boreholes in the Canonbie area. See Figure 2 and Table 1 for borehole locations. BHCS – Borehole Compensated Sonic log; cong – conglomerate; CPDL – Compensated Photo-density log; Fm. – Formation; Gp. – Group; GR – Gamma-Ray; mst – mudstone; SDU – BPB standard density unit; sst – sandstone.
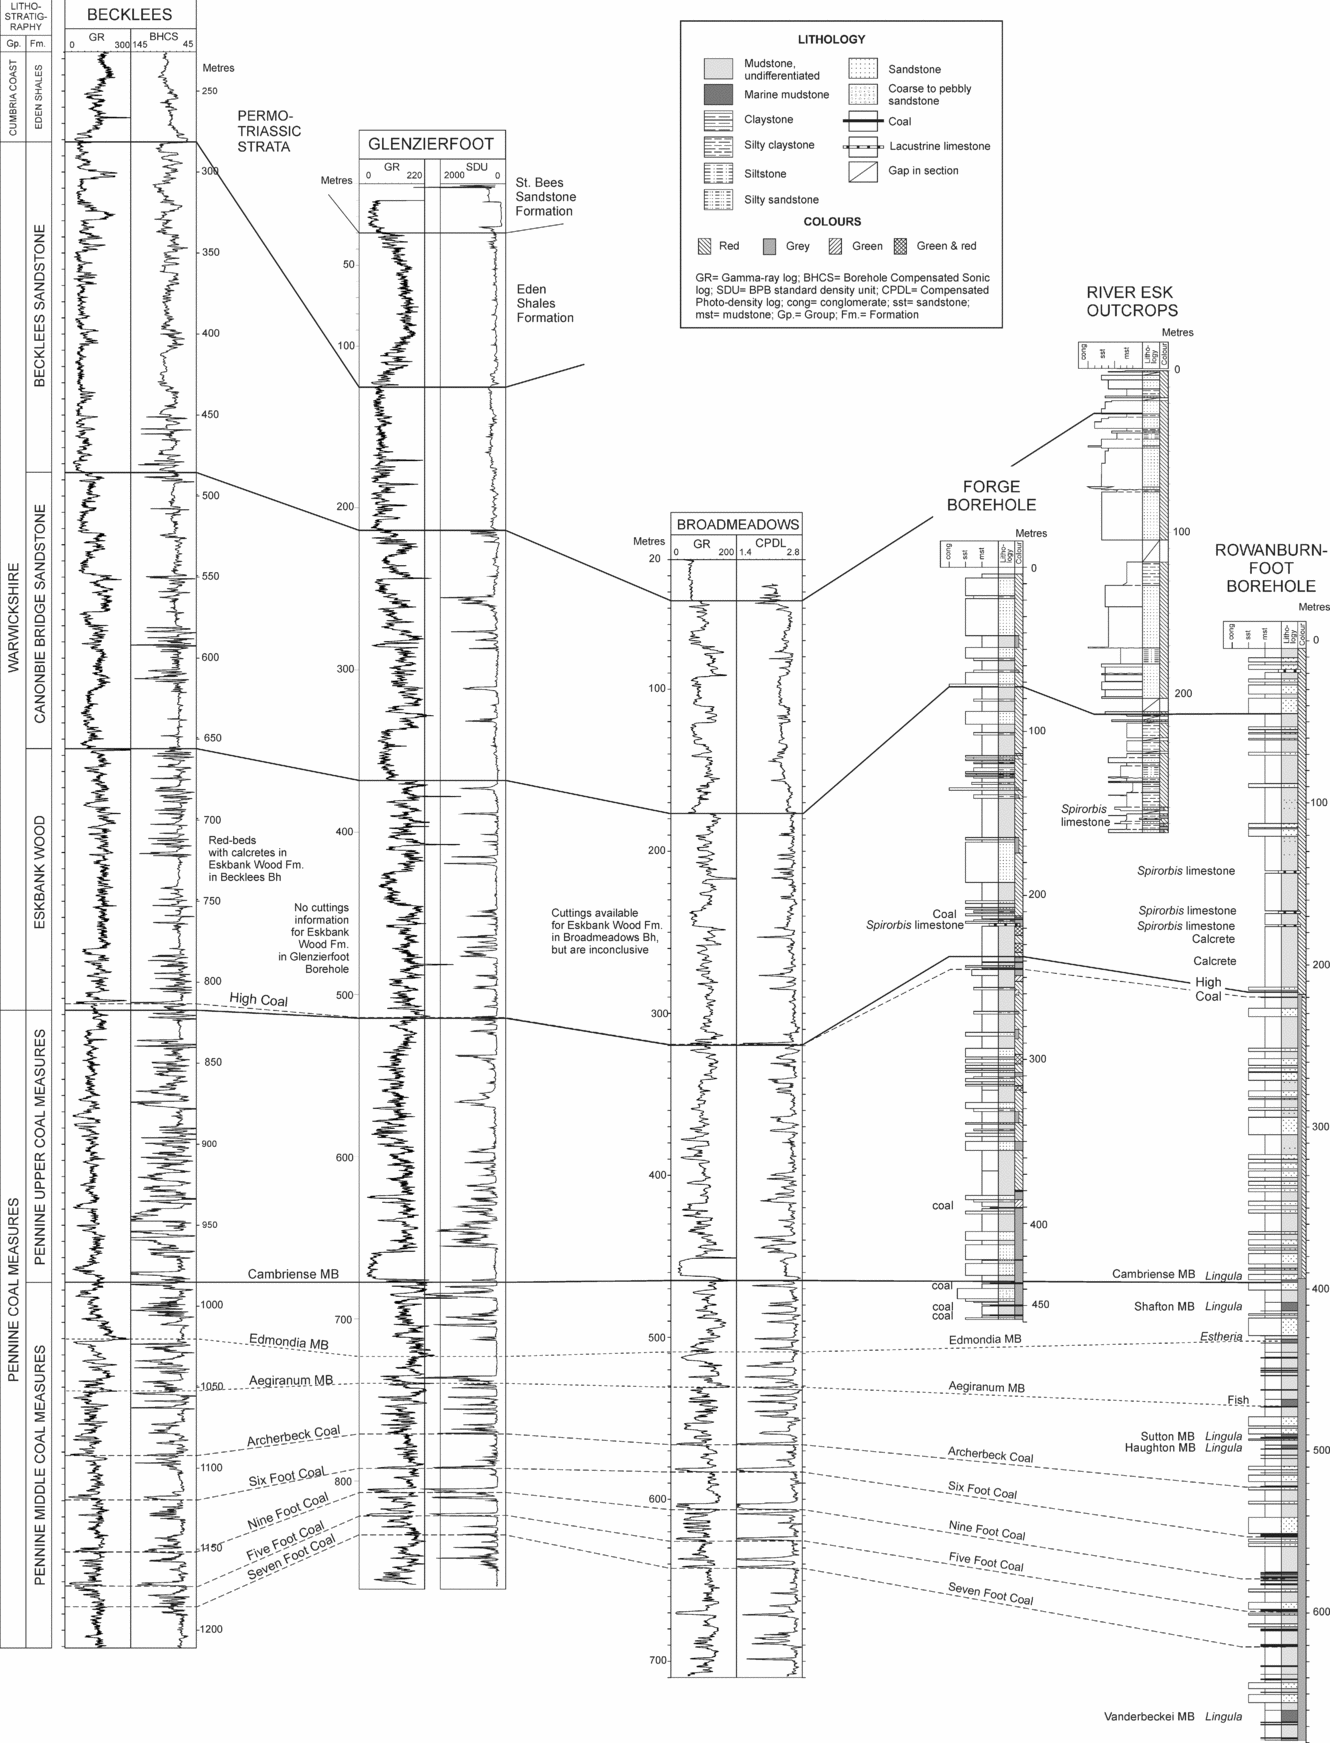
Borehole well-log data indicate that the formation largely comprises mudstones, some coals, Estheria-rich mudstone beds and Spirorbis limestones (Figs 6, 7). Sandstones are generally thin (2–5 m thick), although in the Glenzierfoot and Broadmeadows boreholes a sandstone is present at the base of the formation, forming a single unit up to 20 m in thickness with a distinct blocky gamma-ray character (Fig. 7).
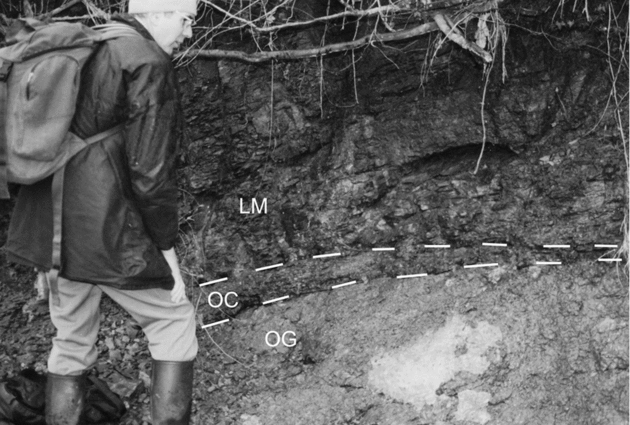
The upper part of the formation can be examined at outcrop along the western bank of the River Esk [between 3905 7715 and 3900 7715] (Fig. 2). Here the succession dominantly comprises pinkish to reddish brown silty claystone, with some sandy siltstone and rare pinkish grey fine- to medium-grained micaceous sandstone. Rooted palaeosols are common, although in places the roots are present only as traces due to the effects of oxidation. Ironstone nodules and thin beds are also commonly present. Oxidized coals also occur, with one example represented by an organic-rich, ferruginous limestone at [NY 3904 7712] (Fig. 8). Mudstones contain a fauna including Anthraconaia pruvosti and Leaia bristolensi, suggesting this upper part belongs to the tenuis Chronozone and thus spans the interval between late Bolsovian and Asturian (Moscovian) (Lumsden et al. Reference Lumsden, Tulloch, Howells and Davies1967; Ramsbottom et al. Reference Ramsbottom, Calver, Eager, Hodson, Holliday, Stubblefield and Wilson1978) (Fig. 5).
Oxidized gley palaeosol overlain by remnants of oxidized coal. Pennine Upper Coal Measures Formation [3902 7714]. LM – lacustrine mudstone; OC – oxidized coal; OG – oxidized gley.
4. Warwickshire Group
The term Warwickshire Group has been applied to the predominantly red-bed strata that typically form the upper part of the Carboniferous succession in the UK previously referred to by such names as the Barren or Red Measures (see Powell et al. Reference Powell, Chisholm, Bridge, Rees, Glover and Besly2000). The type area is the Warwickshire Coalfield in central England (Fig. 1), where the succession attains its fullest thickness of 1225 m (Powell et al. Reference Powell, Chisholm, Bridge, Rees, Glover and Besly2000). In the southern Pennine coalfields the Warwickshire Group is largely unconformable onto older Pennine Coal Measures Group strata, with the ‘Symon Unconformity’ present in places between the two (Powell et al. Reference Powell, Chisholm, Bridge, Rees, Glover and Besly2000). The group ranges in age from late Bolsovian to Autunian (Mid- and Late Pennsylvanian), although, due to the effects of reddening, the degree of biostratigraphical control is reduced compared with the Pennine Coal Measures Group (Besly & Cleal, Reference Besly and Cleal1997; Powell et al. Reference Powell, Chisholm, Bridge, Rees, Glover and Besly2000).
The basis for the recognition of the group is that primary red-beds must be present. The group typically comprises red mudstones and sandstones, with varying amounts of pebbly sandstone, conglomerate, grey mudstone, thin coals, lacustrine limestone (‘Spirorbis limestone’) and calcrete palaeosols. The lithologies of the Warwickshire Group formed predominantly within oxygenated surface conditions within a drier climate.
The Warwickshire Group has not previously been recognized from the Canonbie area, although earlier work had recorded the presence of red strata in the ‘Upper Coal Measures’ of the area (Peach & Horne, Reference Peach and Horne1903; Simpson & Richey, Reference Simpson and Richey1936; Barrett & Richey, Reference Barrett and Richey1945; Trotter, Reference Trotter1953; Lumsden et al. Reference Lumsden, Tulloch, Howells and Davies1967; Day, Reference Day1970; Picken, Reference Picken1988). Picken (Reference Picken1988) described the succession as largely comprising interbedded sandstones and mudstones, generally calcareous. Marker beds include Spirorbis limestones and a persistent coal that was named the High Coal (Fig. 6).
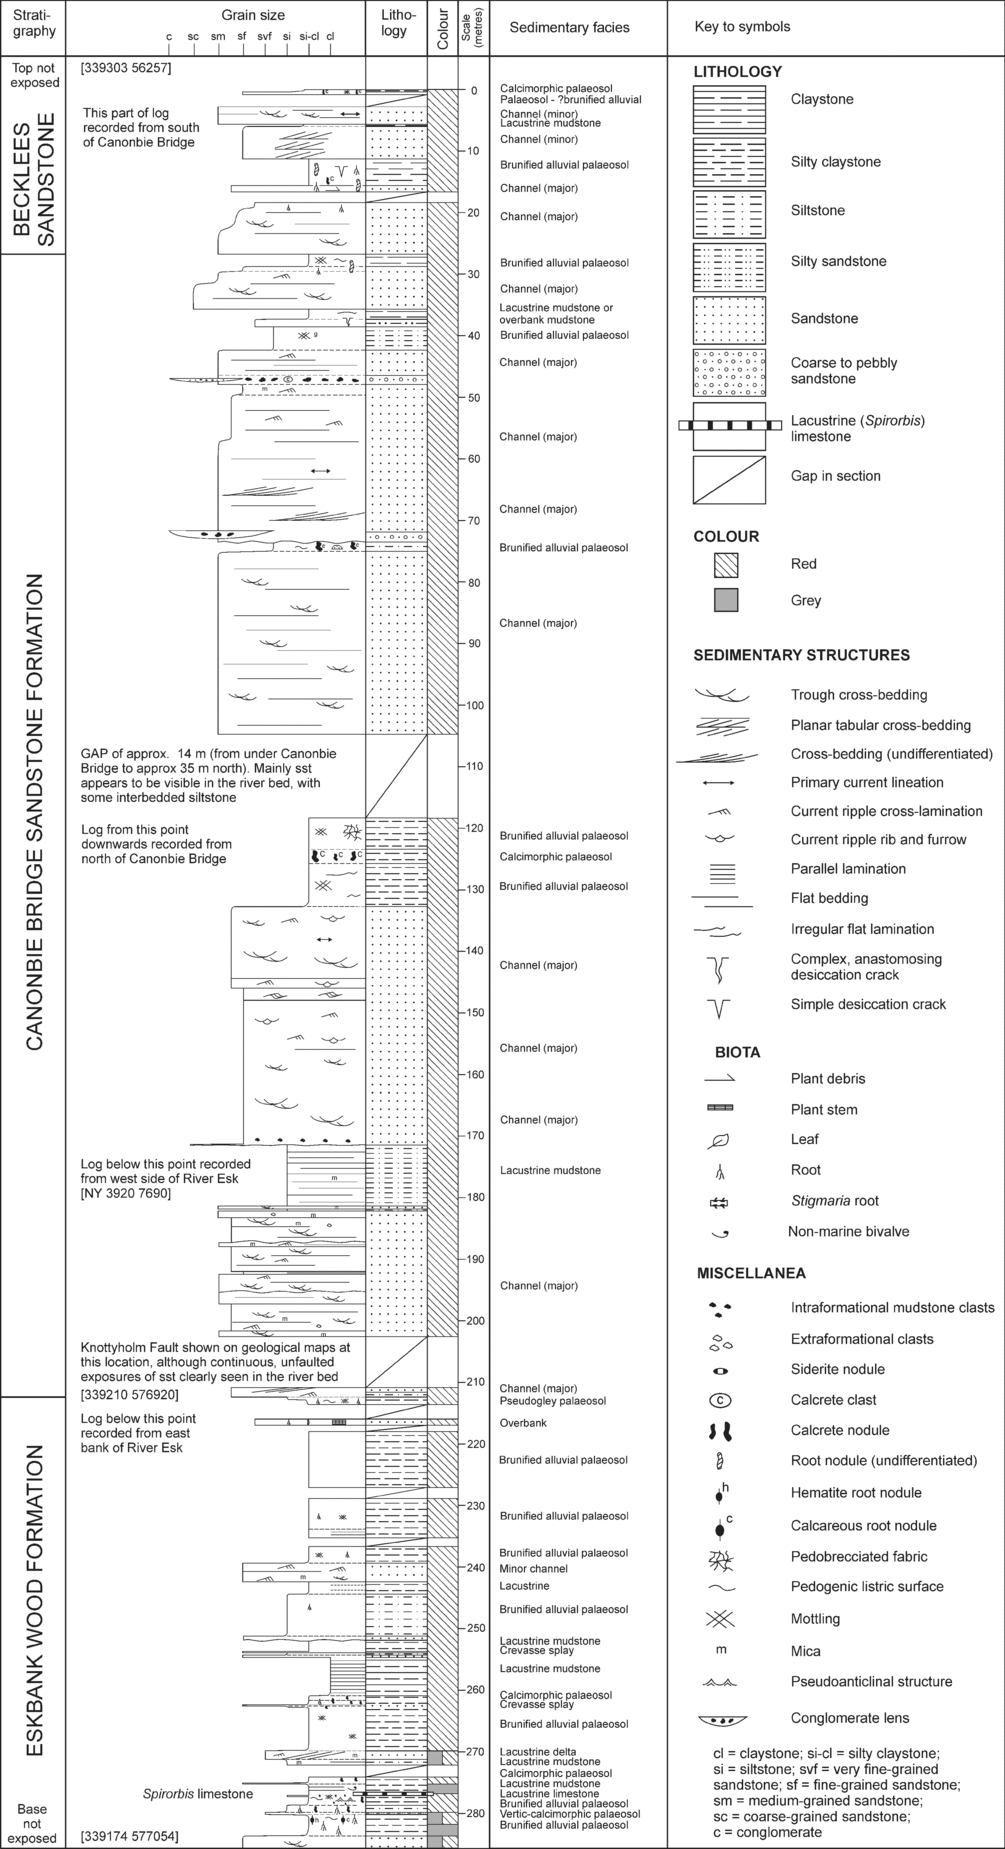
The detailed stratigraphy in the Canonbie area has been determined by a study of the outcrops along the River Esk between [3915 7706] and [3981 7576] which form the type section (Fig. 9), together with the relevant borehole information. As a result of this work, three subdivisions of the group have been identified, described below from oldest to youngest. These have been given formation status and were named and defined by Jones & Holliday (Reference Jones and Holliday2007). Due to the extensive Devensian and Holocene cover in the area it is difficult to map these formations in the field, hence they should be regarded as informal names. However, they are readily identifiable at outcrop along the River Esk and from detailed descriptions of borehole core.
Composite sedimentological log of the Warwickshire Group succession exposed along the River Esk, Canonbie between [3917 7705] and [3930 6726].
4.a. Eskbank Wood Formation
This formation is 145–175 m thick, although the full thickness of the formation is not always preserved on the northwestern flank of the coalfield due to erosion at the sub-Permian unconformity surface. The formation dominantly comprises mudstone (60–70 %) with the remainder being largely sandstone. Red mudstones are interbedded with fine- to medium-grained sandstones, calcrete palaeosols, thin beds of Spirorbis limestone and Estheria-bearing mudstones. Sparse thin coals and grey mudstones are present in the lower part of the formation; some of these coals have been oxidized and altered to limestone. One thick coal (the High Coal), locally up to about 1.2 m thick, is known only from boreholes (Figs 6, 7). The outcrop section [NY 392 770] proves up to 75 m of the formation, including mudstones that contain at several localities a non-marine fauna, particularly bivalves, identified as Anthraconauta phillipsii, A. aff. phillipsii, A. cf. tenuis, A. cf. wrightii, possibly Anthracomya pruvosti and also ostracods (A. E. Trueman in Barrett & Richey, Reference Barrett and Richey1945, p. 39; Lumsden et al. Reference Lumsden, Tulloch, Howells and Davies1967, p. 178), and indicative of an Asturian age (Fig. 5).
The conformable, slightly diachronous base of the formation is taken at the first major primary red-bed strata overlying the grey Pennine Upper Coal Measures Formation (Fig. 6) and is difficult to locate in uncored boreholes. Its exact position differs between boreholes but it generally occurs close to the High Coal. The gradational nature of the boundary indicates there was local variation and alternation between oxidizing and reducing conditions. As the High Coal can be identified in open-hole from suitable well-logs (e.g. sonic and density logs), it is suggested that, in the absence of core data, the top of the coal is taken to mark the boundary between the Pennine Upper Coal Measures and the Eskbank Wood formations (Figs 6, 7).
4.b. Canonbie Bridge Sandstone Formation
This formation is more or less continuously exposed along the River Esk in the immediate area north and south of Canonbie Bridge (Fig. 2) and its base is taken at the lowermost sandstone bed in a thick (20–30 m) multi-storey sandstone complex at [3919 7695] (Fig. 9). The formation ranges in thickness from 131 m in Broadmeadows Borehole up to a maximum of 168 m in the Becklees Borehole (Figs 6, 7). On the northwestern flank of the Canonbie Coalfield the full thickness of the formation is not always preserved due to erosion at the sub-Permian unconformity surface.
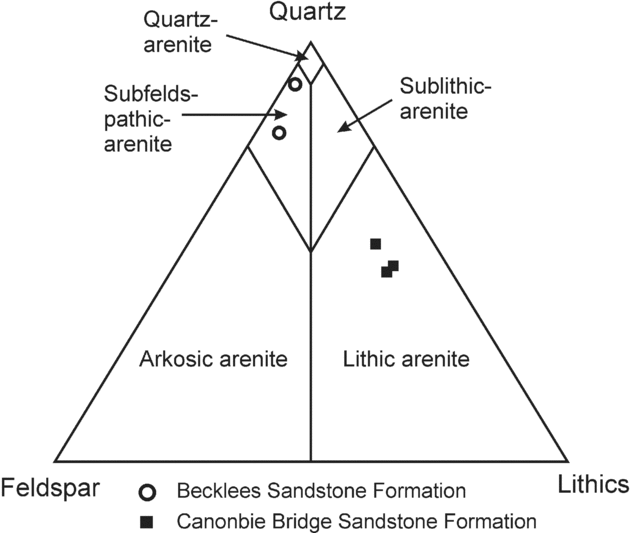
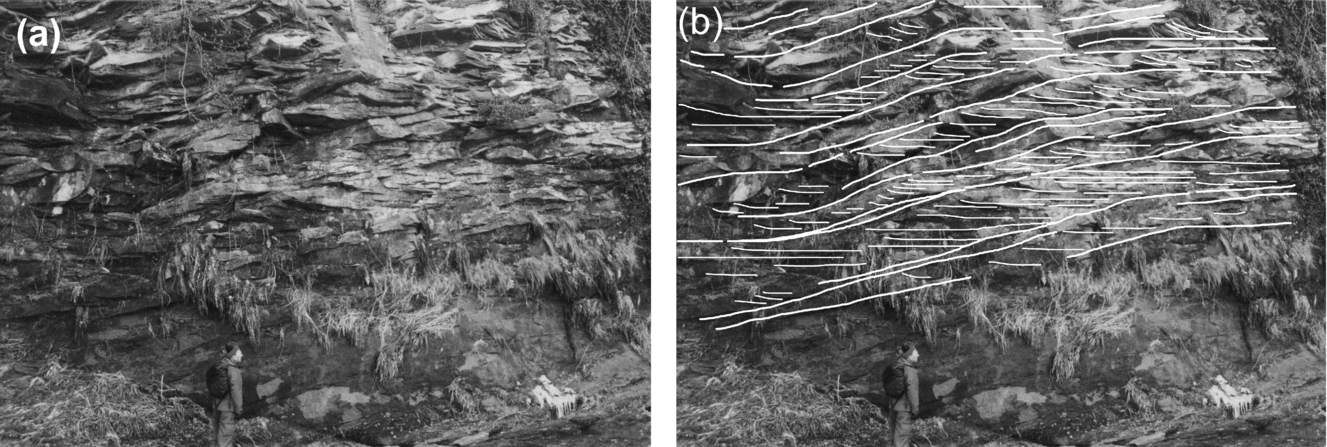
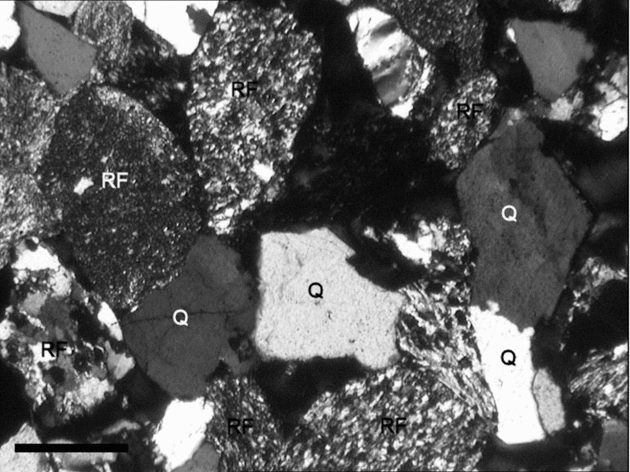
The formation comprises interbedded reddish brown to greenish grey, moderately to poorly sorted, fine- to coarse-grained lithic arenite sandstones (50–70 %) (Fig. 10), reddish brown mudstones and reddish brown mudstone palaeosols including calcretes. Sandstones are generally cross-bedded, forming individual sharp to erosively based channellized units that range in thickness from 2 to 10 m. In some places these amalgamate into multi-storey sandbodies up to 40–50 m thick (Fig. 11). Intraformational mudstone conglomerates occur scattered throughout the sandstones but are more common lining channel bases. In hand specimen the sandstones can be micaceous and contain a noticeable component of greenish grey grains that, in thin-section, can be identified as lithic clasts, mainly comprising fine foliated or schistose low-grade pelitic and psammitic metasedimentary clasts (Table 4; Fig. 12). The high lithic component gives the sandstones higher gamma-ray log values compared to the overlying Becklees Sandstone (Fig. 6).
Ternary diagram to show the classification of the Warwickshire Group sandstones. Classification scheme after Pettijohn, Potter & Siever (Reference Pettijohn, Potter and Siever1987).
(a) Example of cross-bedding within the channel facies; (b) Line drawing of (a). Cross-bedding foresets dip to the right and set bounding surfaces, marked by thicker lines, dip to the left. There is a structural dip of about 18° down to the south at this locality. Canonbie Bridge Sandstone Formation, west bank of the River Esk [3918 7690]. View looking SW. Height of visible part of person is 1.7 m.
Petrographic and heavy mineral characteristics of the two main sandstone types from the Warwickshire Group of the Canonbie area
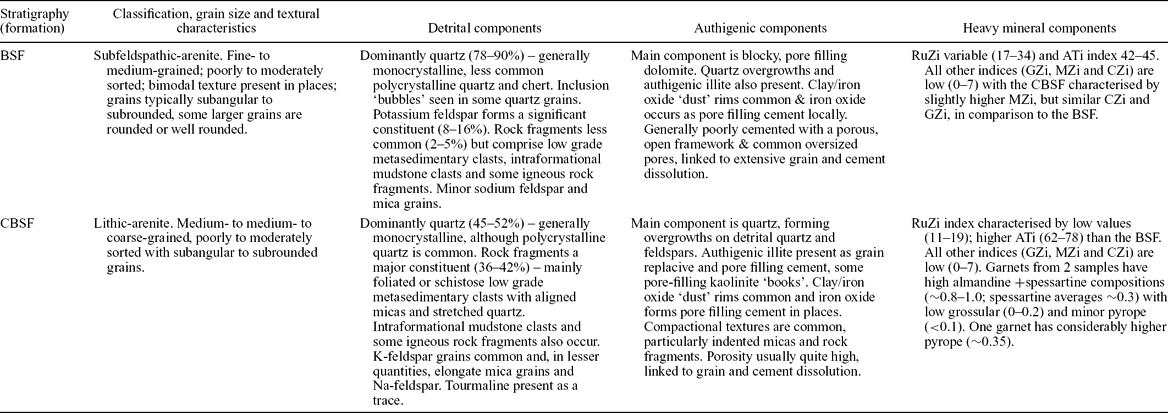
BSF – Becklees Sandstone Formation; CBSF – Canonbie Bridge Sandstone Formation. ATi–apatite–tourmaline; CZi – Chrome-spinel–zircon; GZi – garnet–zircon; MZi – monazite–zircon; RuZi – rutile–zircon.
Thin-section photomicrographs of the Canonbie Bridge Sandstone Formation (Sample NJN101) in plane polarized light to show the common occurrence of lithic rock fragments (RF). Also present are quartz grains (Q). Scale bar is 0.5 mm across.
4.c. Becklees Sandstone Formation
The Becklees Sandstone Formation is the uppermost unit recognized and its top is truncated at the sub-Permian unconformity. Thus its full thickness is not known, but boreholes show that at least 200 m of probable late Carboniferous strata conformably overlie those of the river section; seismic reflection surveys indicate that this thickness could be up to 700 m along the axis of the Solway Syncline (Chadwick et al. Reference Chadwick, Holliday, Holloway and Hulbert1995) (Fig. 4). Although these higher strata cannot be directly examined, their well-log and seismic reflection character suggest that they are similar to the youngest Carboniferous red-beds seen at outcrop.
The formation comprises interbedded subfeldspathic arenitic sandstones (70–90 %) (Fig. 10), reddish brown mudstones and reddish brown mudstone palaeosols including calcretes. Limestones and thin coals are also recorded in cuttings from the Becklees Borehole, although these are uncommon and were not seen at outcrop.
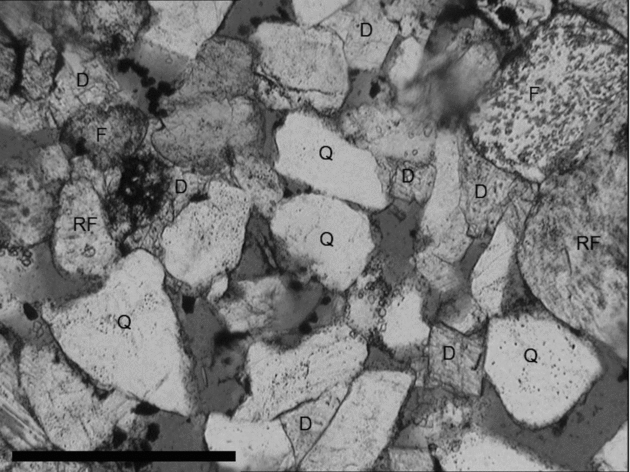
Sandstones are fine- to medium-grained, orange brown to bright reddish brown and pinkish brown, moderately to well sorted and typically lack mica. They are generally cross-bedded and occur in thick, sharp-based successions (10–30 m), some showing fining upwards. The sandstones contain a noticeably lower proportion of lithic clasts and more rounded grains than the underlying Canonbie Bridge Sandstone Formation (Table 4; Fig. 13). At outcrop this lithological change is abrupt; in well-logs it can be seen as a lower response on the gamma-ray log (Fig. 6). Sand-filled polygonal cracks penetrating the Canonbie Bridge Sandstone Formation have been recorded at the base of the formation [3936 7631]. These may be joints which, if this is the case, would point to a significant time gap between the deposition of the two formations, marked by lithification of the Canonbie Bridge Sandstone.
Thin-section photomicrograph of the Becklees Sandstone Formation (Sample NJN99) in plane polarized light. Quartz (Q) forms the dominant detrital component, with minor feldspar (F) and rock fragments (RF). Rhombs of dolomite cement (D) can also be seen in places. Scale bar is 0.5 mm across.
5. Warwickshire Group sedimentology and depositional environments
Four facies associations are recognized in the Warwickshire Group succession at Canonbie (Table 5). Detailed description of the sedimentology of the succession can be found in the online Appendix at http://journals.cambridge.org/geo.
Characteristics of the facies associations and facies recognized from the Warwickshire Group of the Canonbie area

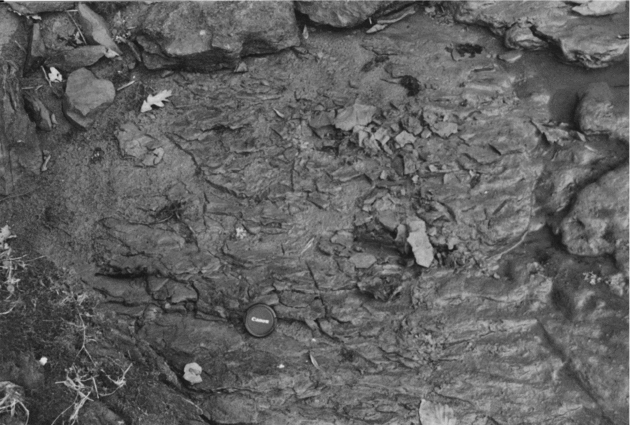
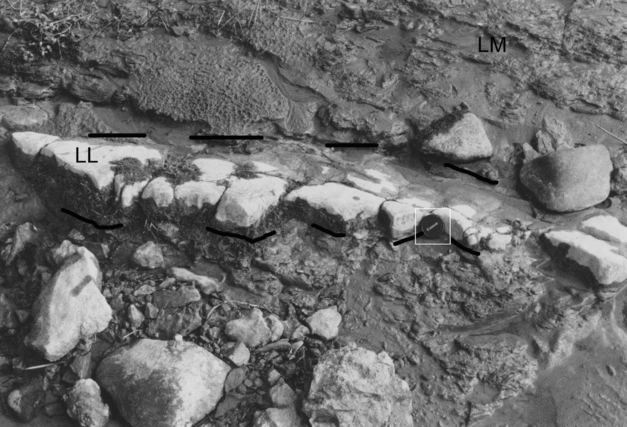
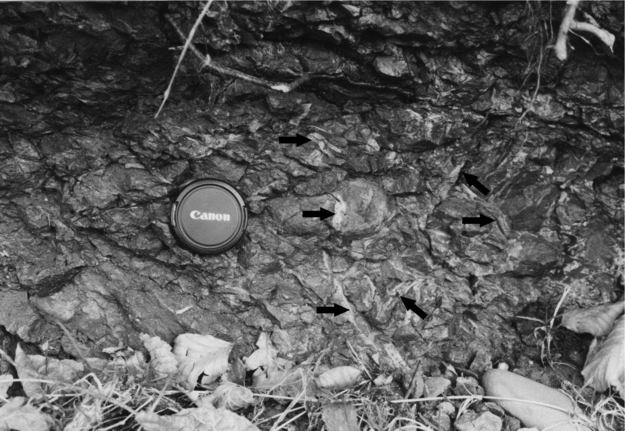
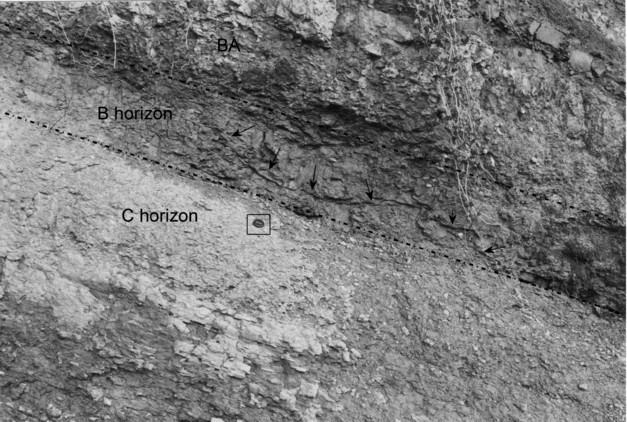
Initially sedimentation in the lower part of the Warwickshire Group (Eskbank Wood Formation) occurred on a poorly drained alluvial plain in which reducing conditions dominated, marked by the presence of peat mires and floodplain lakes. Grey lacustrine mudstones (Fig. 14) were also deposited, and these can contain a varied fauna including Estheria and non-marine bivalves (e.g. Anthraconauta, Modiolaris and Naiadites). The deposition of thin fresh-water limestones (Fig. 15) suggests the periodic development of shallow, well-oxygenated fresh-water lakes, possibly characterized by high rates of surface-water evaporation. Into these lakes small lacustrine deltas formed, fed from river systems. The presence of thick channel sandstones with blocky gamma-ray profiles and thin-bedded crevasse splays indicates that, at times, the environment became more akin to an alluvial plain rather than a wetland. Poorly drained soils were typically formed at this time, although periods of better-drained conditions were characterized by the development of semi-gley, pseudogley and brunified alluvial types, with common red and green mottling of the soil profiles (Table 5; Figs 16, 17). Incipient calcimorphic soils, represented as isolated carbonate nodules within brunified alluvial soils, are also recorded in the lower part of the Warwickshire Group.
Example of the lacustrine mudstone facies. Note the presence of parallel lamination marked by preferential splitting of laminae. Lens cap for scale is 5 cm across. Eskbank Wood Formation, River Esk [3915 7705].
Lacustrine limestone facies forming the resistant, lighter coloured bed. Lens cap for scale is 5 cm across. Eskbank Wood Formation, River Esk [3915 7705]. LL – lacustrine limestone; LM – lacustrine mudstone.
Example of a pseudogley palaeosol with common pedogenic listric surfaces and lighter coloured goethitic mottling (arrowed) along former roots. Eskbank Wood Formation, River Esk [3922 7693]. Lens cap for scale is 5 cm across. For a colour version of this figure see online Appendix at http://journals.cambridge.org/geo.
Example of a vertic brunified palaeosol (B horizon). Note the prominent curved ‘slickensided’ surfaces (arrowed) overlying nodular accumulations of pedogenic carbonate (calcrete) in the underlying C horizon. A brunified alluvial palaeosol (BA) is present above. Eskbank Wood Formation, River Esk [339174 557705]. Lens cap for scale is 5 cm across. For a colour version of this figure see online Appendix at http://journals.cambridge.org/geo.
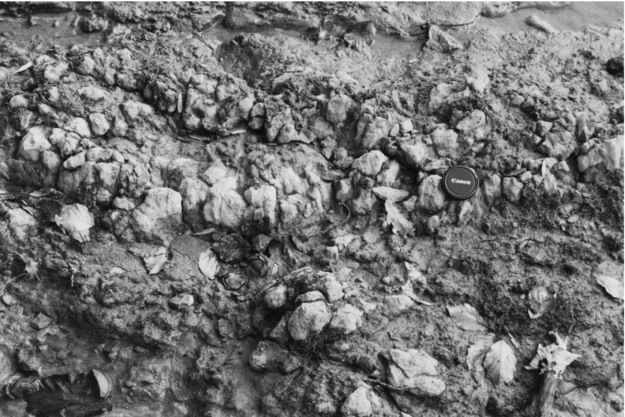
The upper part of the Eskbank Wood Formation shows an increasing development of better-drained floodplain conditions marked by shallow lakes and floodplains that often dried out, leading to the formation of desiccation cracks and better-drained soils. Brunified alluvial and calcimorphic palaeosols become dominant, some of which can be quite well developed (Fig. 18). Lacustrine facies are also present, but are less common than lower in the formation. These are generally red but lack features indicative of well-drained conditions (e.g. desiccation cracks), suggesting periods of subaqueous deposition, possibly in reducing conditions. These were later oxidized and reddened, probably early in the diagenetic process. Channels are also known, but they are typically minor and do not form a significant percentage of the formation.
Example of a calcimorphic palaeosol (calcrete), with coalesced carbonate glaebules. Eskbank Wood Formation, River Esk [3915 7705]. Lens cap for scale is 5 cm across. For a colour version of this figure see online Appendix at http://journals.cambridge.org/geo.
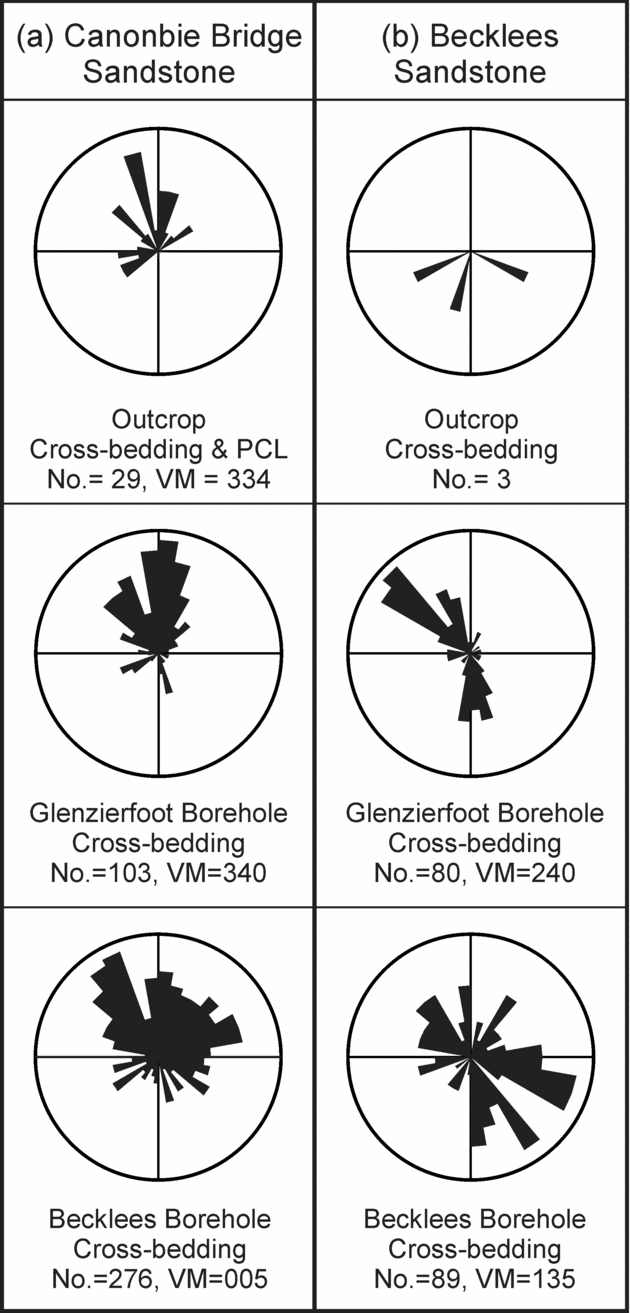
The Canonbie Bridge Sandstone Formation shows a marked and apparently abrupt change in sedimentation patterns, with the establishment of an alluvial plain in which large fluvial systems dominated (Fig. 11). Typically these channels carried a coarse sediment load marked by presence of common lithic detritus, recycled from an earlier metasedimentary terrain. Such fluvial systems record the delicate interplay between subsidence, base-level change and sediment supply, with a high sediment load combined with increasing rates of accommodation space generation suggested. Palaeocurrent analysis indicates that these channel systems flowed from south to north, with low sinuosity channel systems suggested by the low spread of the palaeocurrent data (Fig. 19). Locally, overbank and well-drained palaeosol facies are known, with brunified alluvial and calcimorphic palaeosols dominant (Figs 20, 21). This indicates that the floodplain was generally well-drained, although a thin coal is reported from cuttings from high in the Canonbie Bridge Sandstone Formation in the Becklees Borehole, which would record a temporary reversal to poorly drained conditions.
Palaeocurrent rose diagrams for channel facies from (a) Canonbie Bridge Sandstone Formation and (b) Becklees Sandstone Formation. These data are restored with respect to structural dip. Data for the Becklees and Glenzierfoot boreholes are derived from analysis of dipmeter data. No. – number of readings; PCL – primary current lineation; VM – vector mean.
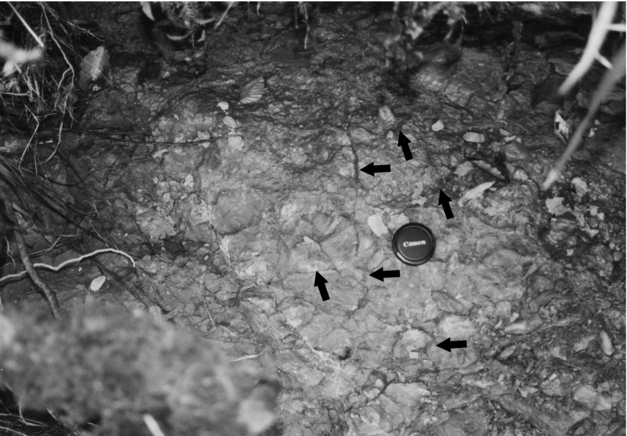
Example of a vertic brunified palaeosol, with complex brecciated, desiccated fabric (arrowed). This view is subparallel to bedding. Canonbie Bridge Sandstone Formation, River Esk [3944 7636]. Lens cap for scale is 5 cm across. For a colour version of this figure see online Appendix at http://journals.cambridge.org/geo.
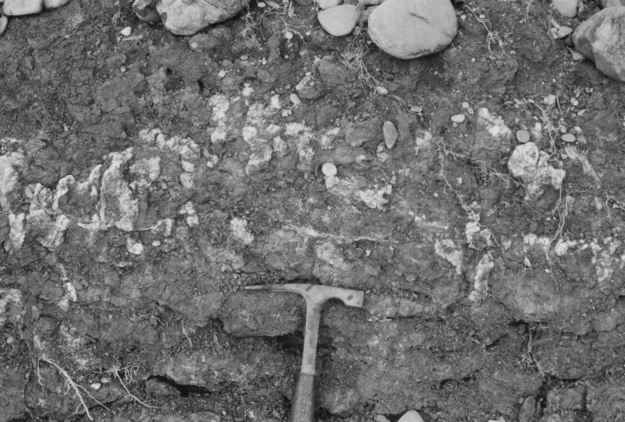
Example of a calcimorphic palaeosol (calcrete), showing scattered, subvertical carbonate glaebules (white). Becklees Sandstone Formation, River Esk [3930 7626]. Hammer head is 0.2 m in length. For a colour version of this figure see online Appendix at http://journals.cambridge.org/geo.
The Becklees Sandstone Formation also comprises a high proportion of sandstone, and deposition in alluvial channel systems is again indicated. Too few palaeocurrent measurements were measured at outcrop to be confident of channel trends, although dipmeter data suggest flow towards both the south and the NW (Fig. 19). Detailed analysis was not possible for this formation, although a provenance change is suggested by the change in palaeocurrent data and the reduction in both grain size and lithic clast content.
During the late Carboniferous it is known that there was a change in climate from humid or sub-humid conditions in Bolsovian times to semi-arid conditions by Asturian times. This was brought about by the rain-shadow effect of the continuously rising Variscan mountain chain to the south during the formation of the Pangaean supercontinent (Parrish, Reference Parrish1982; Rowley et al. Reference Rowley, Raymond, Parrish, Lottes, Scotese and Ziegler1985; Besly, Reference Besly1987). This led to the development of a monsoonal circulation pattern with a marked seasonality to the climate (Parrish, Reference Parrish1982; Rowley et al. Reference Rowley, Raymond, Parrish, Lottes, Scotese and Ziegler1985). The presence of more evolved, red palaeosols and reddening in general in the Warwickshire Group succession of Canonbie is indicative of a gradual change to a more arid climate. The Warwickshire Group also shows good evidence for significant variability in sediment flux, with large volumes of coarse sediment being supplied into the basin at times, with channels suggested to be flowing to the north. It is thought likely that the abrupt increase in grain size is linked to these Variscan tectonic effects in the south, leading to major rejuvenation of the source area, although the cannibalism of earlier metasedimentary terrains probably also occurred.
6. Comparisons with other UK areas
In addition to the extensive developments in the English Midlands and the southern North Sea, several other areas in northern England and Scotland also preserve strata broadly equivalent to those present at Canonbie.
6.a. Southern Scotland and Northern England
6.a.1. Southern Scotland
In southern Scotland, thick successions of late Carboniferous strata, that is, above the Aegiranum Marine Band, are locally known from the Sanquhar, SW Ayrshire, Lanarkshire (along the Central Coalfield Syncline), Thornhill, Douglas and East Fife areas (Mykura, Reference Mykura1967; Davies, Reference Davies1970; McMillan & Brand, Reference McMillan and Brand1995; Forsyth, Hall & McMillan, Reference Forsyth, Hall and McMillan1996) (Fig. 1). Most authors document the presence of red-beds in these areas but typically their descriptions also include coals, siderite nodules, numerous rooted horizons, as well as coal replaced by limestone, indicating that later secondary reddening was an important process in their formation. Drilled approximately 6 km SSE of Glasgow, the BGS Hallside Borehole [NS 6694 5975] contains a few hundred metres of Scottish Upper Coal Measures Formation strata, comprising interbedded red sandstone, mottled mudstone and micaceous siltstone, with some purple and red palaeosols and rare coals replaced by limestone. Interestingly, desiccation cracks have been locally recorded in the core, indicating the start of better-drained conditions.
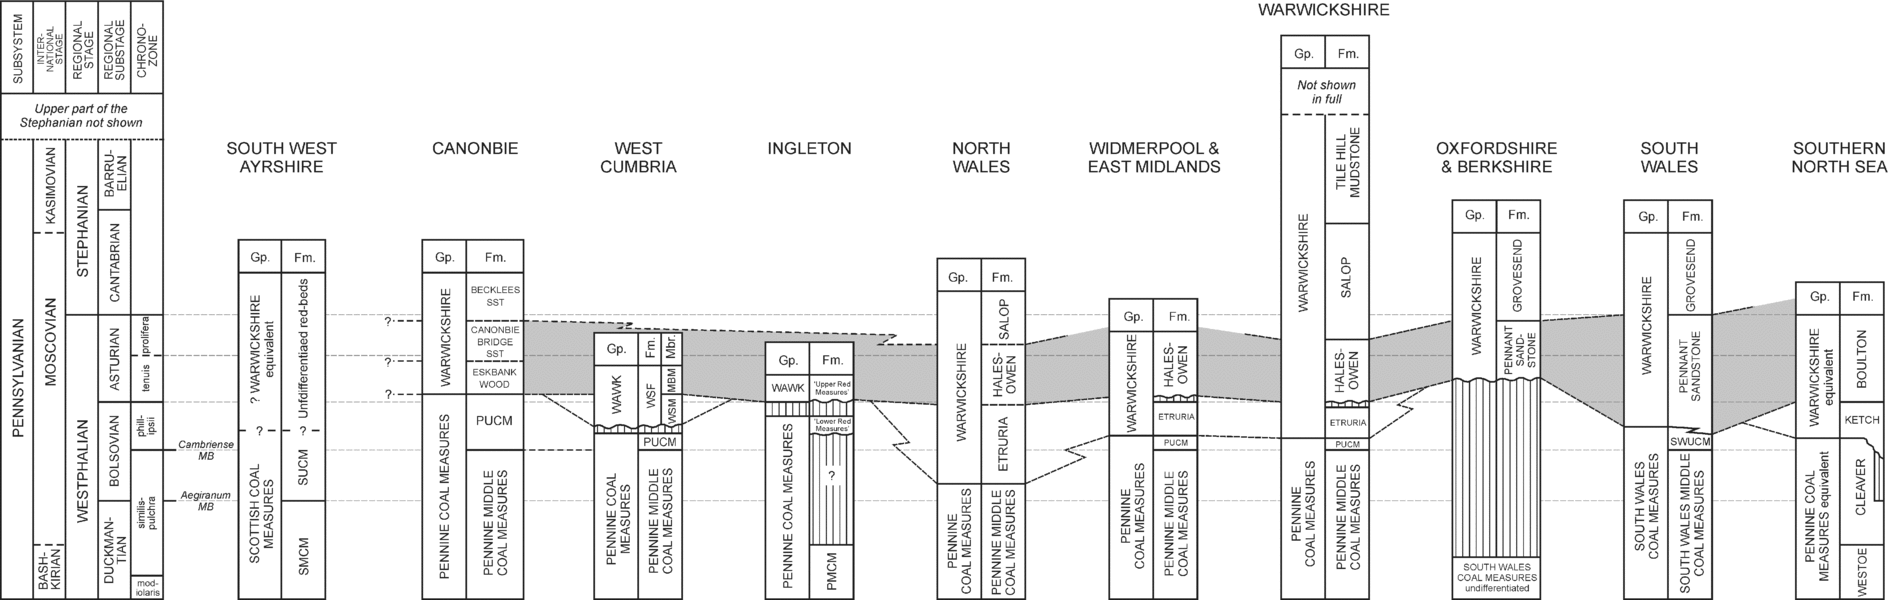
The most compelling evidence for the presence of Warwickshire Group strata comes from SW Ayrshire, where plant fossils have been suggested to be either Asturian or even Stephanian in age (Wagner, Reference Wagner1966). Mykura (Reference Mykura1967) recorded up to 450 m of strata above the Aegiranum Marine Band in boreholes in this area. Of these, the uppermost ~ 120 m of strata are predominantly red-beds, and include Spirorbis limestones, desiccation-cracked mudstones, mud-clast breccias and beds with calcareous concretions (Mykura, Reference Mykura1967), which are likely to be calcrete palaeosols. These higher strata invite comparison with the Eskbank Wood Formation at Canonbie (Fig. 22). It would appear that there is no evidence for strata equivalent to the Canonbie Bridge and Becklees Sandstone formations.
Proposed chronostratigraphical correlation of the Warwickshire Group from the Canonbie area with other areas mentioned in the text. The stratigraphy presented here is taken from a compilation of data presented in Powell et al. (Reference Powell, Chisholm, Bridge, Rees, Glover and Besly2000) and Waters et al. (Reference Waters, Browne, Dean and Powell2007). Grey area shows the proposed correlation between the Boulton, Pennant Sandstone and Halesowen formations with the Canonbie succession. Fm. – Formation; Gp. – Group; MB – Marine Band; MBF – Millyeat Beds Member; Mbr. – Member; PMCM – Pennine Middle Coal Measures Formation; PUCM – Pennine Upper Coal Measures Formation; SST – sandstone; SMCM – Scottish Middle Coal Measure Formation; SUCM – Scottish Upper Coal Measures Formation; SWUCM – South Wales Upper Coal Measures Formation; WAWK – Warwickshire Group; WSF – Whitehaven Sandstone Formation; WSM – Whitehaven Sandstone Member.
6.a.2. West Cumbria
The West Cumbrian Coalfield lies to the SSW of Canonbie and the two areas are connected in the subsurface via the Solway Syncline beneath Permo-Triassic cover (Chadwick et al. Reference Chadwick, Holliday, Holloway and Hulbert1995) (Figs 1, 3). Akhurst et al. (Reference Akhurst, Chadwick, Holliday, McCormac, McMillan, Millward and Young1997) assigned the youngest Carboniferous strata of west Cumbria, of phillipsii to tenuis Chronozone (late Bolsovian to Asturian) age, to the Whitehaven Sandstone Formation, divisible into the Whitehaven Sandstone and the overlying Millyeat Beds members (Fig. 22).
The Whitehaven Sandstone Member is an approximately 100 m thick succession, largely comprising a reddened, locally coarse-grained to pebbly, quartz-dominant sandstone, deposited by large braided fluvial river systems that flowed from NE to SW (Jones, Reference Jones1993). No calcrete palaeosols are known, although evidence for incipient primary reddening and desiccation cracks occur, suggesting that the member could be included in the Warwickshire Group. This agrees with the recent work of Waters et al. (Reference Waters, Browne, Dean and Powell2007). The Whitehaven Sandstone Member lacks the large quantities of lithic grains seen in the Canonbie Bridge Sandstone Formation and hence there would appear to be no direct lithological correlatives of this member at Canonbie (Fig. 22).
The overlying Millyeat Beds Member contains a greater proportion of mudstones than in the underlying member, comprising an alternating grey and red-bed succession of mudstone, less common sandstone, thin coals, locally present gley palaeosols that show some incipient reddening, and Spirorbis-bearing limestones (Brockbank, Reference Brockbank1891; Kendall, Reference Kendall1896). These characteristics are similar to the facies described from the Eskbank Wood Formation of Canonbie. If this is the case, this suggests that Warwickshire Group sedimentation, represented by the Whitehaven Sandstone Member, began earlier in West Cumbria than Canonbie (Fig. 22). It is notable that there appear to be no preserved equivalents of the higher Canonbie Bridge Sandstone and Becklees Sandstone formations preserved in west Cumbria.
Other nearby coalfields, such as at Midgeholme and Stainmore, can be excluded from this discussion because only strata up to the lowermost Duckmantian are preserved (Ramsbottom et al. Reference Ramsbottom, Calver, Eager, Hodson, Holliday, Stubblefield and Wilson1978; Stone et al. Reference Stone, Millward, Young, Merritt, Clarke, McCormac and Lawrence2010). The Northumberland–Durham Coalfield preserves a sequence of Bolsovian rocks, up to 300 m thick, locally with Pennine Upper Coal Measures Formation strata, for example, in the Boldon Syncline (Smith, Reference Smith1994), but no primary red-beds are known there.
6.a.3. Ingleton
The Ingleton Coalfield forms an isolated area of Upper Carboniferous rocks preserved in a syncline at the northern margin of the Craven Basin (Fig. 1). Upper Carboniferous strata are generally not well exposed due locally to unconformable Permian cover and, more generally, an extensive blanket of Quaternary deposits. Ford (Reference Ford1954) provided the only modern account of the succession and recognized a lower grey, coal-bearing unit (Pennine Lower and Middle Coal Measures formations) and an upper dominantly red-bed succession, about 580 m thick, believed to be separated by a pronounced unconformity (Ford, Reference Ford1954; Ramsbottom et al. Reference Ramsbottom, Calver, Eager, Hodson, Holliday, Stubblefield and Wilson1978) (Fig. 22).
The ‘Red Measures’ above this unconformity have been divided into lower and upper units, with the ‘Lower Red Measures’ comprising up to 275 m of strata in the Holden House Borehole [SD 6579 7397]. These strata typically consist of red conglomerate and sandstone, mudstone, locally variegated and mottled, calcareous mudstone, ‘seatearth’ palaeosols and thin coals, and contain a bivalve fauna indicating the basal part of the phillipsii Chronozone (upper Bolsovian age).
The overlying ‘Upper Red Measures’, about 240 m thick, were separated from the ‘Lower’ red-beds by a series of faults (Ford, Reference Ford1954). The succession was described as generally redder, dominantly comprising sandstone, but also including several beds of breccia, rooted horizons, ‘seatearth’ palaeosols and three thin limestone beds (Ford, Reference Ford1954). The non-marine bivalve fauna indicates a late Bolsovian, or even possibly early Asturian age.
The descriptions of the ‘Lower Red Measures’ suggest that they largely comprise secondarily reddened Upper Carboniferous strata. The coarseness of the succession invites comparison with the similarly aged Whitehaven Sandstone Formation of West Cumbria and thus it may belong to the lowermost part of the Warwickshire Group, although this is extremely speculative. The ‘Upper Red Measures’ are tentatively, though more certainly, assigned to the Warwickshire Group and may be equivalent to the Eskbank Wood Formation of Canonbie (Fig. 22).
6.b. English Midlands, southern England and South Wales
The English Midlands saw the diachronous spread of red-beds northwards during the late Duckmantian onwards (Besly, Reference Besly and Glennie1998; Powell et al. Reference Powell, Chisholm, Bridge, Rees, Glover and Besly2000). The earliest unit within the Warwickshire Group, the Etruria Formation, comprises a mottled red mudstone-dominated succession with subordinate lenticular coarse sandstones (‘espleys’), with volcanic and lithic clasts in places (B. M. Besly, unpub. Ph.D. thesis, Keele Univ. 1983; Glover, Powell & Waters, Reference Glover, Powell and Waters1993; Powell et al. Reference Powell, Chisholm, Bridge, Rees, Glover and Besly2000). The formation is up to 300 m thick and is known from central and northern England, North Wales and Lancashire (Powell et al. Reference Powell, Chisholm, Bridge, Rees, Glover and Besly2000). It typically lacks calcrete palaeosols, although well-drained palaeosols such as brunified alluvial and ferruginous palaeosols have been described, as well as post-depositionally oxidized and hydromorphic gleys (B. M. Besly, unpub. Ph.D. thesis, Keele Univ. 1983; Besly & Fielding, Reference Besly and Fielding1989; Besly & Cleal, Reference Besly and Cleal1997).
The Halesowen Formation overlies the Etruria Formation and typically comprises grey-green or red micaceous sandstones (litharenite) and mudstone with thin coals, beds of Spirorbis limestone and calcrete (Powell et al. Reference Powell, Chisholm, Bridge, Rees, Glover and Besly2000). Glover & Powell (Reference Glover and Powell1996) and Besly & Cleal (Reference Besly and Cleal1997) described sandstones from the Halesowen Formation as metasediment-dominated litharenites (Association B of Besly & Cleal, Reference Besly and Cleal1997). These sandstones contain up to 60 % low-grade metasedimentary grains, mainly foliated psammites and pelites rich in muscovite, chlorite and biotite; this gives fresh sandstones a distinctive green colour (Glover & Powell, Reference Glover and Powell1996). The Halesowen Formation sandstones also contain abundant garnet, and a source rich in chrome spinel and chloritoid is suggested (Hallsworth, Reference Hallsworth1992). This metasedimentary detritus is thought to be largely recycled, derived from the Rheno-Hercynian Zone of the Variscan Orogenic belt (Besly & Cleal, Reference Besly and Cleal1997; Besly, Reference Besly and Glennie1998).
Warwickshire Group strata are also known to extend between the South Wales, Forest of Dean, Bristol, Oxfordshire, Berkshire and Kent coalfields (Kelling, Reference Kelling and Owen1974; Besly, Reference Besly, Besly and Kelling1988; Shephard-Thorn, Reference Shephard-Thorn1988; Foster et al. Reference Foster, Holliday, Jones, Owens and Welsh1989; Sherlock, Jones & Jones, Reference Sherlock, Jones and Jones2000; Waters et al. Reference Waters, Browne, Dean and Powell2007) (Fig. 1). Here they predominantly comprise grey, coal-bearing successions with thick lithic (‘Pennant’ type) sandstones. The sandstones are typically coarse-grained, locally conglomeratic and comprise feldspathic and micaceous lithic arenites with some recycled Upper Palaeozoic sedimentary and volcanic clasts (Kelling, Reference Kelling and Owen1974). Locally, red-beds are also known; these become more common upwards through the group (Waters et al. Reference Waters, Browne, Dean and Powell2007). The petrological similarities between the Halesowen Formation of the Midlands and the Pennant Sandstone Formation of South Wales suggests a similar derivation, and braidplain systems sourced from the Hercynian mountains to the south have been proposed (Besly, Reference Besly, Besly and Kelling1988; Kelling & Collinson, Reference Kelling, Collinson, Duff and Smith1992; Jones & Hartley, Reference Jones, Hartley, North and Prosser1993; Sherlock, Jones & Jones, Reference Sherlock, Jones and Jones2000).
Spanning the interval between the late Asturian and early Stephanian is the Salop Formation (Powell et al. Reference Powell, Chisholm, Bridge, Rees, Glover and Besly2000). This comprises an interbedded succession of red and red-brown mudstones and sandstones, some pebbly, with thin Spirorbis limestone and calcrete palaeosols in the lower part (Powell et al. Reference Powell, Chisholm, Bridge, Rees, Glover and Besly2000). Sandstones are mostly sublitharenite (Association C of Besly & Cleal, Reference Besly and Cleal1997), largely comprising monocrystalline and polycrystalline quartz and minor potassium feldspar. These sandstones also typically contain detrital carbonate grains, formed either through reworking of calcrete or representing detritally reworked Carboniferous Limestone grains (Glover & Powell, Reference Glover and Powell1996; Besly & Cleal, Reference Besly and Cleal1997). According to Besly & Cleal (Reference Besly and Cleal1997), sandstones of the Salop Formation (Association C) are identifiable in the field by their distinctive orange-brown colour. The Salop Formation consists of recycled Carboniferous and perhaps Devonian lithic material and also contains calcrete palaeosols.
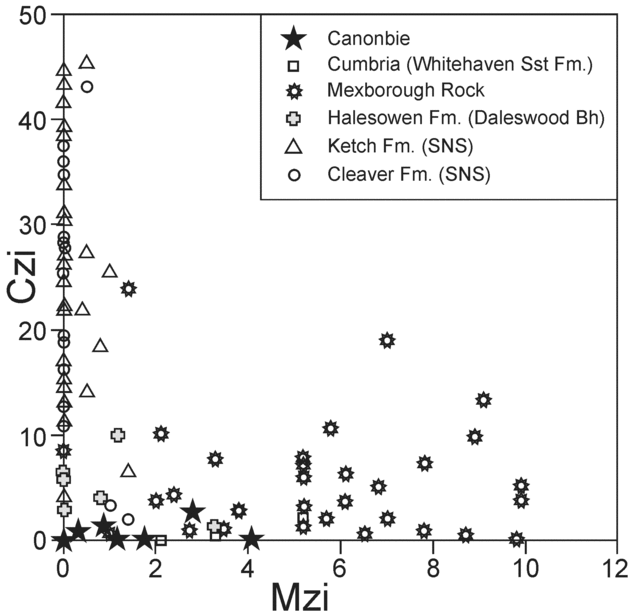
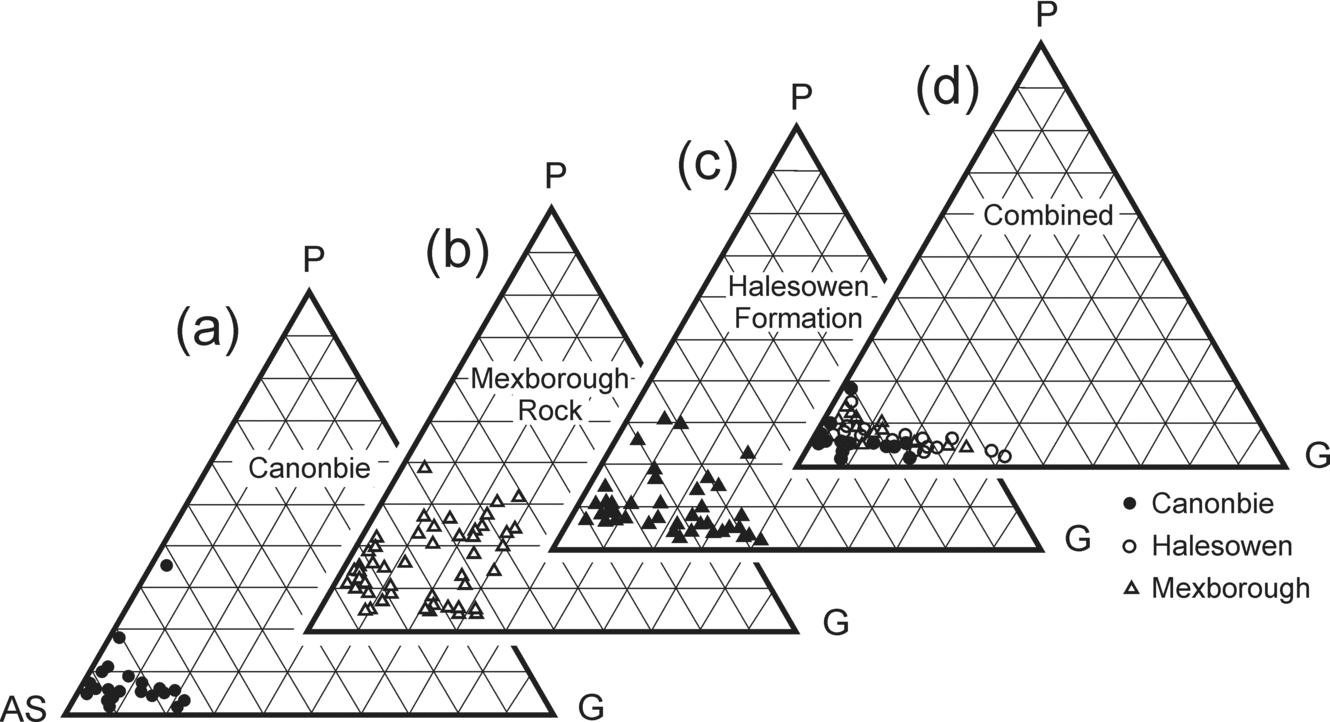
It is difficult to be confident of any correlation of Upper Carboniferous rocks between Canonbie and the English Midlands, due to the limits of the faunal and floral control, the large distances involved and the likelihood of lateral facies changes. Although both dominantly comprise mudstone-rich successions, the Eskbank Wood Formation is younger than the Etruria Formation. If they are equivalent this would indicate a strong element of diachroneity; hence it would appear that there is no equivalent to the Eskbank Wood Formation in the Midlands. The Halesowen Formation is of much the same age as both the Eskbank Wood and the Canonbie Bridge Sandstone formations and has a similar litharenitic composition to the latter. Heavy mineral data from the rocks at Canonbie are more restricted in their compositional variations and, in general, are characterized by lower Monazite–Zircon, Chrome-spinel–Zircon and Rutile–Zircon compositions than the rocks from the Pennine Basin (Table 3; Figs 23, 24). When the data are compared to samples from the Mexborough suite (late Duckmantian to Bolsovian) and the Halesowen Formation (Asturian), the Canonbie rocks show more similarity to the Halesowen Formation; the Mexborough suite is more heterogeneous and is characterized by a much larger range of Monazite–Zircon, Chrome-spinel–Zircon (Fig. 24) and Rutile–Zircon values (Hallsworth & Chisholm, Reference Hallsworth and Chisholm2000). Overall, the heavy minerals suggest that the rocks from Canonbie may contain material derived from the Variscan orogenic belt, but the data do not exclude contributions from other sources. The garnet compositions from the Canonbie Bridge Sandstone Formation also show some similarities to those measured from the Halesowen Formation (Hallsworth et al. Reference Hallsworth, Morton, Claoué-Long and Fanning2000), but are more restricted in their compositional range (Fig. 25). However, recent zircon age dating from a sample (NJN100) from the Canonbie Bridge Sandstone Formation shows unequivocally that a significant proportion of the sediment was derived from the Variscides of western or central Europe, supporting the proposed correlation with the Halesowen Formation and the Pennant Sandstone Formation (Morton, Fanning & Jones, Reference Morton, Fanning and Jones2010). It also means that the idea of a local, contemporaneous source for the Canonbie red-beds, proposed by Chadwick et al. (Reference Chadwick, Holliday, Holloway and Hulbert1995), can be discounted.
Heavy mineral cross-plots for (a) Apatite–Tourmaline with Rutile–Tourmaline (ATi–RuTi), (b) Chrome-spinel–Zircon with Monazite–Zircon (CZi–MZi) and (c) Garnet–Zircon with Monazite–Zircon (GZi–MZi) for the Warwickshire Group from the Canonbie area. Data were obtained from samples NJN98 and 99 (Becklees Sandstone) and NJN100, 101 and 102 (Canonbie Bridge Sandstone). There is considerable variation in the ATi values (11–78), reflecting variable amount of apatite dissolution during sediment transport and storage. The rocks of the Canonbie Bridge Sandstone have higher ATi (62–78) than the Beckless Sandstone (42–45). All other indices GZi, MZi and CZi are low (0–7) with the Canonbie Bridge Sandstone characterized by slightly higher MZi, but similar CZi and GZi, in comparison to the Beckless Sandstone.

Cross-plot of Chrome-spinel–Zircon with Monazite–Zircon (CZi–MZi) to compare the data from Canonbie with other examples of Westphalian sandstones from the onshore and offshore UK (data derived from Hallsworth, Reference Hallsworth1992; Hallsworth, pers. comm. 2001; Hallsworth & Chisholm, Reference Hallsworth and Chisholm2000; Hallsworth et al. Reference Hallsworth, Morton, Claoué-Long and Fanning2000; Morton, Hallsworth & Moscariello, Reference Morton, Hallsworth, Moscariello, Collinson, Evans, Holliday and Jones2005). The Canonbie data are distinct from the southern North Sea Ketch and Cleaver formations (which generally have high CZi, low MZi values) and the onshore Mexborough suite (which is characterized by a much larger range of MZi and CZi), suggesting that the Canonbie rocks are not derived from the same source. There would appear to be some similarity between the Canonbie rocks and the Halesowen Formation (Daleswood Borehole). Bh – Borehole; CZi – Chrome-spinel–Zircon; Fm. – Formation; MZi – Monazite–Zircon; sst – Sandstone; SNS – southern North Sea.
Garnet compositions expressed in terms of the relative abundances of almandine plus spessartine (AS), pyrope (P) and grossular (G) end-members for (a) the Canonbie Bridge Sandstone Formation, (b) Mexborough Rock (data from Hallsworth & Chisholm Reference Hallsworth and Chisholm2000), (c) Halesowen Formation (data from Hallsworth et al. Reference Hallsworth, Morton, Claoué-Long and Fanning2000) and (d) combined plot where only samples with greater than 5 % spessartine are shown to distinguish garnet populations with relatively high spessartine from those which are almandine-rich. The Canonbie Bridge Sandstone Formation is predominantly characterized by high almandine+spessartine compositions with low grossular and minor pyrope. There is one anomalous garnet with considerably higher pyrope, suggesting that there is some heterogeneity in the garnet population. The garnet compositions compare favourably with those published for the Mexborough Rock and Halesowen Formation. (a) Canonbie: 22 samples from NJN101 & CAN1; (b) Mexborough Rock: 50 samples Eh14773 (Dalton Rock); (c) Halesowen Formation: 50 samples from the Daleswood Farm Borehole, at 216 m downhole depth, and (d) Canonbie (> 5 % spessartine = 21 out of 22), Halesowen (> 5 % spessartine = 23 out of 50), Mexborough (> 5 % spessartine = 16 out of 50). CAN1, Eh14773 and NJN101 are samples registered at the British Geological Survey.
The overlying Salop Formation also appears to have some features in common with the Becklees Sandstone Formation, particularly its distinctive orange-brown colour and lower proportion of lithic material. However, the Salop Formation clearly has some locally reworked material (Carboniferous Limestone grains), which is not seen in the restricted exposures of the Becklees Sandstone Formation. These correlations are extremely tentative and more work would be needed on the petrography and provenance indicators of the Canonbie succession in order to confirm any relationship.
The Upper Stephanian to Autunian successions of the Midlands are not likely to be correlatives of the Canonbie succession because they are typically quite restricted in their geographical distribution and have local source areas. For example, the Clent Formation contains a distinctive suite of clasts derived largely from Uriconian (Precambrian) rocks of the Welsh Borderlands, and the Kenilworth Sandstone Formation is a distinctive unit formed from Precambrian and Lower Palaeozoic rocks of the Lickey Ridge (Glover & Powell, Reference Glover and Powell1996; Powell et al. Reference Powell, Chisholm, Bridge, Rees, Glover and Besly2000).
6.c. Southern North Sea
Successions chronostratigraphically equivalent to Canonbie are present offshore in the southern North Sea. The Bolsovian-aged Cleaver Formation is a grey-bed succession, suggested to have been derived from a combination of detritus sourced from the Rinkøbing Fyn High to the northeast and from the Variscan orogenic belt (Saxo-Thuringian Zone) to the south (Morton, Hallsworth & Moscariello, Reference Morton, Hallsworth, Moscariello, Collinson, Evans, Holliday and Jones2005). The overlying red-bed facies of the Boulton Formation range from Bolsovian to Asturian in age and form the topmost Westphalian unit present in the UK sector of the southern North Sea (Moscariello, Reference Moscariello, Gluyas and Hichins2003; Besly, Reference Besly, Collinson, Evans, Holliday and Jones2005).
The Ketch Formation largely comprises fluvial single and multi-storey braided channel deposits, with rooted overbank deposits and ferruginous palaeosols (Besly, Burley & Turner, Reference Besly, Burley, Turner and Parker1993). Although the base of the Ketch Formation is defined as the lowest occurrence of primary red-bed facies (Cameron, Reference Cameron, Knox and Cordey1993, p. 22), an angular unconformity is present at the base of the formation in condensed sections near sub-basin margins, for example, in blocks 44/13 and 44/14 (Besly, Reference Besly and Glennie1998; Moscariello, Reference Moscariello, Gluyas and Hichins2003; Jones, Allen & Morrison, Reference Jones, Allen, Morrison, Collinson, Evans, Holliday and Jones2005). Further south, in blocks 44/26 to 44/28, the Cambriense Marine Band is present and a thick coal-bearing section occurs above it (B. Besly, pers. comm. 2009).
Initially it was proposed that the ‘Barren Red Measures’ in the southern North Sea represented the diachronous spread of well-drained alluvium locally sourced from adjacent developing growth anticlines (e.g. Murdoch and Ravenspurn anticlines), which formed as a result of late Carboniferous regional compressional tectonics (Leeder & Hardman, Reference Leeder, Hardman, Hardman and Brooks1990). Besly, Burley & Turner (Reference Besly, Burley, Turner and Parker1993) suggested that the Ketch Formation formed contemporaneously with the evolving Variscan foreland basin, with sediment derived as a result of Variscan uplift. More recent work on the heavy mineral assemblages suggests that the Ketch Formation comprises a single source area draining two distinct lithologies, one from an ultramafic source and the other from Al-poor metasedimentary rocks; the Rinkøbing Fyn High is favoured as the likely source area (Morton, Hallsworth & Moscariello, Reference Morton, Hallsworth, Moscariello, Collinson, Evans, Holliday and Jones2005).
The Asturian Boulton Formation comprises finer-grained channel facies, as well as non-marine limestones, calcrete palaeosols and some grey, coal-bearing facies (Besly, Reference Besly and Glennie1998, Reference Besly, Collinson, Evans, Holliday and Jones2005). The formation is less feldspathic and richer in metamorphic lithic material than the Ketch Formation and a Variscan source is suggested for this unit (Besly, Reference Besly and Glennie1998; Morton, Hallsworth & Moscariello, Reference Morton, Hallsworth, Moscariello, Collinson, Evans, Holliday and Jones2005). Jones, Allen & Morrison (Reference Jones, Allen, Morrison, Collinson, Evans, Holliday and Jones2005, p. 186) also described the presence of low-grade metasedimentary rock fragments in sandstones of the Boulton Formation, which they believed are indicative of a southerly derivation.
In terms of relating the onshore Canonbie succession with that of the southern North Sea, Besly (Reference Besly and Glennie1998, p. 123) has suggested that the Ketch Formation is equivalent to that of the Canonbie succession. The Eskbank Wood Formation is lithologically similar to the Ketch Formation, but is younger (Fig. 22). Besly (Reference Besly and Glennie1998) has also suggested that the lithic-rich Boulton Formation is equivalent to the Halesowen Formation. Chronostratigraphically it would appear to be equivalent to both the Eskbank Wood and Canonbie Bridge Sandstone formations, and lithologically it has much in common with both the onshore Halesowen and Canonbie Bridge Sandstone formations. Unfortunately, the heavy mineral character of the Boulton Formation is currently unknown. If it is comparable with the onshore Halesowen and Canonbie Bridge Sandstone formations then there would appear to be no equivalent to the overlying Salop and Becklees Sandstone formations in the currently available well penetrations in the UK sector of the southern North Sea due to sub-Permian erosion. The probable equivalents of these sections may be present in the youngest Carboniferous penetrated in the Dutch sector of the southern North Sea (the Step Graben Formation, e.g. in wells K07–08 (van Adrichem Boogaert & Kouwe, Reference Van Adrichem Boogaert and Kouwe1995) and F10–02).
7. Conclusions
Our understanding of the youngest Carboniferous rocks (Bolsovian–Asturian) in the UK is hampered by their limited preservation and the common reddening of the strata. One such Upper Carboniferous succession is present at outcrop and in boreholes around the Canonbie area of SW Scotland and adjacent parts of northern England, preserved within the NNE-trending Solway Syncline. This is one of the few areas in the UK outside of the English Midlands where such strata can be directly examined at outcrop and hence it is an important scientific site. Early workers placed these reddened Upper Carboniferous strata at Canonbie into the Upper Coal Measures and were uncertain as to their origin. From the work presented here, it is clear that these strata can be assigned to the Warwickshire Group on the basis that red-bed facies occur which show evidence for early oxidation (primary reddening) of the strata. At outcrop, about 290 m of the Warwickshire Group are almost continuously exposed along the banks of the River Esk. In the subsurface, up to about 530 m of the group is known from the Becklees Borehole, and seismic reflection data indicate it could be up to about 700 m thick in the centre of the Solway Syncline.
Three informal formations have been recognized within the Warwickshire Group: from base upwards, the Eskbank Wood, Canonbie Bridge Sandstone and Becklees Sandstone formations. These three formations have distinctive well-log signatures and hence are readily correlatable in the subsurface around Canonbie. The base of the group is diachronous, marked by the repeated alternations of grey and primary red-bed strata. Initially (Eskbank Wood Formation), sedimentation was dominated by muddy facies, with lacustrine mudstones dominant, but with common development of palaeosols, including calcretes, and thin beds of Spirorbis limestone. The overlying Canonbie Bridge Sandstone Formation marks the incoming of thick units of medium- and coarse-grained cross-bedded channel sandstones. These represent large, braided-river systems flowing northwards across a well-drained alluvial plain. A noticeable feature of these sandstones is their greenish grey colouration, which can be related to the presence of abundant lithic grains. Overbank and floodplain fines were commonly deposited lateral to channels and soils were able to form during intervals of low sediment aggradation.
The Becklees Sandstone Formation is the youngest unit recognized from the Warwickshire Group of Canonbie, overlain unconformably by Permian strata. Its full thickness is not known, but up to 200 m is proved in the Becklees Borehole. This sandstone is finer-grained, has a distinct orange-brown colour and contains a significantly lower proportion of lithic components.
Comparisons with other areas suggest that these are the lateral equivalents of some of the formations recognized elsewhere in Scotland, the English Midlands and in the southern North Sea. The published descriptions of the red-beds in Ayrshire are similar to those of the Eskbank Wood Formation. The Eskbank Wood Formation has some lithological similarities to the Etruria and Cleaver formations, although it is much younger and hence it would appear that there is no equivalent to the Eskbank Wood Formation in the Midlands and southern North Sea.
Metasediment-dominated litharenites from the Halesowen Formation of the English Midlands and the Pennant Sandstone Formation of South Wales appear to be similar to those of the Canonbie Bridge Sandstone. This is largely thought to have been derived from the Variscan orogenic belt. Heavy mineral data, garnet geochemistry and zircon age dating supports this conclusion. Offshore, the Boulton Formation also contains lithic-rich sandstones that are believed to be Variscan sourced, and hence this formation could also be equivalent to the Canonbie Bridge Sandstone.
Finally, the Becklees Sandstone has much in common with the Salop Formation of the English Midlands, particularly in terms of its distinctive orange-brown colour and lower proportion of lithic material. It would appear that there is no equivalent in the UK sector of the southern North Sea, although candidates exist in the Dutch sector.
Further work is needed to confirm these conclusions and there is still much to learn about the provenance of these units. However, it is clear that southerly-derived Variscan detritus was able to travel considerable distances across the southern North Sea, UK and adjacent areas, to a position a few hundred kilometres north of what has previously been recognized. Thus, despite their somewhat limited present extent, the Canonbie Warwickshire Group strata are probably representative of the sedimentary facies laid down over all or much of northern England and its environs towards the end of the Carboniferous and are indicative of the palaeogeographical conditions prevalent there at that time. Their absence elsewhere in this area is a measure of the extent and depth of erosion beneath the sub-Permian unconformity and suggests that this is of greater magnitude than commonly assumed. This conclusion has major implications for studies attempting to model burial history and the timing of generation of hydrocarbons and mineralizing fluids from Carboniferous strata in and around northern England.
Acknowledgements
Dave Millward and Andrew McMillan from the BGS Edinburgh Office are thanked for supporting this work and they, together with Colin Waters, provided helpful comments on an early draft. Sam Holloway kindly supplied the interpretation of seismic line ED-86–02, the use of which was originally granted by Enterprise Oil. Much of the heavy mineral data were derived from reports that Claire Hallsworth compiled for BGS, the use of which is gratefully acknowledged. We also would like to express our gratitude to Andy Morton for obtaining zircon age dates to test our Variscan provenance hypothesis. Bernard Besly and an anonymous reviewer are thanked for their helpful and constructive reviews of the manuscript. The authors publish with the permission of the Executive Director, BGS (NERC).



