


Mental health is traditionally identified as the absence of psychological disorders (Westerhof & Keyes, Reference Westerhof and Keyes2010), and psychopathology and wellbeing are considered as two opposite poles of a single mental health continuum (Greenspoon & Saklofske, Reference Greenspoon and Saklofske2001; Renshaw & Cohen, Reference Renshaw and Cohen2014). In contrast to this unidimensional perspective, complete mental health is conceptualised as consisting of the absence of psychological symptoms with the presence of positive indicators of the mental health, including subjective wellbeing and/or positive psychological traits (Moore et al., Reference Moore, Widales-Benitez, Carnazzo, Kim, Moffa and Dowdy2015; Renshaw & Arslan, Reference Renshaw and Arslan2018; Suido & Shaffer, Reference Suldo and Shaffer2008). Previous studies have provided evidence indicating that complete mental health has additive value in predicting individuals’ school outcomes, physical health, and social functioning (Arslan, Reference Arslan2018a; Renshaw & Arslan, Reference Renshaw and Arslan2018; Renshaw & Cohen, Reference Renshaw and Cohen2014; Suido & Shaffer, Reference Suldo and Shaffer2008; Suldo, Thalji, & Ferron, Reference Suldo, Thalji and Ferron2011). Integrating both positive and negative mental health indicators has important implications for the early identification of emotional challenges and to support prevention and intervention strategies that promote positive youth development (DiStefano & Kamphaus, Reference DiStefano and Kamphaus2006). The purpose of the present study is to investigate the relationships among positive psychological traits, school functioning, and psychological adjustment of elementary schoolchildren.
Positive psychological traits, school functioning, and psychological adjustment
Positive psychological traits are identified as the positive dimension of complete mental health and have received increasing attention from both researchers and practitioners (Renshaw et al., Reference Renshaw, Furlong, Dowdy, Rebelez, Smith, O’Malley, Strom, Furlong, Gilman and Huebner2014). Previously, there was no single term to describe the co-occurrence of an individual’s positive psychological traits (Jones, You, & Furlong, Reference Jones, You and Furlong2013). During the past decade, a new construct has been used to describe the co-occurrence of youths’ positive traits (e.g., gratitude, optimism, persistence, and zest; Furlong, You, Renshaw, O’Malley, & Rebelez, Reference Furlong, You, Renshaw, O’Malley and Rebelez2013). The interactive and combined effect of these positive psychological constructs has been identified as covitality (Furlong et al., Reference Furlong, You, Renshaw, O’Malley and Rebelez2013; Weiss, King, & Enns, Reference Weiss, King and Enns2002). Weiss and Luciano (Reference Weiss, Luciano and Weiss2015) have emphasised the crucial role of covitality in understanding the nature of positive psychological strengths. According to social-emotional health model, covitality is the ‘synergistic effect of positive mental health resulting from the interplay among multiple positive-psychological building blocks’ (Furlong, You, Renshaw, Smith, & O’Malley, Reference Furlong, You, Renshaw, Smith and O’Malley2014, p. 1013). Covitality is a higher order latent construct that describes the interplay of multiple co-occurring positive psychological indicators of mental health (Renshaw et al., Reference Renshaw, Furlong, Dowdy, Rebelez, Smith, O’Malley, Strom, Furlong, Gilman and Huebner2014).
Covitality construct is grounded in the resilience and positive youth development literature (Furlong et al., Reference Furlong, Dowdy, Carnazzo, Bovery and Kim2014; Lenzi, Dougherty, Furlong, Dowdy, & Sharkey, Reference Lenzi, Dougherty, Furlong, Sharkey and Dowdy2015). Research has historically focused on youth mental health within an independent asset approach and investigated the effects of the individual factor on youth quality-of-life outcomes. Fewer studies have employed the cumulative-factor framework, wherein a meta-construct (e.g., covitality) was formed using positive mental health indicators (Furlong, Dowdy, Carnazzo, Bovery, & Kim, Reference Furlong, Dowdy, Carnazzo, Bovery and Kim2014; Lenzi et al., Reference Lenzi, Dougherty, Furlong, Sharkey and Dowdy2015). The cumulative-factor approach has proposed that cumulative assets have better predictive effects on youth quality-of-life outcomes than isolated protective factors (Lenzi et al., Reference Lenzi, Dougherty, Furlong, Sharkey and Dowdy2015; Ostazewski & Zimmerman, Reference Ostaszewski and Zimmerman2006). Given this framework, the combination of positive psychological traits is more beneficial for youth educational, social, emotional and behavioural functioning compared with individual positive traits (Lenzi et al., Reference Lenzi, Dougherty, Furlong, Sharkey and Dowdy2015).
Covitality has been documented to be closely associated with a variety of valued outcomes, including problem behaviours, internalising symptoms, internet-related problems, and school problems in elementary schoolchildren to university students (Arslan & Renshaw, Reference Arslan and Renshaw2018; Boman, Mergler, & Pennell, Reference Boman, Mergler and Pennell2017; Jones et al., Reference Jones, You and Furlong2013; Kaplan, Reference Kaplan2017; Lee, You, & Furlong, Reference Lee, You and Furlong2016; Marino, Hirst, Murray, Vieno, & Spada, Reference Marino, Hirst, Murray, Vieno and Spada2017; Renshaw & Arslan, Reference Renshaw and Arslan2016). In addition, the construct has been positively associated with subjective wellbeing, academic achievement, personal adjustment, and prosocial behaviours (Arslan, Reference Arslan2018a; Jones et al., Reference Jones, You and Furlong2013; Lee et al., Reference Lee, You and Furlong2016; Ito, Smith, You, Shimoda, & Furlong, Reference Ito, Smith, You, Shimoda and Furlong2015). Youths with high covitality are more likely to have better educational and developmental outcomes compared with those who have low covitality (Furlong et al., Reference Furlong, Dowdy, Carnazzo, Bovery and Kim2014; Keyfitz, Lumley, Hennig, & Dozois, Reference Keyfitz, Lumley, Hennig and Dozois2013; Renshaw, Reference Renshaw2017). For example, Wilkins, Boman, and Mergler (Reference Wilkins, Boman and Mergler2015) reported the positive and strong predictive effect of covitality on school engagement and prosocial behaviour among children. Pennell, Boman, and Mergler (Reference Pennell, Boman and Mergler2015) indicated that covitality was a stronger predictor of students’ psychological wellbeing and depression than each positive strength. Covitality was highly predictive of youths’ school functioning, including caring relationships, prosocial behaviour, school rejection, and school acceptance (Furlong et al., Reference Furlong, You, Renshaw, O’Malley and Rebelez2013). Taken together, these outcomes suggest that the combination of youths’ positive psychological constructs has greater predictive power, rather than any trait in isolation.
Current study
Within the context sketched above, the present study investigated the association between positive psychological traits, school functioning, and psychological adjustment of elementary schoolchildren. Although many studies have explored the association between positive psychological traits and quality-of-life outcomes, the potential influences of covitality on youth school functioning and psychological adjustment have remained relatively unexplored, specifically in Turkey. Therefore, outcomes of the study have importance for understanding the effect of positive traits on school functioning and psychological adjustment of elementary schoolchildren. Findings of the study will provide a number of significant theoretical and applied implications for school-based mental health providers and other professions.
Method
Participants
Participants of the present study included 392 children in Grades 6–8 attending a public elementary school in an urban city in Turkey. Students were 48.2% (189) female and 51.8% (203) male and ranged in age from 11 to 14 years (M = 12.83, SD = .94). They reported their socioeconomic status (SES) as follows: low SES = 20.5%, average SES = 33.4%, and high SES = 37.1%. Although all students were invited to participate in the study, informed parental consent and student assent were obtained from only 65% of the students. All measures of the study were combined into a paper-and-pencil survey. Following informing the students about the purpose of the study and measures, the survey was administered to the students who had volunteered to participate in the study during course hours. All participants completed the survey in approximately 35 minutes.
Measures
Social and Emotional Health Survey — Primary (SEHS-P)
The SEHS-P is a 16-item, self-report instrument developed to measure student positive psychological traits at school. The SEHS-P is comprised of four 4-item subscales, including optimism, gratitude, persistence, and zest (e.g., ‘I am lucky to go to my school’, ‘I get really excited about my school projects’, ‘I expect good things to happen at my school’, ‘I finish all my class assignments’), and all items are scored using a 4-point response scale, ranging between 1 = almost never and 4 = very often (Furlong et al., Reference Furlong, You, Renshaw, O’Malley and Rebelez2013). Composite scores of the scale represent youth overall positive psychological functioning at school, namely student covitality (for more information, see Furlong, Dowdy, & Nylund-Gibson, Reference Furlong, Dowdy and Nylund-Gibson2018). Previous research indicated that the scale had an adequate-to-strong internal reliability and concurrent validity with criterion variables (Furlong et al., Reference Furlong, You, Renshaw, O’Malley and Rebelez2013; Renshaw, Reference Renshaw2017). Telef (Reference Telef2016) investigated the psychometric properties of the SEHS-P for Turkish children and reported that the scale had adequate internal reliability and concurrent validity with criterion variables. However, two items had cross-factor loadings with the Turkish sample and were therefore removed (Telef, Reference Telef2016). Given the rationale of the social-emotional model, the present study used the 16-item version of the SEHS-P (translated by Telef, Reference Telef2016), and the psychometric properties of the SEHS-P were investigated using the present sample to enhance the usability of the scale for both research and practice; see the Results section.
Youth Internalising Behaviour Screener (YIBS)
The YIBS was developed as a 10-item screener for measuring internalising behaviour problems in Turkish adolescents and is comprised of two 5-item subscales: anxiety and depression (e.g., ‘I generally feel tense and anxious’, ‘I feel depressed and pessimistic’). All items of the scale are scored using a 4-point Likert-type scale, ranging between (1) almost never and (4) almost always. Findings of the study showed that the scales had strong factor loadings, latent constructs (H) and internal reliability (α) coefficients, and concurrent validity with criterion variables (α range = .75–.90, H range = .84–.92; Arslan, Reference Arslan2018b). For the present sample, the YIBS was a strong internal reliability and was deemed to be relatively normally distributed (see Table 1).
Psychometric Properties of the Study Variables

Youth Externalising Behaviour Screener (YEBS)
Externalising behaviour problems were measured using the YEBS, which is a 12-item, self-report screener developed to measure externalising problems in Turkish children and adolescents. The YEBS consists of three subscales, including conduct problems, hyperactivity, and attention problems (e.g., ‘I often fight with my friends’, ‘I can’t stand sitting still for a long time, I feel disturbed’). All items are rated on a 4-point Likert-type scale, scoring from (1) almost never to (4) almost always. Findings indicated that scales had strong factor loadings, adequate-to-strong latent constructs (H) and internal reliability (α) coefficients, and concurrent validity with criterion variables (α range = .72–.82, H range = .72–.83; Arslan, Reference Arslan2018c). In the present study, the YEBS had an adequate internal reliability and relatively normal distribution (see Table 1).
Self-report academic achievement scale (SAAS)
Student academic achievement was measured using a single item (‘During the past year, how would you describe the grades you received in school?’) selected from the California Healthy Kids Survey (WestEd, 2017). The item was scored using a 5-point grade-range response scale: 5 = very good (within top 20%), 4 = good (top 21–40%), 3 = average (41–60%), 2 = poor (low 21–40%), 1 = very poor (low 1–20%). Higher scores represent higher academic achievement. Previous research has indicated that students’ self-report academic achievement is strongly associated with their school-reported academic achievement (Shaw & Mattern, Reference Shaw and Mattern2009). Finding from the present study showed that the SAAS had relatively normal distribution (see Table 1).
Student prosociality scale (SPS)
The SPS was used to measure prosocial behaviour at school. The scale is a 4-item, self-report instrument developed to assess youth prosocial behaviour within the school setting. The SPS includes four items (e.g., ‘I help other kids who seem to be having a hard time’, ‘I am kind to my friends at school’), scoring via a 4-point Likert-type scale (1 = almost never, to 4 = almost always). Previous research demonstrated that the scale had adequate latent construct and internal reliability coefficients (Renshaw, Reference Renshaw2014). Arslan (Reference Arslan2018d) investigated the psychometric properties for Turkish adolescents, showing that the scale provided good data-model fit, strong factor loadings, adequate internal and latent construct reliability coefficient (α = .79, H = .80). Additionally, the scales had an adequate internal reliability and relatively normal distribution in this study (see Table 1).
School belongingness scale (SES)
The SBS was developed for measuring sense of belonging at school in Turkish adolescents (Arslan & Duru, Reference Arslan and Duru2017). The scale is comprised of 10 items that represent two subdimensions: school acceptance and school exclusion (e.g., ‘I think that I am not involved in most of the activities at school’, ‘I feel that I am accepted by other people at school’). All items are scored using a 4-point response scale (1 = almost never to 4 = almost always). Previous research has demonstrated that the SBS have a structurally reliable and valid measure for assessing school belonging in elementary and high school students (Arslan & Duru, Reference Arslan and Duru2017). In the present study, the internal reliability of SBS was strong, and the scale was deemed to be relatively normally distributed (see Table 1).
Data analyses
Before conducting the primary analyses, observed scale characteristics and correlation analysis were performed. Skewness and kurtosis scores were used to examine the normality assumption. The absolute scores of the kurtosis and skewness lower than |10| and |3| are considered as acceptable for normality (Kline, Reference Kline2005). Pearson correlation analysis was conducted to examine the associations between variables. Following, a pair of latent variable path analysis (LVPA) was performed to investigate the predictive power of the measurement models of the SEHS-P and its subscales on youth psychological adjustment and school functioning identified by internalising and externalising problems, school belonging, academic achievement, and prosocial behaviour. Path analysis outcomes were interpreted using the standardised path coefficients, beta values and squared-multiple correlations (R2 ). Finally, similar to previous research that used the classification approach to categorise the covitality and to compare the effects of groups (Furlong et al., Reference Furlong, You, Renshaw, O’Malley and Rebelez2013), students were divided into two groups using item-response (high group = covitality levels ≥ 48, low group = covitality levels ≤ 47). After these preliminary analyses, an independent-samples t test was conducted to investigate the differential effects of covitality status on student school functioning and psychological adjustment. All the data analyses were conducted using SPSS and AMOS version 22.
Results
Preliminary analyses
Confirmatory factor analysis results demonstrated that the SEHS-P had adequate data model fit (χ2 = 288.445, df = 100, p < .001, TLI = .90, CFI = .92, RMSEA 90% CI = .069 [.60, .79]) and strong factor loadings, ranging between .55 and 84 (see Figure 1). Further outcomes showed that the SEHS-P and its subscales had adequate-to-strong internal (α) and latent construct (H) reliability coefficients (α range = .74–.81, H range = .78–.86). These results provide further evidence suggesting that the SEHS-P could be used to measure student positive psychological traits in elementary schoolchildren.
Second-order measurement model for the SEHS-P.

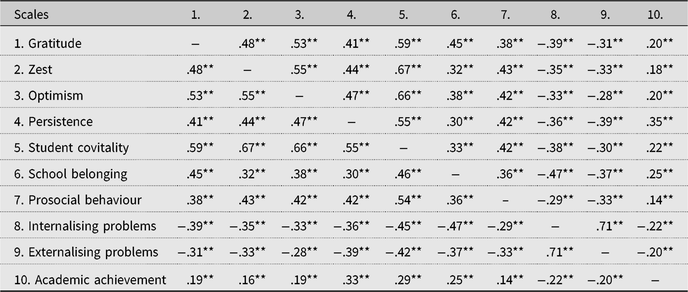
Findings from observed scale characteristics indicated that skewness and kurtosis scores ranged from −2.37 to 6.04, and the scales had relatively normal distribution (Kline, Reference Kline2005). Internal consistency (α) of the scales was between .68 and .89, representing adequate-to-strong internal reliability coefficients (see Table 1). Moreover, correlation analysis outcomes showed a significant and small-to-large association between study variables. Student covitality indicators were positively associated with prosocial behaviour, school belonging, and academic achievement, and negatively correlated with internalising and externalising problems. Likewise, prosocial behaviour, school belonging, and academic achievement were negatively associated with internalising and externalising problems (see Table 2).
Correlations Between Variables

Note: *p < .05. **p < .001.
Primary analyses
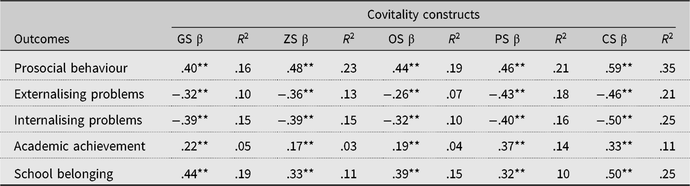
The LVPA was performed to examine the association between student positive psychological traits and youth school functioning and psychological adjustment (i.e., internalising and externalising problems, prosocial behaviour, school belonging, and academic achievement). Findings from these analyses revealed that positive psychological traits were significantly associated with youth school adjustment outcomes, ranging from small-to-large effect size (R 2 range = .03–.23). Specifically, persistence was a strong predictor of the academic achievement (β = .37, p < .001, R 2 = .14), internalising (β = −.40, p < .001, R 2 = .16) and externalising problems (β = −.43, p < .001, R 2 = .18). Gratitude strongly predicted school belonging (β = .44, p < .001, R 2 = .19). Prosocial behaviour was strongly predicted by zest domain (β = .48, p < .001, R 2 = .23). The covitality construct significantly and positively predicted academic achievement (β = .33, p < .001), school belonging (β = .50, p < .001), and prosocial behaviour (β = .59, p < .001). It negatively predicted internalising (β = −.50, p < .001) and externalising problems (β = −.46, p < .001), ranging from moderate-to-large effect size (R 2 range = .11−.35). The covitality construct had stronger associations with youths’ school functioning and psychological adjustment than each domain individually (see Table 3).
Path Coefficients and Multiple Correlations from the Latent Variable Path Analysis

Note: Interpretation of R 2 = .00–.009 = negligible, .01–.059 = small, .06–.139 = medium, > .14 = large. GS = Gratitude Scale, ZS = Zest Scale, OS = Optimism Scale, PS = Persistence Scale, and CS = Social and Emotional Health Survey — Primary. **p < .001.
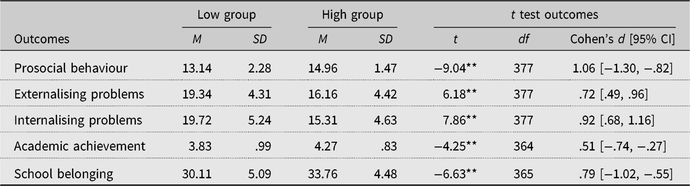
Following the path analyses, an independent-samples t test was performed to examine the differential effects of covitality status on youth school functioning and psychological adjustment indicators. Results from a between-group t test demonstrated that there were significant differences for the high covitality and low covitality groups: internalising problems (t = 7.86, p < .001), externalising problems (t = 6.18, p < .001), school belonging (t = −6.63, p < .001), prosocial behaviour (t = −9.04, p < .001), and academic achievement (t = −4.25, p < .001), ranging from moderate-to-large effect sizes (Cohen’s d range = .51–1.06). Children in the high covitality group reported significantly higher levels of academic achievement, school belonging and prosocial behaviour, and lower levels of internalising and externalising problems than children in the low covitality group (see Table 4). Taken together, these outcomes suggest that covitality is strongly associated with elementary school students’ school functioning and psychological adjustment.
Between-Group t Test Outcomes for Covitality Groups

Note: High group (n = 280) = covitality levels ≥ 48, low group (n = 99) = covitality levels ≤ 47; Cohen’s d effect size interpretation = .00–.19 = negligible, .20–.49 = small, .50–.79 = moderate, .80+ = large. **p < .001.
Discussion
Integrating positive indicators of mental health provide significant implications for the early identification of emotional challenges and supporting interventions that protect youth mental health and wellbeing (DiStefano & Kamphaus, Reference DiStefano and Kamphaus2006). The present study investigated the associations between positive psychological traits, school functioning, and psychological adjustment of elementary schoolchildren. Correlation analysis outcomes showed that student covitality indicators were positively associated with prosocial behaviour, school belonging and academic achievement, and negatively correlated with internalising and externalising problems. Path analysis results revealed that the positive psychology constructs had significant and large associations with prosocial behaviour, school belonging, internalising problems and externalising problems, as well as small-to-large associations with student academic achievement. Further, findings of this study indicated that youths with high positive psychological traits reported higher levels of the prosocial behaviour, school belonging and academic achievement, and lower levels of externalising and internalising problems. Overall, the combination of these positive traits, namely covitality, had stronger associations with youths’ school functioning and psychological adjustment than the individual constructs that comprise covitality. Taken together, the results suggest substantial associations between positive psychological traits and school functioning and psychological adjustment in elementary schoolchildren.
Findings of the study showed the significant and positive association between positive psychological traits (i.e., zest, gratitude, persistence, and optimism) and student academic achievement, school belonging, and prosocial behaviour. Particularly, persistence was found to be a strong predictor of academic achievement, while prosocial behaviour and school belonging were strongly predicted by the zest and gratitude domains. Consistent with these outcomes, previous research indicated that these positive traits were significantly associated with youth school functioning and wellbeing indicators (Duckworth, Peterson, Matthews, & Kelly, Reference Duckworth, Peterson, Matthews and Kelly2007; Furlong et al., Reference Furlong, You, Renshaw, O’Malley and Rebelez2013; Jones et al., Reference Jones, You and Furlong2013; Renshaw, Reference Renshaw2017; Sheridan, Boman, Mergler, & Furlong, Reference Sheridan, Boman, Mergler and Furlong2015). Telef and Furlong (Reference Telef and Furlong2017) investigated the association between covitality constructs and subjective wellbeing in Turkish and U.S. adolescents. Their outcomes revealed that zest was a significant predictor of subjective wellbeing in Turkish adolescents, whereas zest, gratitude, and optimism significantly predicted subjective wellbeing of U.S. adolescents. Wilkins and colleagues (Reference Wilkins, Boman and Mergler2015) found the significant association between positive psychological traits, school engagement, and prosocial behaviour among primary schoolchildren. Moreover, outcomes of this study indicated that students with high covitality reported fewer internalising and externalising problems compared with those who had low covitality. Positive psychological traits had a moderate-to-large association with youths’ internalising and externalising problems. Specifically, the persistence domain was found a strong predictor of internalising and externalising problems. Consistent with these outcomes, studies showed that youths with higher externalising and internalising problems reported lower levels of zest, optimism, persistence, and gratitude (Ames, Rawana, Gentile, & Morgan, Reference Ames, Rawana, Gentile and Morgan2015; Dvorak, Lamis, & Malone, Reference Dvorak, Lamis and Malone2013; Ey et al., Reference Ey, Hadley, Allen, Palmer, Klosky, Deptula and Cohen2005; McCullough, Emmons, & Tsang, Reference McCullough, Emmons and Tsang2002; Wong & Lim, Reference Wong and Lim2009). Consequently, these outcomes provide further evidence to support the association between positive psychological traits and school-based outcomes and psychological characteristics of elementary school students.
Consistent with the social-emotional health model (Furlong et al., Reference Furlong, You, Renshaw, O’Malley and Rebelez2013), outcomes of the present study indicated that the combination of the positive psychological traits had stronger associations with school-based outcomes and psychological adjustment than the individual positive traits. In the social-emotional health approach, covitality is characterised as the co-occurrence of multiple positive psychological traits, which increases the likelihood of positive outcomes and promotes youth mental health and wellbeing (Furlong et al., Reference Furlong, Dowdy, Carnazzo, Bovery and Kim2014). Findings of this study support the covitality model, which proposes that the ‘the sum is greater than the parts’ (Furlong et al., Reference Furlong, Dowdy, Carnazzo, Bovery and Kim2014). Previous research demonstrated that covitality was more strongly associated with a verity of valued youth outcomes (Arslan, Reference Arslan2018a; Furlong et al., Reference Furlong, You, Renshaw, O’Malley and Rebelez2013; Keyfitz et al., Reference Keyfitz, Lumley, Hennig and Dozois2013; Pennell et al., Reference Pennell, Boman and Mergler2015; Renshaw, Reference Renshaw2017; Renshaw & Arslan, Reference Renshaw and Arslan2016; Wilkins et al., Reference Wilkins, Boman and Mergler2015). Covitality was associated with more prosocial behaviours, better academic achievement, fewer internalising problems, greater school satisfaction, and fewer social relationship difficulties in children (Arslan, Reference Arslan2018a; Telef, Reference Telef2016; Wang, Yang, Jiang, & Furlong, Reference Wang, Yang, Jiang and Furlong2018). Furlong and colleagues (Reference Furlong, You, Renshaw, O’Malley and Rebelez2013) reported that covitality was significantly associated with caring relationships, prosocial behaviour, school rejection, and school acceptance. Students with high covitality were more likely to feel safe, whereas youths with low covitality were more likely to report that they had been bullied in school (Furlong et al., Reference Furlong, You, Renshaw, O’Malley and Rebelez2013). Furthermore, students classified into higher covitality groups reported greater school connectedness and academic efficacy compared with those in lower covitality groups (Renshaw, Reference Renshaw2017). Arslan (Reference Arslan2018a) found a significant association between covitality and many youth outcomes, including internalising and externalising problems, subjective wellbeing, and academic achievement in Turkish high school adolescents. Furthermore, the outcomes revealed that the combined effect of each of the covitality domains on youth psychological adjustment and wellbeing was higher than the effect of each positive construct individually (Arslan, Reference Arslan2018a). Taken together, these outcomes provide further evidence that the combination of youths’ positive psychological constructs is more powerful, rather than any of the unique constructs in isolation.
Conclusions and limitations
Findings from the present study should be considered in light of a number of methodological limitations. First, the study was conducted using a cross-sectional analytic approach that makes it difficult to determine causality and self-report data. Future research should be performed to explore the effects of covitality constructs using different data collection and analytic approaches, such as longitudinal, qualitative, or multiple. Second, participants were derived from a convenience sample of elementary school students in an urban city in Turkey. In order to increase the generalisability of the study outcomes, further research is warranted to examine the positive psychological constructs in a diverse sample with a large number of participants. Moreover, youth school functioning was assessed using self-report academic achievement, school belonging, and prosocial behaviour. Student school functioning is a broad construct, including a wide range of outcomes (Dick & Riddell, Reference Dick and Riddell2010). Therefore, the effects of positive psychological constructs on youth school functioning can be investigated using different school outcomes (e.g., peer relationships, school attendance, and school-report academic achievement) in future research.
Despite the limitations presented above, the results of the present study provide several implications for research and practice in the context of school-based mental health services. First, the outcomes showed that positive psychological traits (i.e., gratitude, zest, persistence, and optimism) significantly predicted youth school functioning and psychological adjustment. Positive psychological strengths play a role in understanding of positive youth development and provide clues for designing intervention and prevention services (Furlong et al., Reference Furlong, You, Renshaw, O’Malley and Rebelez2013; Ostaszewski & Zimmerman, Reference Ostaszewski and Zimmerman2006). Designing school-based prevention and intervention programs is suggested for mental health providers to reduce risk factors and promote youth strengths (American Psychological Association, 2014). Previous research has supported the effectiveness of positive psychological construct-based interventions on youth educational, social, emotional and behavioural functioning (e.g., gratitude, optimism; Froh, Miller, & Snyder, Reference Froh, Miller and Snyder2007; Quayle, Dziurawiec, Roberts, Kane, & Ebsworthy, Reference Quayle, Dziurawiec, Roberts, Kane and Ebsworthy2001). Based on the results of the present study, school counsellors or other professionals could design school-based intervention programs to support youths’ school functioning and psychological adjustment by enhancing their gratitude, zest, persistence, and optimism resources. However, the present study results suggest that building one domain alone (e.g., zest) might not be sufficient to promote youth school functioning and psychological adjustment (Pennell et al., Reference Pennell, Boman and Mergler2015). School-based mental health providers might consider the effects of the covitality in designing of the positive psychology-based prevention and intervention programs for youths. Given the complete mental health framework, school-based mental health providers and other professionals might integrate strengths-based preventions and interventions with traditional practices in school settings (Moffa, Dowdy, & Furlong, Reference Moffa, Dowdy and Furlong2016; Renshaw et al., Reference Renshaw, Furlong, Dowdy, Rebelez, Smith, O’Malley, Strom, Furlong, Gilman and Huebner2014).
Author ORCIDs
Gökmen Arslan 0000-0001-9427-1554