INTRODUCTION
Few attempts have been made to partition the crude protein (CP) intake of poultry between requirements for maintenance and growth, and such attempts have not solved the problem completely satisfactorily. The requirement for maintenance estimated based on nitrogen (N) balance studies are in fairly good agreement with each other. However, none of the studies is free from technical criticism, most of which stems from the necessary assumption that the values obtained can be applied to the animal reared in practical conditions.
Leveille & Fisher (Reference Leveille and Fisher1958, Reference Leveille, Shapiro and Fisher1960) and Leveille et al. (Reference Leveille, Shapiro and Fisher1960) reported several experiments designed to study N and amino acid (AA) requirements in protein-depleted and in protein-undepleted birds fed whole egg protein and purified diets. The equations fitted to predict the levels of AAs resulting in zero balance were linear for some AAs and curvilinear for others (Leveille & Fisher Reference Leveille and Fisher1960). In modelling AA requirements, Curnow (Reference Curnow1973) was one of the first to predict AA requirements of laying hens using a ‘broken-line’ model based on information on body weight and egg production. There have been various refinements of the Curnow (Reference Curnow1973) model over the years, although most of these refined models are still based on this simple model. Current models for predicting nutrient requirements of animals are mostly based on input–output relationships. The input required to support a given rate of growth can be estimated, if maintenance requirements and the partial efficiency of nutrient utilization for growth are known (National Research Council 1994b).
Non-linear modelling has been applied to partition the metabolizable energy (ME) intake into requirements for maintenance and growth in ruminants and in broiler chickens and turkeys (France et al. Reference France, Dhanoa, Cammell, Gill, Beever and Thornley1989; Darmani Kuhi et al. Reference Darmani Kuhi, Kebreab, Owen and France2001, Reference Darmani Kuhi, Kebreab, Lopez and France2003, Reference Darmani Kuhi, Kebreab, Lopez and France2004). These models were considered advantageous because they could predict the dietary ME requirements for maintenance and growth on a daily basis for the entire growth period. The objective of the current study is to apply linear and non-linear models to estimate CP and individual AA requirements for maintenance and growth in growing broilers. The research hypothesis was that the relationship between AA intake and protein accretion, and CP intake and growth are biological systems that are better described by non-linear functions.
MATERIALS AND METHODS
Experimental data
Nitrogen balance and protein accretion study
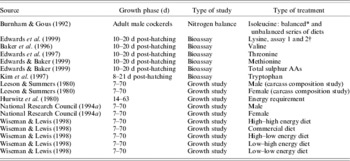
Results from N balance and bioassay experiments taken from the literature were used in this study (Burnham & Gous Reference Burnham and Gous1992; Baker et al. Reference Baker, Fernandez, Parsons, Edwards, Emmert and Webel1996; Kim et al. Reference Kim, Cho, Shin, Yang and Han1997; Edwards et al. Reference Edwards, Baker, Fernandez and Parsons1997, Reference Edwards, Fernandez and Baker1999; Edwards & Baker Reference Edwards, Fernandez and Baker1999). The information for data sources is summarized in Table 1.
Data sources used

* Two series of diets were used. An unbalanced series to give a range of intakes from 0 to 100 mg isoleucine/kg of LW, and a balanced series to provide an extra 15 mg isoleucine/kg of LW compared to the unbalanced series.
† Assay 1 (New Hampshire×Columbian male chicks) involved feeding of five graded doses of lysine representing 0·05, 0·40, 0·55, 0·70 and 0·95 of the ideal level required for maximal growth. In assay 2, six diets were fed to Avian×Avian male chicks each containing a different dose (0·05, 0·10, 0·40, 0·55, 0·70 and 0·95) of the ideal level required for maximal growth.
Growth study
A total of 10 time course profiles for broilers taken from the literature were used in the current study (Hurwitz et al. Reference Hurwitz, Weiselgerg, Eisner, Bartov, Riesenfeld, Sharvit, Niv and Bornesein1980; Leeson & Summers Reference Leeson and Summers1980; National Research Council 1994a; Wiseman & Lewis Reference Wiseman and Lewis1998) (Table 1). The data used were of sufficient detail. These include records of live weight (LW) and food consumption and dietary concentrations of CP, which permit further calculations to be made. However, where initial LW was not recorded, a value of 40 g was assumed.
The models
N balance and protein accretion study
The re-parameterized monomolecular equation (Darmani Kuhi et al. Reference Darmani Kuhi, Kebreab, Owen and France2001) used in the current study takes the form:

where Y is N balance or protein accretion (mg of N or g of protein accretion/g LW/day), Y max is the maximum attainable value for Y, K (mg of AA/g LW/day)−1 is a fractional rate parameter, X is AA intake (mg of AA/g LW/day) and X M is AA intake at maintenance.
The average efficiency of AA utilization for accretion between Δ1 times maintenance and Δ2 times maintenance (Δ2>Δ1⩾1) is:

Growth study
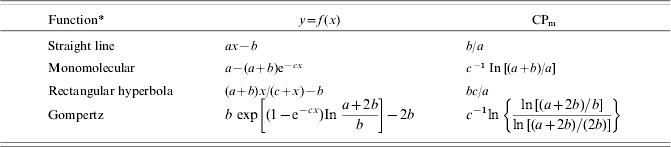
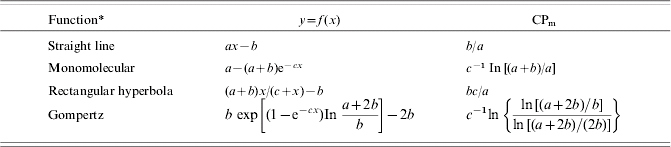
Four functional forms listed in Table 2 were used to investigate the relationship between scaled LW gain (LWG, g/g LW/day) and CP intake (g of CP/g LW/day). LWG and CP intake were calculated as follows:


where  is average LW. Average LW for different ages was calculated as the mean of weights at hatch and means at end of each week. If initial (hatch) LW was not recorded a value of 40 g was assumed.
The functional forms used to describe the relationship between LWG, f(x), and CP intake, x, in the growth study
* The parameters a, b and c are positive entities, with y max=a and y min=−b except for the straight line.
CPm=CP intake at maintenance.
The candidate functions are: a straight line; two equations representing diminishing returns behaviour (monomolecular and rectangular hyperbola); and one equation describing sigmoidal behaviour with a fixed point of inflexion (Gompertz) (Table 2). The CP requirement for maintenance (where LWG=0), x m (g/g of LW/day), was calculated by putting f(x) equal to zero and solving for x. The marginal efficiency of CP utilization for growth k g (g of LWG/g of CP intake), is given by:
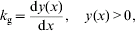
and the average efficiency between Δ1 times maintenance and Δ2 times maintenance (Δ2>Δ1⩾1) by:

Statistical analysis
The data for the N balance and protein accretion study were analysed using the non-linear regression function of SigmaPlot (SPSS 1998). Two statistical criteria were used to evaluate the general goodness-of-fit of the model: (i) proportion of variation accounted for [adjusted  ], the amount of total variation about the mean value of Y explained by the fitted curves and (ii) standard error of the parameters estimated (SE).
For the growth studies, statistical analyses were performed using the non-linear mixed facility (PROC NLMIXED, Littell et al. Reference Littell, Milliken, Stroub and Wolfinger1996) of SAS (SAS 2000), except for the straight-line function, which used the PROC MIXED procedure. Mixed model analysis was chosen because the data were gathered from various studies; therefore it was necessary to consider analysing not only fixed effects of the dependent variable but also random effects (because the studies represent a random sample of a larger population of studies). A random intercept to account for study effect was added to the model. Distribution of random effects was assumed to be normal and the dual quasi-Newton technique was used for optimization with adaptive Gaussian quadrature as the integration method. Performance of the models was evaluated using significance level of the parameters estimated, variance of error estimate and its approximate standard error. Comparison of models was based on Bayesian Information Criteria (BIC), which are model order selection criteria centred on parsimony and imposing a penalty on more complicated models for inclusion of additional parameters (Leonard & Hsu Reference Leonard and Hsu2001).
RESULTS
Nitrogen balance and protein accretion study
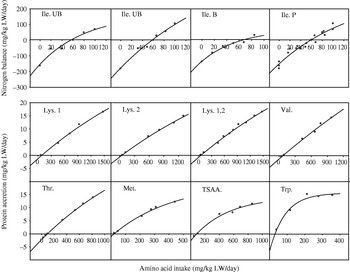
Goodness of fit of the monomolecular equation is illustrated in Fig. 1. The figure shows that both the relationship of N balance and protein accretion to AA intake can be satisfactorily modelled using a monomolecular function.
Plots of nitrogen balance (mg/kg of LW/day) and protein accretion (g/g of LW/day) against AA intake (mg/g of LW/day), showing fit of monomolecular equation to data. The AAs were: isoleucine (Ile.), lysine (Lys.), valine (Val.), threonine (Thr.), methionine (Met.), total sulphur amino acids (TSAA) and tryptophan (Trp.). The letters for Ile. and the numbers for Lys. indicate fit of equation to data from balanced (B) and unbalanced (U) series of diets and pooled data (P) for Ile. and to data from assay 1, 2 and pooled data (assay 1 and 2) for Lys.

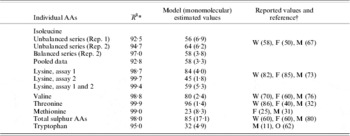
Results of fitting the monomolecular equation to the data along with the reported values of AA requirements for maintenance are shown in Table 3. The estimated  and SE values show that the fits are acceptable for the different data sets. The points of intersection of the different curves with x-axis represent the maintenance requirements for the individual AAs (Fig. 1). The maintenance requirements for isoleucine, lysine, valine, threonine, methionine, total sulphur AAs and tryptophan were 58, 59, 80, 96, 23, 85 and 32 mg AA/kg LW/day, respectively.
Estimated and reported maintenance requirements for individual AAs (mg/kg of LW/day) calculated using the monomolecular equation. Standard errors are given in brackets

* Adjusted R 2.
† References: (M) McDonald and Morris (Reference McDonald and Morris1985) ; (F) Fisher (Reference Fisher, Aranal, Pion and Bonin1983) ; (W) Wiseman (Reference Wiseman1994) ; (O) Owens et al. (Reference Owens, Pettigrew, Cornelius and Moser1985).
Growth study
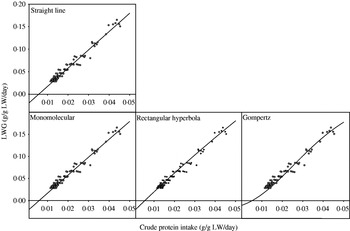
Figure 2 shows the fit of each model to the pooled data on LWG v. CP intake. The results indicated that the different models can be fitted to data without difficulty using mixed model analysis.
Plot of live weight gain (LWG, g/g of LW/day) against crude protein intake (CP intake, g/g of LW/day) for the functional forms: (A) straight line, (B) monomolecular, (C) rectangular hyperbola and (D) Gompertz.

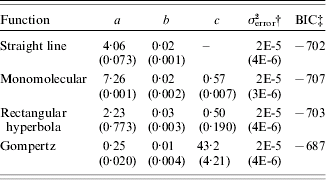
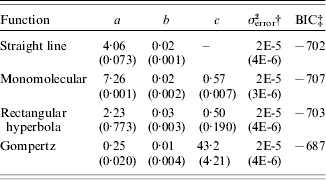
Regression of LWG (g/g of LW/day) against weekly CP intake (g of CP/g of LW/day), using the different models, is shown in Table 4. The values for the different data sets show that most of the variation in y (LWG) is accounted for by the regressions. Biological indicators calculated from the parameter estimates for the models are shown in Table 5. The values determined for CP intake at maintenance (CPm) varied slightly between models, ranging from 5·4 g in the case of the rectangular hyperbola to 5·9 g for the monomolecular. The value of average net protein utilization for producing gain in LW, calculated between 1 and 4 times maintenance, varied from 0·60 to 0·76, depending on the model (Table 5).
Parameter estimates obtained using the different models to regress LWG (g/g of LW/day) against CP intake (g of CP/g of LW/day). Standard errors are given in bracketsFootnote *
* Number of observations=94.
† Variance of error estimate.
‡ BIC=Bayesian Information Criteria.
Growth traits calculated using the different models in the growth study

* The average net protein utilization for growth between 1 and 4 times maintenance expressed as a coefficient calculated based on the assumption that the carcass of chicken contains approximately 180 g crude protein/kg.
† The average efficiency of utilization of CP for growth (g LWG/g CP intake) between 1–4, 1–2, 2–3 and 3–4 times maintenance.
DISCUSSION
Based on the BIC values (Table 4), the monomolecular equation was the best fit model followed by the other diminishing return function. The Gompertz was the least appropriate function. Biologically, loss of efficiency is expected as intake increases which is captured by the monomolecular equation. In contrast, the Gompertz predicts a sharp increase in efficiency as intake increases before levelling out at higher intakes, which did not fit well to the observed data.
Hurwitz et al. (Reference Hurwitz, Sklan and Bartov1978) constructed a model to estimate the protein and AA requirements of broilers for maintenance and growth. They used the recommended levels of Leveille & Fisher (Reference Leveille and Fisher1958, Reference Leveille, Shapiro and Fisher1960) and Leveille et al. (Reference Leveille, Shapiro and Fisher1960), and the carcass and feather protein contents of Edwards et al. (Reference Edwards, Dennan, Abou-Ashour and Nugara1973), as a base to build their model. Since diets formulated based on this model resulted in a large increase in abdominal fat, the model was later modified (Hurwitz et al. Reference Hurwitz, Weiselgerg, Eisner, Bartov, Riesenfeld, Sharvit, Niv and Bornesein1980, Reference Hurwitz, Frisch, Bar, Eisner, Bengal and Pines1983) to take into account the effects of environmental temperature and differences in proportion of the weight gain (as lipid) on the energy needs in both chickens and turkeys. This model was later adopted by National Research Council (1994a) for estimating the AA requirements of broilers and turkeys.
AAs acids required to maintain the integrity of body protein in broilers include those that are inevitably catabolized, those lost from the body through the digestive tract and those lost in sloughed skin and in feathers. Traditionally, the urinary N excretion of broilers fed protein free diets or the value obtained by extrapolation to zero of regression equations relating urinary N to N intake, as reported by Leveille & Fisher (Reference Leveille and Fisher1958) and Leveille et al. (Reference Leveille, Shapiro and Fisher1960), has been assumed to equal the maintenance requirements and are normally related to animals receiving normal quantities of dietary protein (Agriculture Research Council 1981). This raises general questions of interpretation. It is difficult to attain an endogenous N level without disturbing normal growth. Moreover, the apparent endogenous level is influenced by many factors such as: dietary protein intake and diet quality before and during the period of specific N starvation, age and so on (Brody Reference Brody1945). Research on laboratory animals and humans suggest that the daily obligatory loss of N may depend not only on the weight of the animal, which reflects its lean body mass, but also on the daily protein supply which influences its rate of protein turnover (ARC 1981). Leveille & Fisher (Reference Leveille and Fisher1958) showed that the use of protein depleted birds considerably reduces estimates of basal N requirement when compared to un-depleted birds. The maintenance requirement for N in protein-depleted birds was only half of the value that was determined previously for the un-depleted birds. The estimates of maintenance requirement based on the monomolecular model were within the range of reported values for isoleucine, methionine and tryptophan (Table 3). The maintenance requirement estimates for valine, threonine and total sulphur AAs were on the higher end of those reported by McDonald & Morris (Reference McDonald and Morris1985), Fisher (Reference Fisher, Aranal, Pion and Bonin1983) and Wiseman (Reference Wiseman1994).
The protein requirement of an animal is really a requirement for a supply of each of the AAs with a sufficient supply of suitable nitrogenous compounds from which the non-essential AAs can be synthesized. The amount of protein that must be supplied depends upon the yields of AAs obtained by the animal when that protein is digested (McDonald et al. Reference McDonald, Edwards, Greenhalgh and Morgan2002). The concept of the ideal protein is defined as the mixture of protein and AAs that exactly meets the requirement of the bird for each AA with neither excess nor deficiency. This is only possible with the use of protein of high biological value supplemented with pure AA. In practice, there is a departure from this because levels of AAs in the majority of raw materials have AA contents in excess for some of them. This is the case particularly with cereals which are very rich in non-essential AAs (glutamic and aspartic acids) (Wiseman Reference Wiseman1994). The surplus of AAs necessarily reduces the efficiency of utilization of the total protein content of a diet and consequently it leads to an increase in requirements, both for maintenance and growth. The magnitude of this effect depends on the extent of the deviation from an ideal balance of AAs (Agriculture Research Council 1975). This was probably the case which led Brody (Reference Brody1945), by examination of appropriate data from literature, to conclude that the digestible CP (DCP) requirement for maintenance is four times the protein equivalent of the endogenous urinary excretion. Brody (Reference Brody1945) also pointed out that the ratio of endogenous or minimal N excretion to basal metabolism is approximately constant in animals ranging from mice to cattle at about 2·1 mg of N/kcal. If one assumes that the value of basal metabolism for energy in broilers is 78 kcal/kg LW/day (Wiseman Reference Wiseman1994) and that the DCP content of a diet is equal to 0·85 of CP content, then the CP requirement for maintenance (CPm) will be:
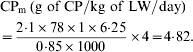
This value shows reasonable agreement with the values of CP requirement for maintenance (5·4–5·9 g of CP/kg LW/day, respectively) obtained using the models. With regard to the estimates of AA requirements for maintenance (mg of AA/kg LW/day) obtained using the monomolecular equation (Table 3), it can be seen that these estimates lie in the range reported by different researchers (Fisher Reference Fisher, Aranal, Pion and Bonin1983; McDonald & Morris Reference McDonald and Morris1985; Owens et al. Reference Owens, Pettigrew, Cornelius and Moser1985; Wiseman Reference Wiseman1994).
In conclusion, the models described herein were considered advantageous because they could predict the magnitude and direction of the responses of growing broilers to dietary AAs and protein without making any initial assumptions. Additionally, the models have the advantage of biological interpretability of the parameter estimates. According to Morris (Reference Morris, Cole and Haresign1989), three consequences could follow from this interpretability. Firstly, given a set of experimental data for animals with particular productive characteristics, one can reasonably extrapolate response curves to another group of animals of different body size or with different potential output. Secondly, given the results of a number of experiments, one can pool them to obtain best estimates of the response coefficients. Thirdly, one can estimate net efficiencies by procedures other than a simple feeding trail and so obtain independent confirmation of the response coefficients.