Implications
This study showed significant relationships between N isotopic fractionation and N partitioning when N supply exceeds that required to match energy supply in the diet. The difficulties in measuring N partitioning using the N balance technique may be overcome by using N isotopic fractionation, as an easy-to-use indicator of N partitioning. The ease of taking the N isotopic fractionation measurements mean that this approach could be developed for on-farm monitoring of N utilisation, or in breeding programmes for N utilisation.
Introduction
The most widespread method used to measure N partitioning is the N balance (NB) technique. The utilisation of N can be indicated by urea N concentration in blood or milk. However, NB is difficult to conduct, particularly with large numbers of animals (MacRae et al., Reference MacRae, Walker, Brown and Lobley1993) and urea N is subject to substantial diurnal variation (Broderick and Clayton, Reference Broderick and Clayton1997). Earlier studies identified that fractionation of stable N isotopes occurs during digestion and metabolism, notably during utilisation of N by ruminal bacteria fermenting carbohydrates (Wattiaux and Reed, Reference Wattiaux and Reed1995) and metabolism of amino acids in the liver (Sick et al., Reference Sick, Roos, Saggau, Haas, Meyn, Walch and Trugo1997). Therefore, N isotopic fractionation may potentially be used to quantify N partitioning of ruminants.
Well-managed temperate pasture often provides excess N relative to dietary energy supply (Litherland and Lambert, Reference Litherland and Lambert2007). This leads to a low efficiency of incorporating feed N into product N (e.g. milk or meat N), and large outputs of surplus N (mainly urine) to the environment. It has been proposed that production and N partitioning (i.e. the distribution of N among feed, urine, faeces, milk and retention in the body) can be manipulated through changing the key dietary compositions, namely the N to water-soluble carbohydrate (WSC) ratio in the diet (Miller et al., Reference Miller, Moorby, Davies, Humphreys, Scollan and MacRae2001). More feed N is expected to be partitioned to milk rather than urine with a decrease of N/WSC. However, a meta-data analysis and an in vitro study demonstrated that there may be an optimum concentration of N and WSC, which optimise rumen fermentation and animal production regardless of changes in N/WSC (Pacheco et al., Reference Pacheco, Lane, Burke and Cosgrove2007; Burke et al., Reference Burke, Pacheco and Cosgrove2011). Hence, the two objectives of this study were to evaluate the use of N isotopic fractionation as an indicator of N partitioning for non-lactating sheep offered three levels of N/WSC in the diet, and to examine the effect of dietary N/WSC on N partitioning.
Material and methods
Six non-lactating sheep aged between 1.5 and 2 years old and weighing 65.0 (s.d. = 3.9), 61.8 (s.d. = 4.4) and 62.5 (s.d. = 3.5) kg at the start of the three collection periods were used. Three dietary treatments (N/WSC) were evaluated in a 3 × 3 Latin square design with three periods of 3 weeks (2 weeks dietary adaptation and 1 week animal measurement in each period). Two sheep were allocated to each treatment in each period.
Diets
All sheep grazed on ryegrass/white clover-based pasture before the study. Lucerne pellets and straw were gradually introduced to the sheep, 10 days before the study commenced. Four days before period 1, sheep were consuming a 100% lucerne pellet diet and were individually housed in metabolism crates. Throughout the study, fresh water was available ad libitum.
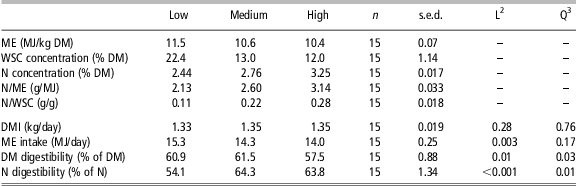
The diets were designed to provide slightly above maintenance metabolisable energy requirement (11.5 MJ ME/sheep per day; Nicol and Brookes, Reference Nicol and Brookes2007) with three levels of N/WSC (treatment Low, Medium and High), and expected to generate variations in both N isotopic fractionation and partitioning (Table 1). Additional WSC and N were provided by sprinkling white cane sugar (Chelsea, Auckland, New Zealand; 1700 kJ/100 g) or spraying liquid urea (Biolab, Australia; 46.7% N) onto the lucerne pellets (Winslow Ltd, Ashburton, New Zealand). The diets were formulated by adding 20 to 100 g sucrose/kg DM and 10 to 30 g urea/kg DM to the purchased lucerne pellet, depending on the pre-determined WSC and N concentrations from each batch of pellets.
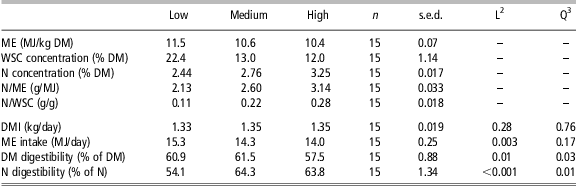
Feed intake and diet composition for the three diets varying in formulated N/WSC1
N = nitrogen; WSC = water-soluble carbohydrate; ME = metabolisable energy; DM = dry matter.
1Diets based on: Low (0.11 g N/g WSC); Medium (0.22 g N/g WSC); High (0.27 g N/g WSC).
2Linear effects.
3Quadratic effects.
Animal measurements
This study was undertaken at the Johnstone Memorial Laboratory, Lincoln University, New Zealand, under the authority of Lincoln University Animal Ethics Committee (approval no. 339). Sheep were housed separately in metabolism crates with feed offered once a day at 1000 h. All sheep were weighed on the day before and after each NB period.
Each sheep was offered 1.5 kg (fresh weight) of pellets daily and feed refusals were recorded to calculate dry matter intake (DMI). Feed samples from each treatment were collected for 7 days. Faeces and urine output were measured and sampled during days 2 to 7 of each NB period. A plastic bucket with a layer of metal mesh was placed under the drainage channel of each metabolism crate to allow urine to drain through the mesh and faeces stay on top of the mesh. To keep urine pH between 2 and 3, 250 ml of sulphuric acid (10% vol/vol) was added into each bucket daily before collection.
Blood samples were collected from the jugular vein into 10 ml Li-heparinised evacuated tubes at 1130 h on days 3 and 6 of each NB period. Plasma was immediately harvested by centrifugation at 4°C at 1200 × g for 15 min. Gluteal muscle and liver biopsy samples (0.5 g each) were taken from each animal at 0900 h on the last day of each period (Miller-Graber et al., Reference Miller-Graber, Lawrence, Foreman, Bump, Fisher and Kurcz1991). A 30 cm × 30 cm patch of wool from each sheep was shaved off at the beginning of period 1. The regrowth of wool from this patch was harvested 14 days after each NB period (Rogers and Schlink, Reference Rogers and Schlink2010). All samples were stored at −20°C and pooled per sheep per period before chemical analysis. Retained N (RN) was calculated using the equation: [RN (g/day) = N intake (NI; g/day) − faecal N (FN; g/day) = urinary N (UN; g/day)].
Analytical methods
All samples were freeze-dried and analysed for δ 15N following the procedure described by Cheng et al. (Reference Cheng, Kim, Merry and Dewhurst2011) using isotope ratio mass spectrometry (PDZ Europa Ltd, Crewe, UK). In vitro digestibility of organic matter on DM basis (DOMD) was measured following the procedure described by Clarke et al. (Reference Clarke, Flinn and McGowan1982). The ME content of feed was calculated using the equation: [MJ ME/kg DM = DOMD (g/kg DM) × 0.016]. Dry matter digestibility (DMD) was calculated using the equation: [DMD (%) = 1 − faecal output (FO; g/day)/DMI (g/day)]. Nitrogen digestibility (ND) was calculated using the equation: [ND (%) = 1 − FN (g/day)/NI (g/day)]. The concentration of WSC in feed samples was analysed following the method described by Rasmussen et al. (Reference Rasmussen, Parsons, Bassett, Christensen, Hume, Johnson, Johnson, Simpson, Stacke, Voisey, Xue and Newman2007). Feed, urine and faeces were analysed for N concentration using a Variomax CN Analyser (Elementar Analysensysteme GmbH, Hanau, Germany). Blood urea N (BUN) was analysed using an enzymatic kinetic method on a COBAS MIRA clinical analyzer (Roche Diagnostics, Rotkreuz, Switzerland). Urinary excretion of purine derivatives (PD) was analysed following the method described by George et al. (Reference George, Dipu, Mehra, Singh, Verma and Rangaokar2006) using HPLC (Agilent 1100 series, Waldbronn, Germany).
Statistical analysis
The Genstat statistical package (version 12.2; VSN International Ltd) was used for general ANOVA and linear regression analysis. All measured data were combined into single mean values for each sheep per period. The significance of linear and quadratic effects was determined using general ANOVA with N/WSC as treatment factor, and period + sheep as block. P-values >0.05 were declared as statistically non-significant.
Results
Three sheep refused feed from the start of the collections in periods 2 (two sheep) and period 3 (one sheep); and one liver sample from a sheep in period 1 was not obtained. Therefore, corresponding measurements were treated as missing values in subsequent statistical analysis.
Nitrogen isotopic fractionation in relation to nitrogen partitioning
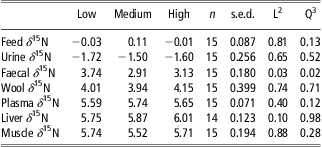
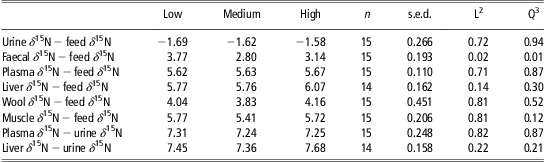
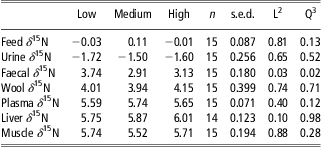
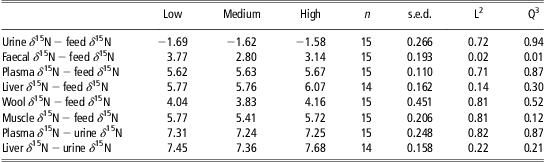
Wool, muscle, liver, plasma and faeces were enriched in 15N compared with feed; and urine was depleted in 15N relative to feed (Table 2). Dietary treatments had no significant effects on N isotopic fractionation apart from faecal δ 15N − feed δ 15N (P < 0.05; Table 3). Linear relationships using individual animal data per period were found between plasma δ 15N and UN/NI (equation (1) and muscle δ 15N and RN/NI (equation (2)).
Nitrogen-15 concentrations (delta units expressed relative to standard air; ‰) in the diet, excreta and tissue of sheep offered one of three diets varying in N/WSC1
N = nitrogen; WSC = water-soluble carbohydrate.
1Diets based on: Low (0.11 g N/g WSC); Medium (0.22 g N/g WSC); High (0.27 g N/g WSC).
2Linear effects.
3Quadratic effects.
Nitrogen isotopic fractionation of different body N sinks for sheep offered one of three diets varying in N/WSC1
N = nitrogen; WSC = water soluble carbohydrate.
1Diets based on: Low (0.11 g N/g WSC); Medium (0.22 g N/g WSC); High (0.27 g N/g WSC).
2Linear effects.
3Quadratic effects.
 $$ \displaylines{ & {\rm{Plasma}} \ {{{\rm{\delta }}}^{{\rm{15}}}} {\rm{N}}\,{\rm{(}}{\permil}{\rm{)}}\,{\rm{ = }}\,{\rm{3}}{\rm{.73}}\,\times \,{\rm{UN/NI}}\,{\rm{(g/g)}}\,{\rm{ + }}\,{\rm{3}}{\rm{.53}} \cr & {\rm{(}}n\,{\rm{ = }}\,{\rm{15;}}\,{{R}^{\rm{2}}} \,{\rm{ = }}\,{\rm{0}}{\rm{.62;}}\,P\, \less \,{\rm{0}}{\rm{.001;}}\,{\rm{s}}{\rm{.e}}{\rm{.}}\,{\rm{ = }}\,{\rm{0}}{\rm{.24)}} $$
 $$ \displaylines{ & {\rm{Muscle}} \ {{{\rm{\delta }}}^{{\rm{15}}}} {\rm{N}}\,{\rm{(}}{\permil}{\rm{)}}\,{\rm{ = }}\,{\rm{ - 5}}{\rm{.26}}\,\times \,{\rm{RN/NI}}\,{\rm{(g/g)}}\,{\rm{ + }}\,{\rm{5}}{\rm{.89}} \cr & {\rm{(}}n\,{\rm{ = }}\,{\rm{15;}}\,{{R}^{\rm{2}}} \,{\rm{ = }}\,{\rm{0}}{\rm{.60;}}\,P\, \less \,{\rm{0}}{\rm{.001;}}\,{\rm{s}}{\rm{.e}}{\rm{.}}\,{\rm{ = }}\,{\rm{0}}{\rm{.46)}} $$
Feed intake and composition
Table 1 shows that DMI was not affected by the dietary treatments. As N/WSC increased from low to high treatment, the ME and ME intake decreased. Treatment effects were observed for ND (% of N) and DMD (% of DM).
Nitrogen partitioning, BUN and PD
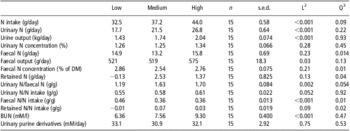
Nitrogen intake increased from 32.5 to 44.0 g/day as N/WSC increased (Table 4). Dietary treatment had a linear effect on NI (g/day), urine output (UO, kg/day), UN (g/day), FO (g/day), UN/FN (g/g), FN/NI (g/g) and BUN (mM/l; Table 4). On average, RN was 0.57 g/day and ranged between −7.02 and 6.65 g/day.
Nitrogen partitioning, blood urea N and urinary excretion of purine derivatives for sheep offered one of three diets varying in N/WSC1

N = nitrogen; WSC = water-soluble carbohydrate; DM = dry matter; BUN = blood urea N.
1Diets based on: Low (0.11 g N/g WSC); Medium (0.22 g N/g WSC); High (0.27 g N/g WSC).
2Linear effects.
3Quadratic effects.
Discussion
Nitrogen isotopic fractionation
The average feed δ 15N in the current study was 0.05‰ (Table 2), which is similar to the value reported for lucerne (0.00‰) by Steele et al. (Reference Steele, Bonish, Daniel and O'Hara1983). Faeces, wool, plasma, muscle and liver were on average enriched in δ 15N by 3.13, 4.14, 5.70, 5.78 and 7.89‰, respectively, compared with feed, and urine was depleted in δ 15N by 1.54‰ relative to feed (Table 3). These findings agree with the results of others (Koyama, Reference Koyama1985; Sponheimer et al., Reference Sponheimer, Robinson, Ayliffe, Roeder, Hammer, Passey, West, Cerling, Dearing and Ehleringer2003). In addition, the enrichment of wool in the current study was comparable to that previously reported by Männel et al. (Reference Männel, Auerswald and Schnyder2007) with sheep grazing pure C3 sward. Some ecology studies (Hobson et al., Reference Hobson, Alisauskas and Clark1993; Sponheimer et al., Reference Sponheimer, Robinson, Ayliffe, Roeder, Hammer, Passey, West, Cerling, Dearing and Ehleringer2003), suggested that body tissues with slower N turnover rates (e.g. muscle and wool) are less likely to reflect N metabolic changes compared with active tissues (e.g. liver and plasma) when feeding studies have short periods. This finding is supported by the low correlation between δ 15N of wool and plasma (R 2 = 0.20; P = 0.053); but was not the case for muscle δ 15N, which was well correlated with plasma δ 15N (R 2 = 0.78; P < 0.001). These differences in correlations may be due to differences in the enzymatic discrimination reactions or/and the turnover rates involved in wool and muscle synthesis under current feeding system.
Nitrogen isotopic fractionation in relation to nitrogen partitioning
Sick et al. (Reference Sick, Roos, Saggau, Haas, Meyn, Walch and Trugo1997) provided preliminary evidence in their study with rats that urea and protein from plasma were, respectively, less depleted and more enriched in δ 15N compared with feed when NI increased. In general, UN/NI is positively related to NI of the animal (Castillo et al., Reference Castillo, Kebreab, Beever, Barbi, Sutton, Kirby and France2001; Cheng et al., Reference Cheng, Kim, Merry and Dewhurst2011). Furthermore, the body protein pool and UN are mainly derived from the plasma amino acids and plasma urea pools, respectively (Sick et al., Reference Sick, Roos, Saggau, Haas, Meyn, Walch and Trugo1997). Consequently, we anticipated a negative relationship between muscle δ 15N and RN/NI. Similarly, we predicted a positive relationship between plasma δ 15N and UN/NI. Our data provided support for these relationships (equations (1) and (2)), with both relationships being statistically significant. It is notable that these relationships occurred even when animals were losing weight (equation (2)).
Wattiaux and Reed (Reference Wattiaux and Reed1995) reported that incorporation of ammonia into bacterial protein resulted in depletion and enrichment of 15N in microbial protein and ruminal ammonia, respectively, which would lead to the opposite relationships to those described above (Cheng et al., Reference Cheng, Kim, Merry and Dewhurst2011). It seems likely that there was little difference in N isotopic fractionation in the rumen as dietary treatments had no effect on PD excretion in the current study (Table 4), which may indicate that there was no difference in rumen microbial protein synthesis (Cheng et al., Reference Cheng, Kim, Merry and Dewhurst2011). The possibility of N turnover leading to ruminal N isotopic fractionation without altered microbial protein synthesis cannot be excluded. as RN/NI and UN/NI increased and decreased, respectively, over the course of the study, it is not possible to preclude the possibility that the relationships described in equations (1) and (2) were due to a residual effect of the diet offered before the study, which may have influenced the 15N content of body protein reserves. However, this seems unlikely as the use of plasma rather than whole blood in the current study would minimise the residual effect. Hilderbrand et al. (Reference Hilderbrand, Varley, Robbins, Hanley, Titus and Servheen1996) showed it took less time for plasma (∼10 days) from bears to reach plateau 15N levels compared with red blood cells (∼30 days). In addition, Steele and Daniel (Reference Steele and Daniel1978) showed expected levels of enrichment of plasma and depletion of urine after a 21-day dietary adaptation in cows. Therefore, the previous diet before starting the next collection period would most likely being cleared from body protein and plasma protein in the current study.
Although N isotopic discrimination may occur at various sites in the body, the liver is considered as one of the key sites where the major discrimination occurs in animals (Sick et al., Reference Sick, Roos, Saggau, Haas, Meyn, Walch and Trugo1997). It is possible that more than one N metabolic pathway is involved in the discrimination of N and resulted in the correlations described in equations (1) and (2). However, as an alternative pathway, the level of urea recycling from current diet is expected to be low when NI is greater than requirement (Reynolds and Kristensen, Reference Reynolds and Kristensen2008). Therefore, under the condition of this study, the relationship between N isotopic fractionation and N partitioning were mainly driven by deamination or transamination in the liver, as suggested by Macko et al. (Reference Macko, Fogel, Engel and Hare1986), similar to the fractionation reported by Sick et al. (Reference Sick, Roos, Saggau, Haas, Meyn, Walch and Trugo1997) for rats offered a range of protein sources.
Nitrogen metabolism
A similar amount of DMI was consumed by the sheep at all three levels of N/WSC, which eliminated variation in DMI as a factor influencing the dietary effect on N partitioning. The changes in N partitioning are thus expected to be solely a result of the different diet composition. The proportion of NI excreted in urine (UN/NI) in the current study (0.55 to 0.61 g/g) was slightly higher than that reported (0.55 g/g) by Brand et al. (Reference Brand, Frank and Cloete1992). The results in Table 4 show a trend (P < 0.1) for decreasing UN/NI as N/WSC decreased, similar to Edwards et al. (Reference Edwards, Parsons and Rasmussen2007) who concluded that a reduction in UN/NI of dairy cows should be expected when N/WSC (g/g) decreased from 0.27 to 0.12. We reasoned that the excessive N supply (the average NI of our sheep was at least 1.8 times the maintenance N requirement according to Brookes and Nicol, Reference Brookes and Nicol2007) and the relative low fermentable ME limited the microbial protein synthesis resulting in limited treatment effects on UN/NI (van Vuuren et al., Reference van Vuuren, van der Koelen, Valk and de Visser1993). This argument is supported by urinary PD excretion (Table 4), suggesting no change in microbial protein synthesis across treatments.
The partitioning of surplus N away from urine to faeces may contribute to reduce nitrate leaching to the ground water and ammonia volatilisation to atmosphere (Varel et al., Reference Varel, Nienaber and Freetly1999), as well as a reduction in nitrous oxide, which is a potent greenhouse gas. Similar to results reported from a study with dairy cows (Moorby et al., Reference Moorby, Evans, Scollan, MacRae and Theodorou2006), our study showed that UN/FN decreased by around 43% when WSC was added to the diet (Table 4). This change in N excretion pattern was achieved through decreasing NI, UN and UO rather than increasing rumen microbial protein synthesis, which was showed by Miller et al. (Reference Miller, Moorby, Davies, Humphreys, Scollan and MacRae2001).
BUN is used as an indicator of N utilisation in ruminants (Kohn et al., Reference Kohn, Dinneen and Russek-Cohen2005). In this study, BUN results were within the range previously reported (Kohn et al., Reference Kohn, Dinneen and Russek-Cohen2005). Using regression analysis, only 13% (P = 0.1) of the dietary treatment (N/WSC) variations were explained by changes in individual BUN. The linear relationship between BUN and UN/NI (R 2 = 0.55; P < 0.001), and BUN and RN/NI (R 2 = 0.24; P = 0.04) were significant. These low to moderately strong correlations may be due to the changes in urea metabolism and BUN concentrations that were not captured in single spot blood sample (Broderick and Clayton, Reference Broderick and Clayton1997).
Conclusion
Decreasing N/WSC ratio in the diets led to a reduction in UN/FN. BUN was moderately correlated with UN/NI. Moderate to strong relationships were found between N partitioning and isotopic fractionation when using individual animal data per period, which confirmed the potential to use N isotopic fractionation as an indicator of N partitioning in non-lactating sheep when N supply exceeds that required to match energy supply in the diet. Further studies are required to preclude possible residual effects of the previous diet on the contribution of 15N from body reserves. The rate of N and 15N turnover of different body N sink needs to be determined in order to confirm the use of most appropriate tissue.
Acknowledgements
The financial support from the Ministry of Science and Innovation (DRCX 0802; Dairy Systems for Environmental Protection; New Zealand) and Gan Su Agriculture University (GAU-CX1040; Science Innovation Fund, China) are acknowledged. Guo Yang, Chris Logan, Martin Ridgway, Innocent Rugoho, Evelyn Teo, Roger Cresswell, Diane Keaney, Jenny Zhao and Jeffery Thackwell from Lincoln University (New Zealand) are thanked for sampling and chemical analysis. Professor Andrew Sykes, Dr Jim Gibbs, Dr Richard Sedcole, Dr Racheal Bryant, Dr Graham Barrell, Dr Sabrina Greenwood and Dr Simon Hodge from Lincoln University (New Zealand) and Dr Rob Derrick from Winslow Ltd (New Zealand) are also thanked for useful discussion.