1 Introduction
The mean dynamics of turbulent flow past irregular rough surfaces are of significant fundamental and practical interest. Roughness effects upon turbulent flow have been reviewed by Jiménez (Reference Jiménez2004) and Flack & Schultz (Reference Flack and Schultz2014). The principal effect of surface roughness is to increase the mean momentum deficit in the outer flow, relative to a smooth wall. The downward shift of the logarithmic layer is referred to as the roughness function,
 $\unicode[STIX]{x0394}U^{+}$
(Hama Reference Hama1954). Surface roughness effects are incorporated into Reynolds-averaged Navier–Stokes (RANS) simulations by modifying the log law with an additive roughness function (Durbin et al.
Reference Durbin, Medic, Seo, Eaton and Song2001). Accurate predictions of practical rough-wall flows therefore require a detailed understanding of how
 $\unicode[STIX]{x0394}U^{+}$
varies with both flow conditions and surface topography. Recent experimental campaigns (Flack et al.
Reference Flack, Schultz, Barros and Kim2016) and numerical simulations (Thakkar, Busse & Sandham Reference Thakkar, Busse and Sandham2016; Forooghi et al.
Reference Forooghi, Stroh, Magagnato, Jakirlic and Frohnapfel2017) have identified skewness,
 ${\mathcal{S}}$
, as a key topographical parameter that influences
 $\unicode[STIX]{x0394}U^{+}$
.
Skewness quantifies the asymmetry of a roughness distribution about its mean plane. Positively skewed surfaces are peak-dominated, whereas negatively skewed surfaces are pit-dominated. In the early stages of erosion and fouling, an initially smooth surface can become blemished by a random distribution of roughness pits and/or peaks. Examples include the ablation of freshly cast turbine blades (Bons et al.
Reference Bons, Taylor, McClain and Rivir2001) and the onset of bio-fouling on submerged bodies (Monty et al.
Reference Monty, Dogan, Hanson, Scardino, Ganapathisubramani and Hutchins2016). Many fluid dynamic properties of irregular pit- and peak-dominated surfaces remain unclear. For example, the relative importance of ‘form-induced’ dispersive stresses and Reynolds stresses, and their respective contributions to
 $\unicode[STIX]{x0394}U^{+}$
, have yet to be considered in detail.
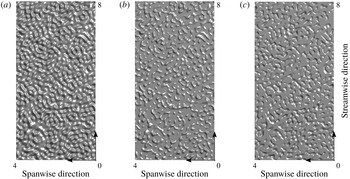
The present study details results from a numerical experiment specifically designed to examine the roughness functions of three irregular surfaces: (i) a Gaussian surface; (ii) a ‘peaks-only’ surface and (iii) a ‘pits-only’ surface. Surface (i) is synthesised using a surface generation algorithm, whereas (ii) and (iii) are obtained from a decomposition of (i). Each roughness topography is shown in figure 1. Analysis of results is aided by deriving an equation for
 $\unicode[STIX]{x0394}U^{+}$
that quantitatively identifies the mechanisms of mean momentum loss and/or gain for each surface. This paper is organised into four sections: § 2 outlines the numerical methodology; results are presented in § 3; finally, in § 4, the conclusions of this work are given.
Roughness topographies including: (a) Gaussian, (b) peaks-only and (c) pits-only surfaces. Each surface is generated on an
 $(8\times 4)/\unicode[STIX]{x1D6FF}$
tile, where
 $\unicode[STIX]{x1D6FF}$
is the mean channel half-height.

2 Numerical methodology
Direct numerical simulations (DNS) of rough-wall fully developed turbulent channel flows are conducted using a variant of the methodology devised by Busse, Lützner & Sandham (Reference Busse, Lützner and Sandham2015).
2.1 Surface generation algorithm
Surface height maps were generated by correlating the elements of Gaussian random-number matrices using a moving-average (MA) process. This method of surface generation was devised by Patir (Reference Patir1978) and has been extended here with periodic boundary conditions. A periodic Gaussian height map,
 $h_{ij}$
, of size
 $N_{1}\times N_{2}$
, was generated by evaluating the linear transformation
 $$\begin{eqnarray}\displaystyle \left.\begin{array}{@{}c@{}}h_{ij}=\displaystyle \mathop{\sum }_{k=1}^{n_{1}}\mathop{\sum }_{l=1}^{n_{2}}\unicode[STIX]{x1D6FC}_{kl}\unicode[STIX]{x1D702}_{rs},\quad \begin{array}{@{}l@{}}i=1,2,\ldots ,N_{1},\\ j=1,2,\ldots ,N_{2},\\ r=[i+k-1\,(\hspace{0.2em}{\rm mod}\hspace{0.2em}N_{1})]+1,\\ s=[j+l-1\,(\hspace{0.2em}{\rm mod}\hspace{0.2em}N_{2})]+1,\end{array}\end{array}\right\} & & \displaystyle\end{eqnarray}$$
where
 $\unicode[STIX]{x1D702}_{ij}$
is a matrix of uncorrelated Gaussian random numbers,
 $\unicode[STIX]{x1D6FC}_{kl}$
are a set of coefficients that give a specified autocorrelation coefficient function (ACF),
 $\hspace{0.2em}{\rm mod}\hspace{0.2em}$
denotes the modulo operator and
 $n_{1}\times n_{2}$
is the dimension of the MA window.
The MA coefficients
 $\unicode[STIX]{x1D6FC}_{kl}$
are determined by solving the system of nonlinear equations
 $$\begin{eqnarray}\displaystyle \left.\begin{array}{@{}c@{}}R_{pq}=\displaystyle \mathop{\sum }_{k=1}^{n_{1}-p}\mathop{\sum }_{l=1}^{n_{2}-q}\unicode[STIX]{x1D6FC}_{kl}\unicode[STIX]{x1D6FC}_{k+p,l+q},\quad \begin{array}{@{}l@{}}p=0,1,\ldots ,n_{1}-1,\\ q=0,1,\ldots ,n_{2}-1,\end{array}\end{array}\right\} & & \displaystyle\end{eqnarray}$$
using the Newton-based method outlined by Patir (Reference Patir1978), where
 $R_{pq}$
is the discrete ACF. The Gaussian height map is generated with an isotropic exponential ACF
 $$\begin{eqnarray}\displaystyle R(\unicode[STIX]{x0394}x_{1},\unicode[STIX]{x0394}x_{2})=\exp \left(-2.3\sqrt{\left(\frac{\unicode[STIX]{x0394}x_{1}}{\unicode[STIX]{x0394}x_{1}^{\ast }}\right)^{2}+\left(\frac{\unicode[STIX]{x0394}x_{2}}{\unicode[STIX]{x0394}x_{2}^{\ast }}\right)^{2}}\,\right), & & \displaystyle\end{eqnarray}$$
where
 $(\unicode[STIX]{x0394}x_{1}^{},\unicode[STIX]{x0394}x_{2}^{})$
denote the spatial separations in the streamwise and spanwise directions, respectively, and where
 $(\unicode[STIX]{x0394}x_{1}^{\ast },\unicode[STIX]{x0394}x_{2}^{\ast })$
denote the spatial separations at which the streamwise and spanwise ACF profiles reduce to 10 % of their values at the origin. Further details can be found in the work of Patir (Reference Patir1978).
2.2 Surface filtering and the pit–peak decomposition
To obtain a smoothly varying surface from the point cloud, the discrete Gaussian height map,
 $h_{ij}$
, was low-pass Fourier-filtered using the method of Busse et al. (Reference Busse, Lützner and Sandham2015). After filtering, a ‘pit–peak’ decomposition was applied to the Gaussian height map
 $$\begin{eqnarray}\displaystyle & \displaystyle h_{pit}(x_{1},x_{2})={\textstyle \frac{1}{2}}h(x_{1},x_{2})[1-\text{sgn}(h(x_{1},x_{2}))], & \displaystyle\end{eqnarray}$$
 $$\begin{eqnarray}\displaystyle & \displaystyle h_{peak}(x_{1},x_{2})={\textstyle \frac{1}{2}}h(x_{1},x_{2})[1+\text{sgn}(h(x_{1},x_{2}))], & \displaystyle\end{eqnarray}$$
where
 $h_{pit}$
,
 $h_{peak}$
and
 $h$
denote the pits-only, peaks-only and Gaussian height maps, respectively, and where
 $\text{sgn}$
denotes the signum function.
The pit–peak decomposition of the Gaussian height map is shown in figure 1. Statistical properties of each roughness topography are given in table 1. One advantage of the pit–peak decomposition is that
 $h_{pit}$
and
 $h_{peak}$
share very similar statistical properties up to fourth order, with the exception of skewness, which are approximately equal and opposite
 $({\mathcal{S}}\approx \pm 1.6)$
. Compared to a number of recent studies (Flack et al.
Reference Flack, Schultz, Barros and Kim2016; Thakkar et al.
Reference Thakkar, Busse and Sandham2016; Forooghi et al.
Reference Forooghi, Stroh, Magagnato, Jakirlic and Frohnapfel2017), the maximum skewness considered in the present study is at least a factor of two higher.
In addition to influencing the level of skewness, the pit–peak decomposition also affects other topographical parameters. For example, the effective slope
 $(ES_{x})$
of the pits- and peaks-only surfaces is a factor of two lower than that of the original Gaussian surface (see table 1). The effective slope
 $ES_{x}$
is defined as the mean absolute streamwise gradient of the height map and is known to scale
 $\unicode[STIX]{x0394}U^{+}$
for a wide range of irregular roughness topographies with symmetric height distributions (Napoli, Armenio & De Marchis Reference Napoli, Armenio and De Marchis2008; De Marchis, Napoli & Armenio Reference De Marchis, Napoli and Armenio2010; De Marchis & Napoli Reference De Marchis and Napoli2012) as well as positively skewed pyramid roughness (Schultz & Flack Reference Schultz and Flack2009). Considering that the pits- and peaks-only surfaces share an
 $ES_{x}$
of
 $ES_{x}<0.35$
, then these surfaces fall into the ‘waviness flow regime’ where
 $ES_{x}$
remains an important parameter in scaling the roughness function (Flack & Schultz Reference Flack and Schultz2010, Reference Flack and Schultz2014). However, in the context of the pits-only surface
 $({\mathcal{S}}\approx -1.6)$
and the peaks-only surface
 $({\mathcal{S}}\approx 1.6)$
, skewness is the key topographical parameter and, as will be shown later,
 $ES_{x}$
cannot be relied upon to scale
 $\unicode[STIX]{x0394}U^{+}$
. Irregular surfaces with moderate effective slope are of considerable practical importance. For example, a recent surrogate for Nikuradse-type roughness (Thakkar, Busse & Sandham Reference Thakkar, Busse and Sandham2018) showed a moderate effective slope, which indicates that Nikuradse’s sand grain roughness may have been ‘wavy’ based on the effective slope criterion.
Surface statistics including: mean absolute height
 $(S_{a})$
; root-mean-square (r.m.s.) height
 $(S_{q})$
; skewness
 $({\mathcal{S}})$
; kurtosis
 $({\mathcal{K}})$
; streamwise/spanwise correlation lengths
 $({\mathcal{L}}_{1,corr},{\mathcal{L}}_{2,corr})$
; streamwise/spanwise effective slopes
 $(ES_{x},ES_{y})$
; and mean peak-to-valley height
 $(S_{z,5\times 5})$
. The highest roughness crest
 $(h_{max})$
and mean height
 $(\langle h\rangle )$
are also included. Further details of these parameters can be found in work done by Thakkar et al. (Reference Thakkar, Busse and Sandham2016). Note that
 $\unicode[STIX]{x1D6FF}$
is the mean channel half-height.

2.3 Direct numerical simulation of turbulent channel flow past irregular rough walls
DNS of incompressible fully developed turbulent channel flow past rough walls were performed at a constant mean streamwise pressure gradient using the embedded-boundary algorithm of Busse et al. (Reference Busse, Lützner and Sandham2015). Three rough-wall simulations were performed with roughness on both the top and bottom walls. A reference smooth-wall simulation was also conducted. The velocity components in the streamwise
 $(x_{1})$
, spanwise
 $(x_{2})$
and wall-normal
 $(x_{3})$
directions are
 $u_{1}$
,
 $u_{2}$
and
 $u_{3}$
, respectively, and
 $p$
is the fluctuating pressure. The friction Reynolds number is defined here as
 $Re_{\unicode[STIX]{x1D70F}}\equiv u_{\unicode[STIX]{x1D70F}}\unicode[STIX]{x1D6FF}/\unicode[STIX]{x1D708}$
, where
 $\unicode[STIX]{x1D708}$
is the kinematic viscosity,
 $u_{\unicode[STIX]{x1D70F}}$
is the friction velocity and
 $\unicode[STIX]{x1D6FF}$
is the mean channel half-height of the Gaussian rough-wall configuration. All simulations were conducted at a friction Reynolds number of
 $Re_{\unicode[STIX]{x1D70F}}=395$
. Viscous-scaled quantities are marked by superscript +, e.g.
 $x_{3}^{+}=x_{3}u_{\unicode[STIX]{x1D70F}}/\unicode[STIX]{x1D708}$
. The simulation parameters are listed in table 2 and are commensurate with those in recent work related to the current study (Busse et al.
Reference Busse, Lützner and Sandham2015; Thakkar et al.
Reference Thakkar, Busse and Sandham2016; Busse, Thakkar & Sandham Reference Busse, Thakkar and Sandham2017; Thakkar et al.
Reference Thakkar, Busse and Sandham2018).
Rough-wall simulation parameters including: friction Reynolds number
 $(Re_{\unicode[STIX]{x1D70F}})$
; domain size in the streamwise
 $(L_{1})$
and spanwise
 $(L_{2})$
directions; viscous-scaled grid spacings including streamwise
 $(\unicode[STIX]{x0394}x_{1}^{+})$
, spanwise
 $(\unicode[STIX]{x0394}x_{2}^{+})$
, minimum wall-normal
 $(\unicode[STIX]{x0394}x_{3,min}^{+})$
and maximum wall-normal
 $(\unicode[STIX]{x0394}x_{3,max}^{+})$
values; viscous-scaled sampling period
 $(T^{+})$
; viscous-scaled mean absolute roughness height
 $(S_{a}^{+})$
; viscous-scaled r.m.s. roughness height
 $(S_{q}^{+})$
; and viscous-scaled highest roughness crest
 $(h_{max}^{+})$
.

Statistical quantities are computed using a double-averaged (DA) methodology (Raupach & Shaw Reference Raupach and Shaw1982). An instantaneous field variable, say
 $a$
, is decomposed into three parts: (i) a DA component,
 $\langle \overline{a}\rangle$
, where overbar and angled brackets denote successive temporal and planar
 $(x_{1},x_{2})$
averages, respectively; (ii) a dispersive component,
 $\tilde{a}$
; and (iii) a stochastic component,
 $a^{\prime }$
. The triple decomposition of
 $a$
is therefore
 $$\begin{eqnarray}\displaystyle a(\boldsymbol{x},t)=\langle \overline{a}\rangle (x_{3})+\tilde{a}(\boldsymbol{x})+a^{\prime }(\boldsymbol{x},t). & & \displaystyle\end{eqnarray}$$
The DA operator is defined as
 $$\begin{eqnarray}\displaystyle \langle \overline{a}\rangle (x_{3})\equiv \frac{1}{\unicode[STIX]{x1D713}(x_{3})}\frac{1}{A}\iint _{A}\overline{a}(\boldsymbol{x})\,\text{d}x_{1}\,\text{d}x_{2}, & & \displaystyle\end{eqnarray}$$
where the total area of the wall-parallel plane is
 $A=L_{1}L_{2}$
and the ratio of the fluid-occupied area,
 $A_{f}$
, to the total area is
 $\unicode[STIX]{x1D713}=A_{f}(x_{3})/A$
. In solid-occupied regions,
 $a(\boldsymbol{x},t)=0$
. Note that the DA methodology adopted throughout the present study corresponds to the ‘intrinsic’ averaging procedure discussed in detail by, for example, Nikora et al. (Reference Nikora, McEwan, McLean, Coleman, Pokrajac and Walters2007).
In the double-averaged Navier–Stokes (DANS) equations, the DA dispersive stresses are
 $$\begin{eqnarray}\displaystyle \langle \tilde{u} _{i}\tilde{u} _{j}\rangle =\langle (\overline{u}_{i}-\langle \overline{u}_{i}\rangle )(\overline{u}_{j}-\langle \overline{u}_{j}\rangle )\rangle & & \displaystyle\end{eqnarray}$$
and the DA Reynolds stresses are
 $$\begin{eqnarray}\displaystyle \langle \overline{u_{i}^{\prime }u_{j}^{\prime }}\rangle =\langle \overline{(u_{i}-\overline{u}_{i})(u_{j}-\overline{u}_{j})}\rangle . & & \displaystyle\end{eqnarray}$$
3 Results
In this section, the roughness functions induced by the Gaussian, peaks-only and pits-only surfaces are examined. Analysis of results is aided by deriving an equation for
 $\unicode[STIX]{x0394}U^{+}$
that quantifies the contributions of dispersive shear stress (DSS) and Reynolds shear stress (RSS) above each roughness topography.
3.1 Derivation of the roughness function equation
The potential sources of momentum loss above a rough surface can be revealed by subtracting the streamwise component of the DANS equation from its smooth-wall counterpart. If the friction Reynolds number is matched between the smooth- and the rough-wall cases, then the difference in total shear stress above the highest roughness crest (
 $x_{3}^{+}>h_{max}^{+}$
) can be written as
 $$\begin{eqnarray}\displaystyle 0=\unicode[STIX]{x0394}\frac{\text{d}\langle \overline{u}_{1}^{+}\rangle }{\text{d}x_{3}^{+}}+\langle \tilde{u} _{1}^{+}\tilde{u} _{3}^{+}\rangle _{r}-\unicode[STIX]{x0394}\langle \overline{u_{1}^{\prime }u_{3}^{\prime }}^{+}\rangle , & & \displaystyle\end{eqnarray}$$
where
 $\unicode[STIX]{x0394}\langle \overline{a}^{+}\rangle \equiv \langle \overline{a}^{+}\rangle _{s}-\langle \overline{a}^{+}\rangle _{r}$
denotes the difference between a smooth-wall (subscript ‘
 $s$
’) and a rough-wall (subscript ‘
 $r$
’) quantity. For the current cases, the friction Reynolds numbers between the smooth-wall case and the Gaussian case are matched, but there is a small mismatch in the Reynolds numbers of the pits and the peaks cases due to a non-zero mean roughness height
 $\langle h\rangle$
(see table 1). This leads to an additional error term on the left-hand side of (3.1) that is of the order of
 $|\langle h\rangle |/\unicode[STIX]{x1D6FF}$
(see derivation in appendix A). As for the current cases,
 $|\langle h\rangle |/\unicode[STIX]{x1D6FF}\ll 1$
and the corresponding mismatch in
 $Re_{\unicode[STIX]{x1D70F}}$
is less than
 $2\,\%$
. As a result, the error term can be neglected.
An equation for
 $\unicode[STIX]{x0394}U^{+}$
can be derived by integrating the total shear stress difference (3.1) from the height of the highest roughness crest
 $h_{max}^{+}$
to an arbitrary wall-normal position
 $x_{3}^{+}$
to obtain
 $$\begin{eqnarray}\displaystyle \unicode[STIX]{x0394}U^{+}(x_{3}^{+})=\underbrace{\unicode[STIX]{x0394}\langle \overline{u}_{1}^{+}\rangle (h_{max}^{+})}_{\unicode[STIX]{x0394}U_{s}^{+}}+\underbrace{\int _{h_{max}^{+}}^{x_{3}^{+}}-\langle \tilde{u} _{1}^{+}\tilde{u} _{3}^{+}\rangle \,\text{d}x_{3}^{+}}_{\unicode[STIX]{x0394}U_{d}^{+}}+\underbrace{\int _{h_{max}^{+}}^{x_{3}^{+}}\unicode[STIX]{x0394}\langle \overline{u_{1}^{\prime }u_{3}^{\prime }}^{+}\rangle \,\text{d}x_{3}^{+}}_{\unicode[STIX]{x0394}U_{t}^{+}}. & & \displaystyle\end{eqnarray}$$
Note that the subscript ‘
 $r$
’ has been omitted for brevity. The three terms on the right-hand side of the roughness function equation (3.2) have the following interpretation. The first term,
 $\unicode[STIX]{x0394}U_{s}^{+}$
, represents the difference in streamwise velocity at the highest roughness crest. The second term,
 $\unicode[STIX]{x0394}U_{d}^{+}$
, represents the integrated effect of the vertical flux of streamwise dispersive momentum. The third and final term,
 $\unicode[STIX]{x0394}U_{t}^{+}$
, represents the integrated effect of the difference in the vertical flux of streamwise stochastic momentum. MacDonald et al. (Reference MacDonald, Chan, Chung, Hutchins and Ooi2016) derived a similar expression for
 $\unicode[STIX]{x0394}U^{+}$
, although their expression does not separate the DSS and RSS difference contributions.
Below the highest roughness crest
 $(x_{3}^{+}<h_{max}^{+})$
, additional pressure gradient and viscous diffusion terms appear on the right-hand side of the DANS equations and arise because the DA operator (2.7) does not commute with wall-normal spatial differentiation if
 $\unicode[STIX]{x1D713}(x_{3})\neq 1$
. In (3.2), the integrated effect of these additional terms are represented implicitly by the term
 $\unicode[STIX]{x0394}U_{s}^{+}$
. Similar approaches have been adopted by García-Mayoral & Jiménez (Reference García-Mayoral and Jiménez2011) and MacDonald et al. (Reference MacDonald, Chan, Chung, Hutchins and Ooi2016) in order to decompose
 $\unicode[STIX]{x0394}U^{+}$
above riblets and sinusoidal roughness, respectively.
The accuracy of the roughness function equation was verified by comparing the wall-normal variation of
 $\unicode[STIX]{x0394}U^{+}$
from (3.2) against the direct evaluation
 $\unicode[STIX]{x0394}U^{+}=\langle \overline{u}_{1}^{+}\rangle _{s}-\langle \overline{u}_{1}^{+}\rangle _{r}$
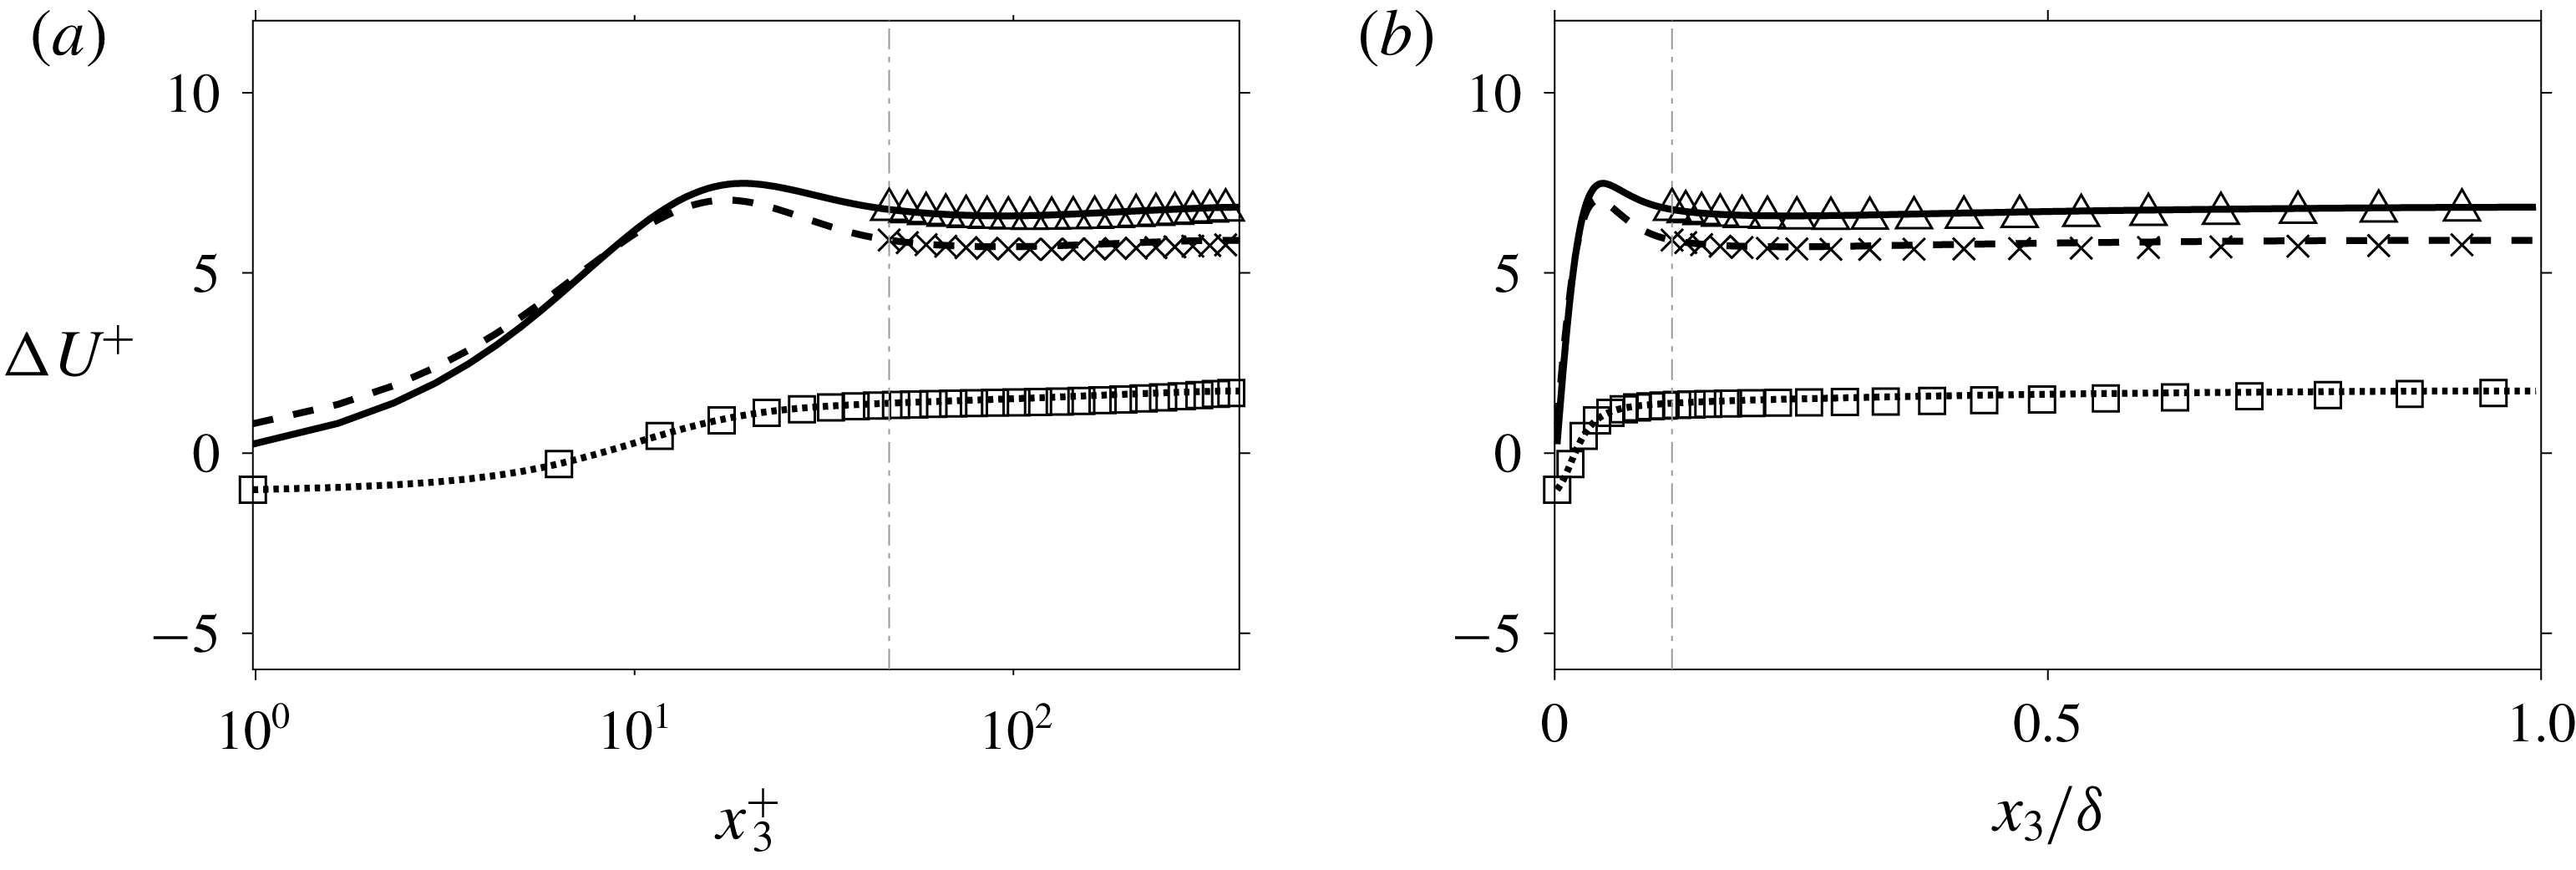
for each surface. As shown in figure 2, close levels of agreement are observed at all wall-normal positions. In addition, figure 2 shows that the momentum deficit remains approximately constant from the highest crest to the channel half-height in the presence of peaks. As a result, the roughness function equation (3.2) reduces to
 $\unicode[STIX]{x0394}U^{+}(\unicode[STIX]{x1D6FF}^{+})\approx \unicode[STIX]{x0394}U_{s}^{+}(h_{max}^{+})$
for the Gaussian and peaks-only surfaces. Such an approximation does not, however, hold above the pits-only surface. Therefore, whilst the drag force due to the roughness peaks directly generates the momentum deficit in the outer layer, the roughness function induced by the pits-only surface arises due to modifications of the near-wall flow. In order to better understand these differing effects, each term on the right-hand side of the roughness function equation (3.2) can be examined. Herein, all references to
 $\unicode[STIX]{x0394}U^{+}$
correspond to the centreline value,
 $\unicode[STIX]{x0394}U^{+}(\unicode[STIX]{x1D6FF}^{+})$
, which agrees well with the downward shift in the log law (see figure 2
a).
Comparison of the roughness function based on the direct evaluation
 $\unicode[STIX]{x0394}U^{+}=\langle \overline{u}_{1}^{+}\rangle _{s}-\langle \overline{u}_{1}^{+}\rangle _{r}$
(plotted as lines) against
 $\unicode[STIX]{x0394}U^{+}$
obtained using the roughness function equation (3.2) (plotted as symbols) for the Gaussian (—, ▵), peaks-only (- - -,
 $\times$
) and pits-only (⋅ ⋅ ⋅ ⋅, ▫) surfaces. The comparison of
 $\unicode[STIX]{x0394}U^{+}$
is shown in both (a) inner and (b) outer scalings. The highest roughness crest of the Gaussian and peaks-only surface is also shown (- ⋅ -).

3.2 Analysis of the roughness function equation
The decomposition of
 $\unicode[STIX]{x0394}U^{+}$
based on (3.2) is shown in figure 3. Positive terms represent a mean momentum loss, whereas negative terms represent a mean momentum gain. Preliminary observations based on figure 3 include the following. (i) The roughness functions of the Gaussian surface
 $(\unicode[STIX]{x0394}U^{+}=6.8)$
and the peaks-only surface
 $(\unicode[STIX]{x0394}U^{+}=5.9)$
are comparable, whereas the pits-only surface yields a far lower value
 $(\unicode[STIX]{x0394}U^{+}=1.7)$
. (ii) The term
 $\unicode[STIX]{x0394}U_{d}^{+}$
is positive for all three surfaces, implying that the integrated effect of DSS always increases the mean momentum deficit. (iii) The sign of the terms
 $\unicode[STIX]{x0394}U_{s}^{+}$
and
 $\unicode[STIX]{x0394}U_{t}^{+}$
is dependent on the roughness topography, implying fundamental differences in the flow structure above the peak- and pit-dominated surfaces. Overall, figure 3 shows that peaks dominate the roughness effect, whereas pits have relatively little influence.
The sharp reduction of
 $\unicode[STIX]{x0394}U^{+}$
above the pits-only surface is a consequence of its negative skewness (table 1), which, compared to positively skewed surfaces, gives a lower
 $\unicode[STIX]{x0394}U^{+}$
across a range of friction Reynolds numbers (Flack et al.
Reference Flack, Schultz, Barros and Kim2016; Busse et al.
Reference Busse, Thakkar and Sandham2017). Other topographical parameters, such as effective slope (
 $ES_{x}$
) are known to scale well with
 $\unicode[STIX]{x0394}U^{+}$
. However, despite sharing a common value of
 $ES_{x}$
(table 1), the roughness functions of the pits- and peaks-only surfaces differ by 72 %. Since
 $ES_{x}$
is, by definition, an absolute quantity, it cannot distinguish the sign of an asymmetric roughness distribution and, as a result, cannot explain the difference in
 $\unicode[STIX]{x0394}U^{+}$
above the peaks- and pits-only surfaces. In this work, differences of
 $\unicode[STIX]{x0394}U^{+}$
will be clarified by examining each term on the right-hand side of the roughness function equation (3.2).
Contributions of terms in the roughness function equation (3.2). Data for Gaussian (▪), peaks-only (▫) and pits-only (


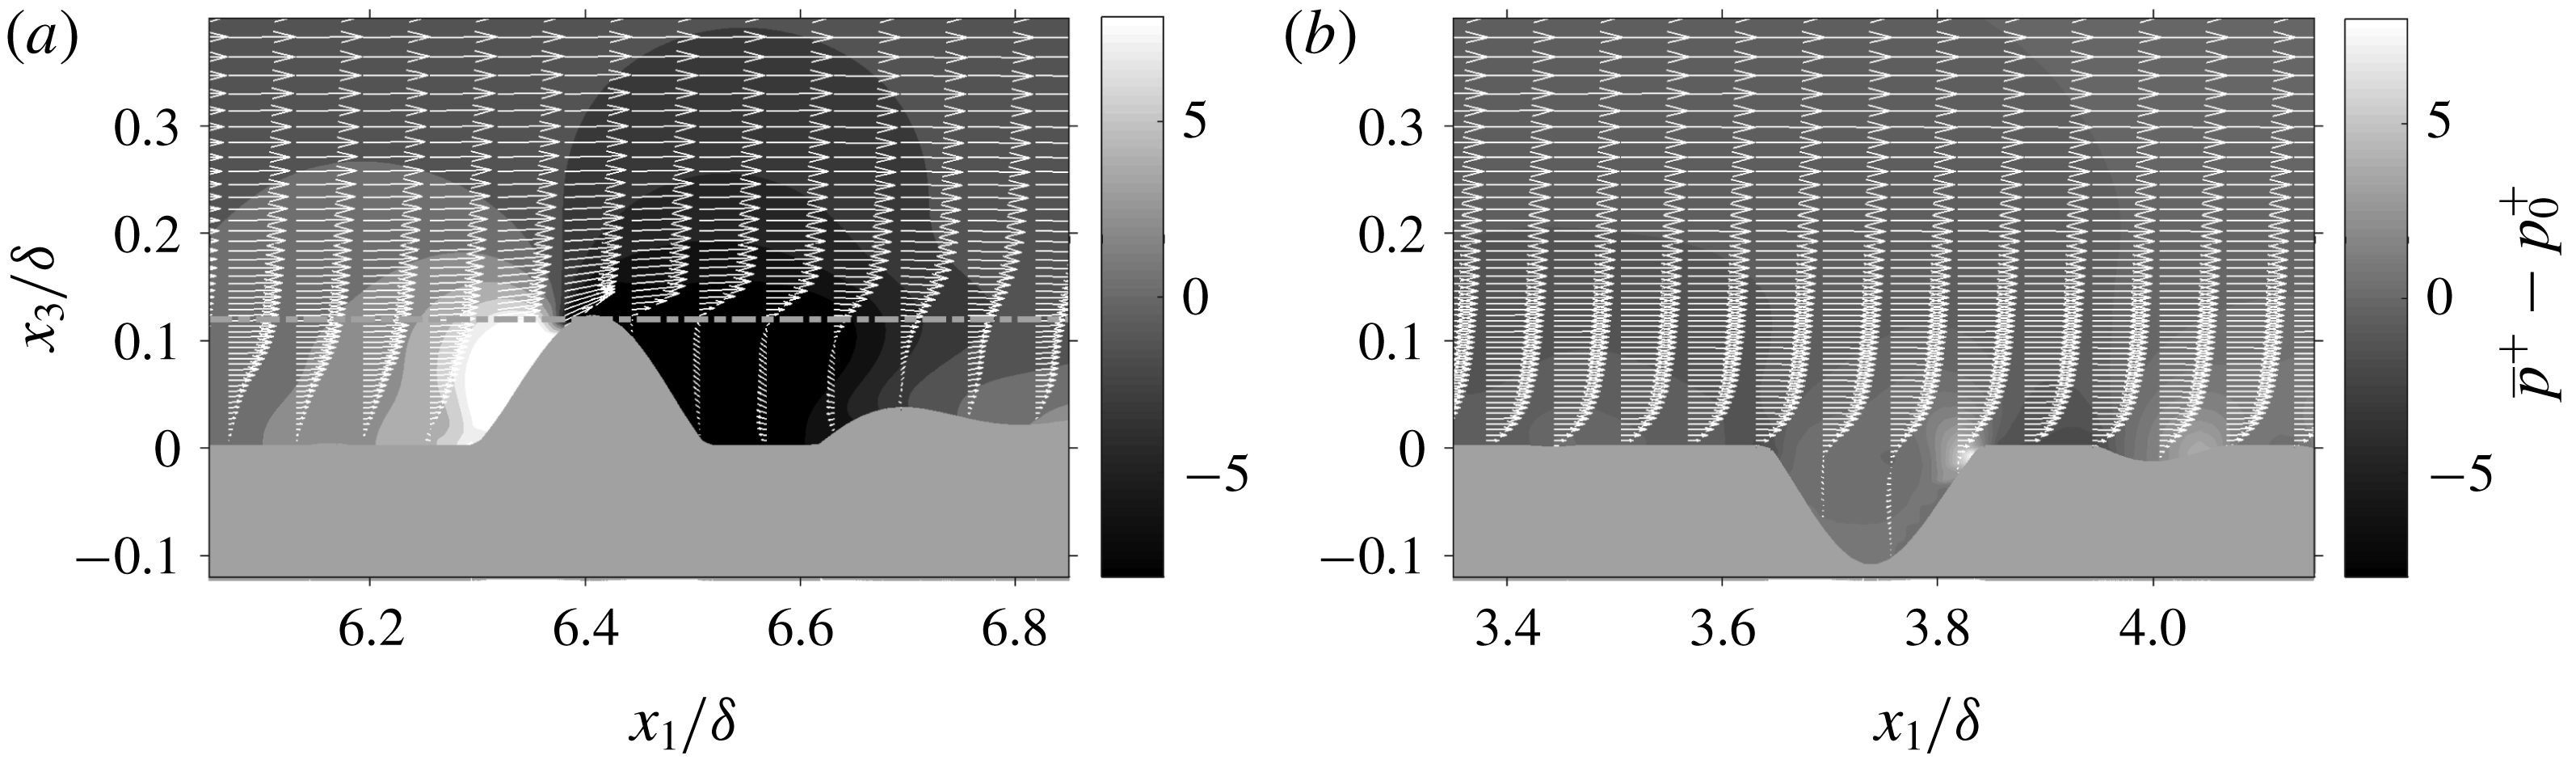
Contours of time-averaged pressure,
 $\overline{p}$
, referenced to the mean pressure on the surface,
 $p_{0}$
. Spanwise slices intersecting (a) the highest crest of the peaks-only surface and (b) the deepest trough of the pits-only surface are shown. Vectors of the in-plane velocities,
 $(\overline{u}_{1},\overline{u}_{3})^{+}$
, and the highest roughness crest of the peaks-only surface (- ⋅ -) are also included.

The first term on the right-hand side of the roughness function equation (3.2) is
 $\unicode[STIX]{x0394}U_{s}^{+}$
and represents the streamwise velocity offset at the highest roughness crest. For both the Gaussian and peaks-only surfaces, terms
 $\unicode[STIX]{x0394}U_{s}^{+}$
and
 $\unicode[STIX]{x0394}U^{+}$
match to within 1 %, whereas above the pits-only surface, they differ both in sign and in magnitude (figure 3). To explain the opposing contributions of
 $\unicode[STIX]{x0394}U_{s}^{+}$
, spanwise slices of the time-averaged pressure field around the highest roughness crest of the peaks-only surface and the deepest roughness trough of the pits-only surfaces can be examined. As shown in figure 4, high-pressure regions occur on the windward slopes of surface peaks and the windward lips of surface pits. Low-pressure regions occur downstream of roughness peaks where the flow separates, then reverses, before reattaching upstream. On the other hand, the flow ‘skims’ past the pits, inducing a reverse flow in the lower part of the cavity.
The mean flow patterns shown in figure 4 are reminiscent of those induced by
 $k$
- and
 $d$
-type transverse square bar roughness. For example, the flow separation downstream of the highest roughness peak (see figure 4
a) resembles a
 $k$
-type scenario (Perry, Schofield & Joubert Reference Perry, Schofield and Joubert1969; Ikeda & Durbin Reference Ikeda and Durbin2007) whereas the flow reversal within the deepest roughness pit (see figure 4
b) is similar to a
 $d$
-type scenario (Leonardi, Orlandi & Antonia Reference Leonardi, Orlandi and Antonia2007). However, considering that the mean flow around transverse square bars is spanwise homogeneous and streamwise phase-dependent, drawing a direct comparison against the time-averaged flow properties of irregular, three-dimensional roughness topographies is not straightforward. Therefore, whilst some qualitative understanding can be drawn from figure 4, a quantitative description of the roughness effect induced by the pits- and peaks-only surfaces will focus on DA quantities that make up the roughness function equation (3.2).
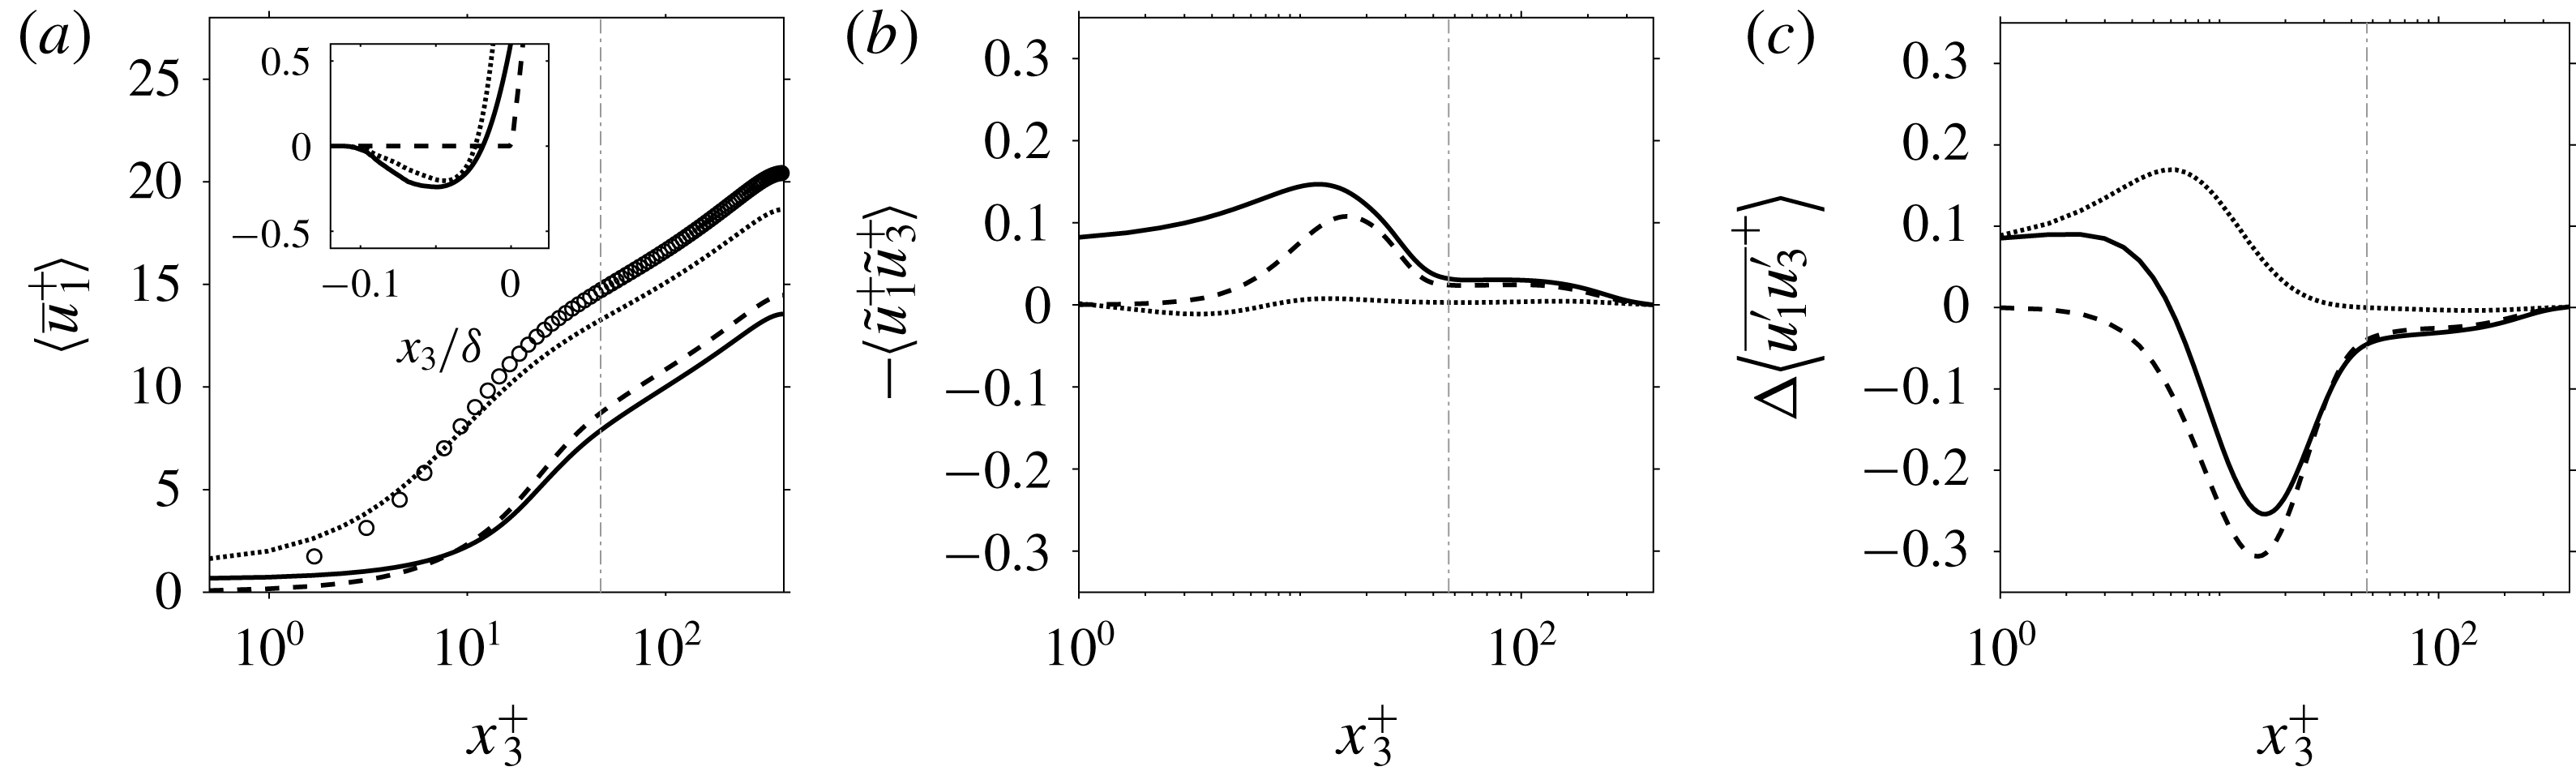
DA profiles of (a) streamwise velocity, (b) DSS and (c) RSS difference above the smooth (○), Gaussian (—), peaks-only (- - -) and pits-only (⋅ ⋅ ⋅ ⋅) surfaces. The highest roughness crest of the Gaussian and peaks-only surface is also shown (- ⋅ -).

The wall-normal variation of DA streamwise velocity above each irregular surface is shown in figure 5(a). A DA reverse flow occurs for the Gaussian and pits-only surfaces at a wall-normal position corresponding to the lower part of the roughness canopy, but is not evident for the peaks-only surface. The magnitude of the reverse flow is of the order of 2 % of the centreline velocity for each surface, which is comparable to past results (Busse et al.
Reference Busse, Thakkar and Sandham2017). At the highest roughness crest of the Gaussian and peaks-only surfaces,
 $\unicode[STIX]{x0394}U_{s}^{+}$
makes a positive contribution to
 $\unicode[STIX]{x0394}U^{+}$
due to the integrated effect of losses within the roughness canopy (figure 4
a). In contrast, for the pits-only surface, the negative contribution of
 $\unicode[STIX]{x0394}U_{s}^{+}$
arises due to the DA effect of ‘skimming’ (figure 4
b), which is manifest as a ‘slip velocity’ in the mean velocity profile. A similar slip effect occurs for regular
 $d$
-type roughness geometries whereby the DA effect of stable cavity vortices would result in a streamwise velocity offset (i.e.
 $\unicode[STIX]{x0394}U_{s}^{+}<0$
) at the highest crest (Jiménez Reference Jiménez2004).
The second term on the right-hand side of the roughness function equation (3.2) is
 $\unicode[STIX]{x0394}U_{d}^{+}$
and represents the integrated effect of ‘form-induced’ momentum transport above the roughness canopy. This term makes a positive contribution to
 $\unicode[STIX]{x0394}U^{+}$
for each surface (figure 3). Relative to the Gaussian surface, the removal of pits and peaks reduce term
 $\unicode[STIX]{x0394}U_{d}^{+}$
by 20 % and 80 %, respectively, implying that roughness pits are an ineffective source of DSS. The wall-normal variation of DSS is plotted in figure 5(b) and confirms weakened ‘form-induced’ shear stress above the pits-only surface. On the other hand, appreciable levels of DSS are induced within the roughness canopy of the Gaussian and peaks-only surfaces, reflecting the high degree of spatial heterogeneity in the time-averaged flow. Above the highest roughness crest, DSS profiles continue to extend deep into the outer flow before decaying to zero at
 $x_{3}/\unicode[STIX]{x1D6FF}\approx 0.75$
. The wall-normal persistence of dispersive stresses has also been noted by Chan et al. (Reference Chan, MacDonald, Chung, Hutchins and Ooi2017). In order to associate particular flow events to
 $\unicode[STIX]{x0394}U_{d}^{+}$
, a quadrant analysis of DSS is performed. Although quadrant analysis is traditionally employed to classify the contributions of flow events to RSS (Wallace, Eckelmann & Brodkey Reference Wallace, Eckelmann and Brodkey1972), it has also been applied to DSS (Pokrajac et al.
Reference Pokrajac, Campbell, Nikora, Manes and McEwan2007). Considering that
 $\unicode[STIX]{x0394}U_{d}^{+}>0$
for each surface (figure 3), then the integrated effect of
 $\tilde{{\mathcal{Q}}}_{2}$
 $(\tilde{u} _{1}<0,\tilde{u} _{3}>0)$
and
 $\tilde{{\mathcal{Q}}}_{4}$
 $(\tilde{u} _{1}>0,\tilde{u} _{3}<0)$
events is expected to outweigh the combined effect of
 $\tilde{{\mathcal{Q}}}_{1}$
 $(\tilde{u} _{1}>0,\tilde{u} _{3}>0)$
and
 $\tilde{{\mathcal{Q}}}_{3}$
 $(\tilde{u} _{1}<0,\tilde{u} _{3}<0)$
.
The quadrant decomposition of DSS can be written as
 $$\begin{eqnarray}\displaystyle \langle \tilde{u} _{1}^{+}\tilde{u} _{3}^{+}\rangle =\mathop{\sum }_{i=1}^{4}\tilde{Q}_{i} & & \displaystyle\end{eqnarray}$$
and is plotted in figure 6. As anticipated,
 $\tilde{{\mathcal{Q}}}_{2}$
and
 $\tilde{{\mathcal{Q}}}_{4}$
events dominate
 $\tilde{{\mathcal{Q}}}_{1}$
and
 $\tilde{{\mathcal{Q}}}_{3}$
for the Gaussian and peaks-only surfaces. At the highest roughness crest,
 $\tilde{{\mathcal{Q}}}_{2}$
and
 $\tilde{{\mathcal{Q}}}_{4}$
events are approximately twice that of
 $\tilde{{\mathcal{Q}}}_{1}$
and
 $\tilde{{\mathcal{Q}}}_{3}$
and, beyond
 $x_{3}/\unicode[STIX]{x1D6FF}>0.25$
, activity in odd-numbered quadrants becomes negligible. In contrast,
 $\tilde{{\mathcal{Q}}}_{2}$
and
 $\tilde{{\mathcal{Q}}}_{4}$
events persist into the outer flow and their respective stress fractions make equal contributions to the local level of DSS. Above the pits-only surface, negligible quadrant activity is observed above
 $x_{3}/\unicode[STIX]{x1D6FF}>0.1$
and, within closer proximity of the pits, increased
 $\tilde{{\mathcal{Q}}}_{1}$
events are countered by a combined rise of
 $\tilde{{\mathcal{Q}}}_{2}$
and
 $\tilde{{\mathcal{Q}}}_{4}$
. However, in a narrow region above the pits
 $(0.002<x_{3}/\unicode[STIX]{x1D6FF}<0.018)$
, odd-numbered activity dominates and, as a result, DSS becomes negative (see inset in figure 6
c). From a modelling perspective, negative DSS may complicate the application of eddy diffusivity techniques to DANS-type simulations (Manes et al.
Reference Manes, Pokrajac, Coceal and McEwan2008). Overall, however, the integral contribution of negative DSS to
 $\unicode[STIX]{x0394}U^{+}$
is small and, as a result, the term
 $\unicode[STIX]{x0394}U_{d}^{+}$
remains positive.
Quadrant analysis of DSS showing
 $\tilde{{\mathcal{Q}}}_{1}$
(⋅ ⋅ ⋅ ⋅),
 $\tilde{{\mathcal{Q}}}_{2}$
(- - -),
 $\tilde{{\mathcal{Q}}}_{3}$
(

 $\tilde{{\mathcal{Q}}}_{4}$
(- - -) for the (a) Gaussian, (b) peaks-only and (c) pits-only surfaces. The sum over all quadrants (—) and the highest roughness crest of the Gaussian and peaks-only surface are also shown (- ⋅ -).

Quadrant analysis of RSS difference including
 $\unicode[STIX]{x0394}{\mathcal{Q}}_{1}^{\prime }$
(⋅ ⋅ ⋅ ⋅),
 $\unicode[STIX]{x0394}{\mathcal{Q}}_{2}^{\prime }$
(- - -),
 $\unicode[STIX]{x0394}{\mathcal{Q}}_{3}^{\prime }$
(

 $\unicode[STIX]{x0394}{\mathcal{Q}}_{4}^{\prime }$
(- - -) for the (a) Gaussian, (b) peaks-only and (c) pits-only surfaces. The sum over all quadrants (—) and the highest roughness crest of the Gaussian and peaks-only surface are also shown (- ⋅ -).

The third and final term on the right-hand side of the roughness function equation (3.2) is
 $\unicode[STIX]{x0394}U_{t}^{+}$
and represents the integrated effect of the RSS difference above the roughness canopy. As shown in figure 3, the negative contribution of
 $\unicode[STIX]{x0394}U_{t}^{+}$
above the Gaussian and peaks-only surfaces indicates that the integrated effect of RSS is weakened, relative to the smooth-wall value, whereas the positive contribution above the pits-only surface indicates the opposite. The wall-normal variation of RSS difference is plotted in figure 5(c). Negligible differences of RSS are observed in the outer flow
 $(x_{3}/\unicode[STIX]{x1D6FF}>0.75)$
, which is in line with Townsend’s outer-layer similarity hypothesis (Townsend Reference Townsend1976). However, as the highest roughness crest of the Gaussian and peaks-only surface is approached, the RSS difference becomes negative. In constrast, above the pits-only surface, the RSS difference is positive below
 $x_{3}/\unicode[STIX]{x1D6FF}<0.1$
. In order to associate particular flow events to
 $\unicode[STIX]{x0394}U_{t}^{+}$
, the RSS difference is also examined using quadrant analysis.
The quadrant decomposition of RSS difference can be written as
 $$\begin{eqnarray}\displaystyle \unicode[STIX]{x0394}\langle \overline{u_{1}^{\prime }u_{3}^{\prime }}^{+}\rangle =\unicode[STIX]{x0394}\mathop{\sum }_{i=1}^{4}Q_{i}^{\prime } & & \displaystyle\end{eqnarray}$$
and is plotted in figure 7. Negative values of
 $\unicode[STIX]{x0394}Q_{i}^{\prime }$
indicate suppressed quadrant activity, relative to smooth-wall levels, and positive values indicate the opposite. For each surface, the magnitudes of
 $\unicode[STIX]{x0394}Q_{1}^{\prime }$
and
 $\unicode[STIX]{x0394}Q_{3}^{\prime }$
are small, compared to those of
 $\unicode[STIX]{x0394}Q_{2}^{\prime }$
and
 $\unicode[STIX]{x0394}Q_{4}^{\prime }$
, indicating the relative sensitivity of sweep and ejection events. However, the peaks and pits influence sweep and ejection events in differing manners. For example, at the highest roughness crest of the Gaussian and peaks-only surface, ejection events are suppressed, which leads to weakened RSS (figure 5
c), which, in turn, makes a negative contribution to
 $\unicode[STIX]{x0394}U^{+}$
through term
 $\unicode[STIX]{x0394}U_{t}^{+}$
(figure 3). Above the pits-only surface, both ejections and sweeps are strengthened, which enhances RSS in the near-wall region (figure 5
c) and, as result, the term
 $\unicode[STIX]{x0394}U_{d}^{+}$
makes a positive contribution to
 $\unicode[STIX]{x0394}U^{+}$
.
4 Discussion
DNS of turbulent channel flow with irregular rough walls were performed at
 $Re_{\unicode[STIX]{x1D70F}}=395$
. Three roughness topographies were considered: (i) a Gaussian surface, (ii) a peaks-only surface and (iii) a pits-only surface (figure 1). Surfaces (i), (ii) and (iii) gave a
 $\unicode[STIX]{x0394}U^{+}$
of 6.8, 5.9 and 1.7, respectively, showing that the main roughness effect of a non-skewed surface is caused by its peaks. Further analysis of results was aided by evaluating an equation for
 $\unicode[STIX]{x0394}U^{+}$
, which quantitatively identified the mechanisms of momentum loss and/or gain.
The roughness function equation (3.2) indicates that
 $\unicode[STIX]{x0394}U^{+}$
can be split into three parts: (i) a velocity offset at the highest roughness crest,
 $\unicode[STIX]{x0394}U_{s}^{+}$
; (ii) the integral effect of form-induced momentum transport,
 $\unicode[STIX]{x0394}U_{d}^{+}$
; and (iii) the integral effect of the difference in turbulence-induced momentum transport,
 $\unicode[STIX]{x0394}U_{t}^{+}$
. In the presence of peaks, the approximation
 $\unicode[STIX]{x0394}U_{}^{+}\approx \unicode[STIX]{x0394}U_{s}^{+}$
is valid and terms
 $\unicode[STIX]{x0394}U_{d}^{+}$
and
 $\unicode[STIX]{x0394}U_{t}^{+}$
have a compensating effect (figure 3). On the other hand, in the absence of peaks, term
 $\unicode[STIX]{x0394}U_{s}^{+}$
becomes negative and this ‘slip-velocity’ effect (figure 5
a) is offset by positive contributions from both
 $\unicode[STIX]{x0394}U_{d}^{+}$
and
 $\unicode[STIX]{x0394}U_{t}^{+}$
. The reduction of
 $\unicode[STIX]{x0394}U^{+}$
above the pits-only surface can be attributed to two main factors: (i) suppression of losses due to a slip-type effect (figure 4) and (ii) weakened ‘form-induced’ shear stress due to the absence of peaks (figures 5
b and 6). However, the reduction of
 $\unicode[STIX]{x0394}U^{+}$
is limited by enhanced Reynolds shear stress, which exceeds smooth-wall levels in the near-wall region (figures 5
c and 7).
Overall, the present study underlines the dependence of the near-wall flow on higher-order topographical parameters, namely skewness. The sensitivity of
 $\unicode[STIX]{x0394}U^{+}$
with respect to skewness has been confirmed in recent experimental campaigns (Flack et al.
Reference Flack, Schultz, Barros and Kim2016) and numerical simulations (Forooghi et al.
Reference Forooghi, Stroh, Magagnato, Jakirlic and Frohnapfel2017). The current study provides a detailed account of the mean-flow mechanisms that determine
 $\unicode[STIX]{x0394}U^{+}$
above a peak-dominated
 $({\mathcal{S}}=1.6)$
and pit-dominated
 $({\mathcal{S}}=-1.6)$
roughness topography. Future work should quantify the Reynolds-number dependence of irregular non-Gaussian roughness with the ultimate goal of incorporating topography effects into RANS-type wall models. To this end, minimal-span rough-wall DNS (MacDonald et al.
Reference MacDonald, Chung, Hutchins, Chan, Ooi and García-Mayoral2017) could be used to achieve fully rough conditions for pit-dominated surfaces, which, relative to their peak-dominated counterpart, exhibit a significantly smaller
 $\unicode[STIX]{x0394}U^{+}$
at the same friction Reynolds number.
Acknowledgements
This work was funded by EPSRC grant EP/P004687/1. Compute time on the ARCHER facility (http://www.archer.ac.uk) via the UK Turbulence Consortium (EPSRC grant EP/L000261/1) and ARCHIE-WeSt High Performance Computer (www.archie-west.ac.uk) (EPSRC grant EP/K000586/1) are gratefully acknowledged. The roughness height maps and the velocity statistics are available in .csv format at http://dx.doi.org/10.5525/gla.researchdata.640.
Appendix A. Effect of mean channel half-height mismatch upon DA momentum difference equations
The friction velocity, viscous length scale and friction Reynolds number for a fully developed smooth-wall turbulent channel flow can be defined as
 $$\begin{eqnarray}\displaystyle u_{\unicode[STIX]{x1D70F},s}\equiv \left(-\frac{\unicode[STIX]{x1D6FF}_{s}}{\unicode[STIX]{x1D70C}}\unicode[STIX]{x1D6F1}\right)^{1/2},\quad \ell _{s}\equiv \frac{\unicode[STIX]{x1D708}}{u_{\unicode[STIX]{x1D70F},s}},\quad Re_{\unicode[STIX]{x1D70F},s}\equiv \frac{\unicode[STIX]{x1D6FF}_{s}u_{\unicode[STIX]{x1D70F},s}}{\unicode[STIX]{x1D708}}, & & \displaystyle\end{eqnarray}$$
where subscript ‘
 $s$
’ denotes a smooth-wall quantity and where
 $\unicode[STIX]{x1D6F1}$
is the constant (negative) mean streamwise pressure gradient. Similar quantities can be defined for a rough-wall turbulent channel flow,
 $$\begin{eqnarray}\displaystyle u_{\unicode[STIX]{x1D70F},r}\equiv \left(-\frac{\unicode[STIX]{x1D6FF}_{r}}{\unicode[STIX]{x1D70C}}\unicode[STIX]{x1D6F1}\right)^{1/2},\quad \ell _{r}\equiv \frac{\unicode[STIX]{x1D708}}{u_{\unicode[STIX]{x1D70F},r}},\quad Re_{\unicode[STIX]{x1D70F},r}\equiv \frac{\unicode[STIX]{x1D6FF}_{r}u_{\unicode[STIX]{x1D70F},r}}{\unicode[STIX]{x1D708}}, & & \displaystyle\end{eqnarray}$$
where subscript ‘
 $r$
’ denotes a rough-wall quantity.
After defining the ratio of the mean roughness height,
 $\langle h\rangle$
, and the smooth-wall channel half-height,
 $\unicode[STIX]{x1D6FF}_{s}$
, as
 $\unicode[STIX]{x1D716}\equiv -\langle h\rangle /\unicode[STIX]{x1D6FF}_{s}$
, equations (A 1) and (A 2) can be combined to obtain
 $$\begin{eqnarray}\displaystyle \unicode[STIX]{x1D6FF}_{r}=(1+\unicode[STIX]{x1D716})\unicode[STIX]{x1D6FF}_{s},\quad u_{\unicode[STIX]{x1D70F},r}=(\sqrt{1+\unicode[STIX]{x1D716}})u_{\unicode[STIX]{x1D70F},s},\quad Re_{\unicode[STIX]{x1D70F},r}=(\sqrt{1+\unicode[STIX]{x1D716}})^{3}Re_{\unicode[STIX]{x1D70F},s},\quad \ell _{r}=\frac{1}{\sqrt{1+\unicode[STIX]{x1D716}}}\ell _{s}. & & \displaystyle \nonumber\\ \displaystyle & & \displaystyle\end{eqnarray}$$
In what follows below, superscript ‘+’ denotes quantities scaled with smooth-wall plus units, i.e. those scaled with
 $\ell _{s}$
and
 $u_{\unicode[STIX]{x1D70F},s}$
(A 1), and superscript ‘
 $\circ$
’ denotes quantities scaled with rough-wall plus units, i.e. those scaled with
 $\ell _{r}$
and
 $u_{\unicode[STIX]{x1D70F},r}$
(A 2). A similar approach has been adopted by MacDonald et al. (Reference MacDonald, Chan, Chung, Hutchins and Ooi2016), although their analysis does not separate the DSS and RSS difference contributions.
The DA streamwise momentum balance equations for a smooth-wall turbulent channel flow and a rough-wall turbulent channel flow evaluated above the highest roughness crest can be written as
 $$\begin{eqnarray}\displaystyle & \displaystyle 0=\frac{1}{\unicode[STIX]{x1D6FF}_{s}^{+}}+\frac{\text{d}}{\text{d}x_{3,s}^{+}}\left(\frac{\text{d}\langle \overline{u}_{1}^{+}\rangle _{s}}{\text{d}x_{3,s}^{+}}-\langle \overline{u_{1}^{\prime }u_{3}^{\prime }}^{+}\rangle _{s}\right), & \displaystyle\end{eqnarray}$$
 $$\begin{eqnarray}\displaystyle & \displaystyle 0=\frac{1}{\unicode[STIX]{x1D6FF}_{r}^{\circ }}+\frac{\text{d}}{\text{d}x_{3,r}^{\circ }}\left(\frac{\text{d}\langle \overline{u}_{1}^{\circ }\rangle _{r}}{\text{d}x_{3,r}^{\circ }}-\langle \overline{u_{1}^{\prime }u_{3}^{\prime }}^{\circ }\rangle _{r}-\langle \tilde{u} _{1}^{\circ }\tilde{u} _{3}^{\circ }\rangle _{r}\right), & \displaystyle\end{eqnarray}$$
where the following relationships have been used:
 $$\begin{eqnarray}\displaystyle \frac{1}{\unicode[STIX]{x1D6FF}_{s}^{+}}=\frac{\ell _{s}}{\unicode[STIX]{x1D6FF}_{s}}=\frac{1}{Re_{\unicode[STIX]{x1D70F},s}},\quad \frac{1}{\unicode[STIX]{x1D6FF}_{r}^{\circ }}=\frac{\ell _{r}}{\unicode[STIX]{x1D6FF}_{r}}=\frac{1}{Re_{\unicode[STIX]{x1D70F},r}}. & & \displaystyle\end{eqnarray}$$
The momentum balance equations (A 4) and (A 5) can be integrated from an arbitrary wall-normal position to their respective mean channel half-heights to obtain
 $$\begin{eqnarray}\displaystyle & \displaystyle 1-\frac{x_{3,s}^{+}}{\unicode[STIX]{x1D6FF}_{s}^{+}}=\frac{\text{d}\langle \overline{u}_{1}^{+}\rangle _{s}}{\text{d}x_{3,s}^{+}}-\langle \overline{u_{1}^{\prime }u_{3}^{\prime }}^{+}\rangle _{s}, & \displaystyle\end{eqnarray}$$
 $$\begin{eqnarray}\displaystyle & \displaystyle 1-\frac{x_{3,r}^{\circ }}{\unicode[STIX]{x1D6FF}_{r}^{\circ }}=\frac{\text{d}\langle \overline{u}_{1}^{\circ }\rangle _{r}}{\text{d}x_{3,r}^{\circ }}-\langle \overline{u_{1}^{\prime }u_{3}^{\prime }}^{\circ }\rangle _{r}-\langle \tilde{u} _{1}^{\circ }\tilde{u} _{3}^{\circ }\rangle _{r}. & \displaystyle\end{eqnarray}$$
After some manipulation, equations (A 1) and (A 2) can be used to recast (A 8) into ‘+’ units
 $$\begin{eqnarray}\displaystyle 1-\frac{x_{3,r}^{+}}{\unicode[STIX]{x1D6FF}_{s}^{+}}\left(\frac{\unicode[STIX]{x1D6FF}_{s}}{\unicode[STIX]{x1D6FF}_{r}}\right)=\frac{\text{d}\langle \overline{u}_{1}^{+}\rangle _{r}}{\text{d}x_{3,r}^{+}}\left(\frac{u_{\unicode[STIX]{x1D70F},s}}{u_{\unicode[STIX]{x1D70F},r}}\right)\left(\frac{\ell _{r}}{\ell _{s}}\right)-\langle \overline{u_{1}^{\prime }u_{3}^{\prime }}^{+}\rangle _{r}\left(\frac{u_{\unicode[STIX]{x1D70F},s}}{u_{\unicode[STIX]{x1D70F},r}}\right)^{2}-\langle \tilde{u} _{1}^{+}\tilde{u} _{3}^{+}\rangle _{r}\left(\frac{u_{\unicode[STIX]{x1D70F},s}}{u_{\unicode[STIX]{x1D70F},r}}\right)^{2}, & & \displaystyle \nonumber\\ \displaystyle & & \displaystyle\end{eqnarray}$$
which can be simplified using (A 3) to obtain
 $$\begin{eqnarray}\displaystyle (1-\unicode[STIX]{x1D716})-\frac{x_{3,r}^{+}}{\unicode[STIX]{x1D6FF}_{s}^{+}}=\frac{\text{d}\langle \overline{u}_{1}^{+}\rangle _{r}}{\text{d}x_{3,r}^{+}}-\langle \overline{u_{1}^{\prime }u_{3}^{\prime }}^{+}\rangle _{r}-\langle \tilde{u} _{1}^{+}\tilde{u} _{3}^{+}\rangle _{r}. & & \displaystyle\end{eqnarray}$$
We evaluate the difference between the viscous-scaled smooth- and rough-wall cases at equal wall-normal positions, i.e.
 $x_{3,s}^{+}=x_{3,r}^{+}=x_{3}^{+}$
, by subtracting (A 10) from (A 7) in order to obtain the momentum balance difference equation
 $$\begin{eqnarray}\displaystyle \unicode[STIX]{x1D716}=\unicode[STIX]{x0394}\frac{\text{d}\langle \overline{u}_{1}^{+}\rangle }{\text{d}x_{3}^{+}}+\langle \tilde{u} _{1}^{+}\tilde{u} _{3}^{+}\rangle -\unicode[STIX]{x0394}\langle \overline{u_{1}^{\prime }u_{3}^{\prime }}^{+}\rangle , & & \displaystyle\end{eqnarray}$$
where the left-hand side term shows the effect of a mean channel half-height mismatch. If
 $\langle h\rangle \neq 0$
, then there is an imbalance. However, if
 $|\langle h\rangle |\ll \unicode[STIX]{x1D6FF}_{s}$
, then the imbalance can be considered negligible. With reference to table 1, the Gaussian surface has a mean roughness height equal to zero
 $(\langle h\rangle /\unicode[STIX]{x1D6FF}=0)$
and, as a result,
 $\unicode[STIX]{x1D716}=0$
. On the other hand, the mean roughness heights of the peaks-only surface
 $(\langle h\rangle /\unicode[STIX]{x1D6FF}=0.01)$
and the pits-only surfaces
 $(\langle h\rangle /\unicode[STIX]{x1D6FF}=-0.01)$
are non-zero and therefore
 $\unicode[STIX]{x1D716}\neq 0$
. However, since
 $|\langle h\rangle |/\unicode[STIX]{x1D6FF}\approx 0.01$
for both the pits- and peaks-only surfaces, the friction Reynolds numbers for these cases agree to within less than 2 % of the Gaussian and smooth-wall cases. Therefore, the friction Reynolds numbers of all cases in this study are so close that the effects of mean channel half-height mismatch and the error term
 $\unicode[STIX]{x1D716}$
in (A 11) can be neglected.