Implications
The implications of this review are for animal scientists, the animal feed industry, livestock farmers, environmental analysts and policy-makers. Efficiency of conversion of animal feeds into animal products may be increased by applying existing knowledge and by innovation. The northern European climate is conducive to the production of grass and forage crops, which should be grown, harvested and preserved as efficiently as possible and used fully in diets to match animal requirements. Europe also has a large human food processing industry and an emerging bio-ethanol industry. The use of the by-products from these industries should be increased, which means knowing their nutritional characteristics so that their potential as sources of energy and essential nutrients in livestock diets can be fulfilled. The challenge to animal scientists and the animal feed industry is to improve efficiency of resource use by matching available feeds to animal requirements and at the same time reduce reliance on human-edible feeds.
Introduction
Domesticated livestock convert crops and crop products into useful and desirable human foods of high-nutritional value. However, many livestock diets include raw materials such as cereal grains, which could be eaten directly by humans. This leads to debate about the competition between livestock and humans for land and other resources needed to grow crops. Traditionally, pigs and poultry scavenged on land adjacent to human habitations and were given waste human foods and other materials to supplement their diets. In China, for example, integrated systems of livestock production developed in which pig or poultry houses were constructed adjacent to or above ponds used for the rearing of ducks and fish. Excreta from the pig and poultry houses supported the growth of pond vegetation, which was consumed by the ducks and fish (Huazhu and Baotong, Reference Huazhu and Baotong1989).
Livestock are often reared intensively in large units. In the drive to increase efficiency of feed use, concentrate (i.e. high-nutrient density) diets have been developed, which comprise predominantly cereal grain crops and the meal residues from the removal of oil from oilseed crops, particularly soyabean meal. A high proportion of these crops are either consumed as human food or used to produce soaps, cosmetics and paints (e.g. palm oil and linseed oil). There are environmental issues associated with the production of oilseed crops such as soyabeans, which are causing international concern. These issues have been discussed elsewhere (e.g. Garnett, Reference Garnett2009) and are not considered here.
The most common expression of efficiency of feed use, particularly in non-ruminant livestock systems, is the feed conversion ratio (FCR, kilogram concentrate fresh weight per kilogram live weight gain or product fresh weight). The use of cereal grains by animals is causing concern, particularly in the context of a growing human population. The UK Cabinet Office commented that the production of 1 kg of beef ‘is said to require 7 to 10 kg of grain’ (Cabinet Office, 2008). Godfray et al. (Reference Godfray, Beddington, Crute, Haddad, Lawrence, Muir, Pretty, Robinson, Thomas and Toulmin2010) stated that the ‘feed required to produce 1 kg of meat’ was 8, 4 and 1 ‘kilogram cereal per animal’ for cattle, pigs and broiler chickens, respectively. Such comparisons are gross over-simplifications and fail to take account of the extent to which different livestock systems have been developed to utilise land and feed resources that are not edible by the human population. Galloway et al. (Reference Galloway, Burke, Bradford, Naylor, Falcon, Chapagain, Gaskell, McCullough, Mooney, Oleson, Steinfeld, Wassenaar and Smil2007) calculated that globally the conversion ratio of ‘total feed to meat’ was 20 : 1 and 3.8 : 1 for ruminants and non-ruminants, respectively. However, deducting feed inputs from ‘crop residues’ and ‘non-arable forage’, the conversion of ‘feeds from arable land to meat’ was 3 : 1 and 3.4 : 1 for ruminants and non-ruminants, respectively. In other words, ruminants were more efficient than non-ruminants in terms of converting animal feed crops grown on arable land into meat.
The ability of livestock to turn feed resources such as grassland and by-products from the human food industry into edible animal food of high biological value is likely to become of greater significance in terms of global human food production as the population of the planet increases in future decades. The topic of animal agriculture and global food supply was considered in detail by a task force of the Council for Agricultural Science and Technology (CAST; Bradford, Reference Bradford1999; CAST, 1999). The task force concluded that the very low conversion rates that have been quoted in some assessments of efficiency of resource use by livestock ignore the forage and by-products consumed and are often extrapolations from the final finishing phase of beef cattle in feedlots. Thus, they substantially underestimate the actual efficiency of use of human-edible feeds. The task force noted that conversion rates of grain to meat, milk and eggs had improved significantly in both developed and developing countries, and that applying known technologies to a larger proportion of the world's animal populations offered the potential for substantial improvements in efficiency. Godfray et al. (Reference Godfray, Beddington, Crute, Haddad, Lawrence, Muir, Pretty, Robinson, Thomas and Toulmin2010) concluded that although production and efficiency of use can be increased in response to increased consumer demand, maximising crop productivity was too simplistic a goal and that optimisation of land use across a more complex matrix of production, environmental and cultural factors was a more appropriate strategy to pursue.
In this paper, the use of crops and crop by-products by domestic livestock are explored with the aim of developing alternative approaches to assessing efficiency, which could be used to drive the evolution of livestock systems that are more compatible with increasing human populations. Estimates are made of the proportion of crops and crop by-products that are potentially edible as human foods. The conversion ratios with which different species of livestock produce edible meat, milk and eggs are compared using example livestock systems in the United Kingdom.
Material and methods
Terminology
Cereal grains and pulses used in diets for animals, but potentially edible by humans, are termed ‘edible feeds’ in this paper. Various by-products are produced from the processing of crops for human foods and drinks such as wheatfeed (flour milling residues), brewers’ and distillers’ grains and sugar beet pulp. Pulse crops such as peas and beans are also grown for their seed. Oilseed meal (e.g. from soyabeans or rapeseed) is the portion of the seed that remains after removal of oil. Thus, some cereals and oilseeds have dual functions in that the primary product is for human use, for example, oil for food, ethanol for the drinks industry or bio-fuels, but a significant proportion of the processed crop is a by-product which is used for animal feed.
Concentrates are mixtures of raw material animal feeds and are normally higher in their concentrations of energy and protein than forage crops. Forage crops are plants harvested by grazing or by mechanical means for conservation as silage, as hay, or after high-temperature dehydration.
Animal product output may be measured as liquid whole milk yield, average daily live weight gain of growing animals, fresh bone-in carcase weight, egg mass, edible energy or edible protein. In the case of edible meat and eggs, the weight of bone and shell is deducted from the total weight of carcase and egg.
Energy is defined in this paper as metabolisable energy (ME) and protein is defined as crude protein (CP) in the dry matter (DM). Feed input may be measured as intake of total DM, ME, CP, edible energy or edible protein. In meat production, the feed input is the total quantity of feed consumed by the growing animal from birth to slaughter. In addition, in beef, lamb and pig meat production (and to an extremely small extent in poultry production, not considered in this paper) the growing animal carries the ‘overhead’ cost of the feed consumed by its mother. Beef from calves born in dairy herds is considered as a by-product of milk production; the dam's feed inputs are debited totally to the dairy cow and not to the calf.
Feed use by the UK livestock
Grassland occupied 12.7 million hectares or 0.68 of the 18.7 million hectares of agricultural land of the United Kingdom from 2008 to 2009 (Department for Environment, Food and Rural Affairs (DEFRA), 2009a). Most of this land was lowland and upland permanent pasture >5 years old (6.0 million hectares) and rough grazing (5.6 million hectares), a high proportion of which was in areas of outstanding natural beauty. A small proportion (1.1 million hectares) was temporary grass <5 years old and mainly in rotation with arable crops (DEFRA, 2009a).
Estimated quantities of grazed pasture and conserved forages consumed by livestock in the United Kingdom are in Table 1 together with typical values for their concentrations of DM, ME and CP. The total quantity of grazed pasture was estimated from quantities of grazed pasture DM consumed per head (Williams et al., Reference Williams, Audsley and Sandars2006) multiplied by the average number of cattle and sheep in the United Kingdom in 2008 (DEFRA, 2009a). Grazed pasture DM accounted for 0.69 of the total forage DM estimated to be used by cattle and sheep in the United Kingdom from 2008 to 2009.
Estimated quantities of grazed pasture, grass silage, maize silage and hay DM used by UK livestock from 2008 to 2009

DM = dry matter; ME = metabolisable energy.
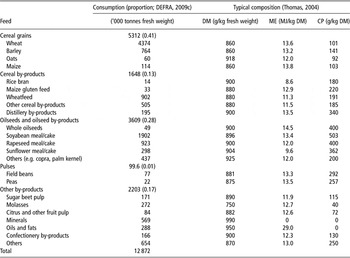
Estimated quantities of raw material fresh weight used in the animal feed industry from 2008 to 2009 are in Table 2 together with typical values for DM, ME and CP. Cereals comprised about 0.48 of total concentrate raw material consumption. Cereal by-products comprised 0.24 of total cereals (grains + by-products).
Raw materials used for animal feeds1 from 2008 to 2009 and typical values for DM, ME and CP

DM = dry matter; ME = metabolisable energy.
1The DEFRA statistics are for Great Britain and include author's estimates for integrated poultry units.
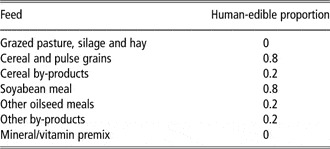
Estimated human-edible (‘edible’) proportions of different crops and crop products are in Table 3. For the purpose of this paper, the average proportion of cereal and pulse grains (including soyabeans), which are potentially edible by humans was assumed to be 0.8. This proportion is most likely over-optimistic for cereal grains for two reasons. First, the total quantity of bread wheat entering a flour mill, which is available for sale as flour, depends on the proportions of white (0.70 to 0.75 of whole wheat extraction as flour) to brown (0.85 extraction) to wholemeal (1.0 extraction) flour produced in the mill (Jones, Reference Jones1958; Valuation Office Agency, 2009). Second, of the total quantity of barley used in the United Kingdom in 2008, 0.36 was for brewing and distilling and 0.60 was used as animal feed (DEFRA, 2009a). Nevertheless, bread-making cultivars of cereals could potentially be grown on much of the land used currently for the production of cereal grains if the specification of bread flours were to be changed to accommodate the composition of the grain.
Estimated edible proportions of some crops and by-products (based on Council for Agricultural Science and Technology, 1999)

It is estimated that 0.2 of cereal by-products is used for human consumption (Table 3). Cereal by-products comprise bran, wheatfeed (the pelleted waste products of flour milling), wheat gluten feed and maize gluten feed (from the extraction of starch from grain) and brewers’ and distillers’ grains. The proportions of soyabean and other oilseed meals estimated to be human-edible are 0.8 and 0.2, respectively (Table 3). The maize hybrids grown for silage are different to those grown for sweet corn and no part of the plant is considered suitable for human consumption.
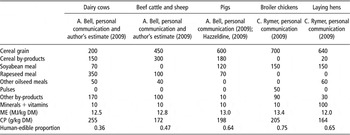
Typical formulations of concentrate feeds used in different UK livestock systems are shown in Table 4. There is a variability in the mix of ingredients, both between and within livestock sectors as compounds, blends and meals are usually formulated to meet target concentrations of ME and CP on a least-cost basis, with constraints applied according to the need to balance the diet for specific ingredients such as amino acids and minerals. Thus, it is difficult to be precise about the formulation for particular systems because changes in prices of ingredients affect their levels of inclusion; when the price of wheat is relatively high there is pressure to replace it with cereal by-products and other by-products and vice versa. The data in Table 4 were derived in consultation with sources in the UK animal feed industry and should be viewed as a general indication of the specifications, that is, the concentrations of ME and CP, and the formulations used for different classes of livestock in the United Kingdom.
Composition (g/kg DM) of some example concentrate feeds

DM = dry matter; ME = metabolisable energy.
Ingredients of the concentrate formulations included wheat, barley, wheatfeed, sugar beet pulp, rapeseed meal, palm kernel meal, biscuit meal and molasses, reflecting the availability and price of a wide range of animal feeds in the United Kingdom. Soyabean meal was included in the formulations for dairy cows, pigs and poultry, but not in the case of beef cattle and sheep. The proportion of cereal grain was lowest for dairy cows and highest for laying hens. These differences were reflected in the proportions of the concentrates estimated to be edible, which ranged from 0.36 for dairy cows to 0.75 for broiler chickens.
Example systems of UK livestock production
The management of livestock varies between farms and it is difficult to define an average system. In the case of beef and sheep, there is a wide range of systems according to topography (e.g. upland and lowland sheep), season of birth (e.g. autumn-calving and spring-calving beef cows) and type of diet (e.g. grass or concentrates). Nevertheless, identification of broad system groupings is useful in order to understand opportunities for increasing efficiency. Four systems of beef production are described in this paper to represent the major types of beef production in the United Kingdom: upland and lowland beef from the beef herd (suckler beef) and beef produced from calves born in the dairy herd reared either on grass-based diets (18- to 20-month beef) or on cereal-based diets (‘cereal’ beef).
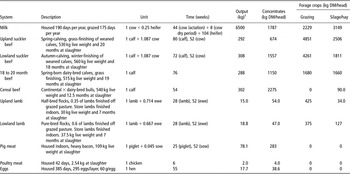
Some example systems of UK livestock production are described in Table 5 in terms of the life cycle of the production of the animal product, the quantity of output and inputs of concentrate and forage DM. The data were drawn from life-cycle analyses which involved modelling the structure of the UK livestock industry (Williams et al., Reference Williams, Audsley and Sandars2006). The unit of assessment was one breeding female cow (milk) and the proportion of the overhead feed input to the replacement heifer, one calf (beef from calves born in the dairy herd), one beef calf or lamb and the proportion of the overhead feed input to the suckler cow or ewe, one bacon pig and the proportion of the overhead feed input to the sow, one chicken and one laying hen.
Example systems of UK livestock production: output per head and inputs of concentrates and forage crops (based on Williams et al., Reference Williams, Audsley and Sandars2006)

DM = dry matter.
1Whole milk, bone-in carcase or whole egg + shell.
Life cycles of the example systems (Table 5) ranged from 6 weeks for broiler chickens to 80 weeks for grass-finished spring-born upland suckler beef calves. Output of liquid whole milk from the milk production system was 6.5 tonnes per cow per year. Meat output per life cycle as bone-in carcase ranged from 2 kg per head for poultry meat to 308 kg per head for lowland suckler beef production. Output of egg mass by laying hens was 18 kg per head. Outputs of animal by-products such as the meat from culled breeding females and laying hens, leather, wool and abattoir by-products were not included in the calculations because they were not the primary edible products of the systems. It is recognized, however, that meat from culled cows is a significant by-product of milk and beef production.
Total forage crop inputs (grazing plus silage and/or hay) to the ruminant systems ranged from 90 kg DM per head for cereal beef to >7 tonnes DM per head (cow plus calf) for upland suckler beef production (Table 5). Total concentrate inputs (composition as in Table 4) ranged from 4 kg DM/head for poultry meat production to 2.3 tonnes DM/head for cereal beef production. It is notable that concentrates featured in all the ruminant systems because they are used (i) in the pre-ruminant phase of the rearing period of calves born in dairy herds, (ii) to increase the energy and protein concentration of conserved forages in the winter feeding period and (iii) to rectify temporary deficits in the supply of grazed pasture due to extreme cold or hot weather.
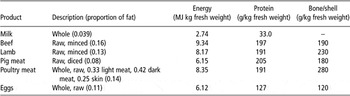
Concentrations of edible energy and protein in whole milk, carcase meat and eggs are in Table 6. The values in Table 6 were then applied to the outputs of animal products in Table 5 to calculate outputs of edible energy and protein from the different systems.

Results and discussion
FCR
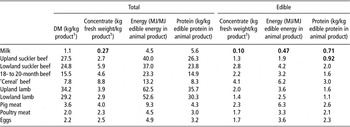
Total feed and concentrate FCR for each example system (Table 5), assuming the composition of the concentrates in Table 4, are in Table 7. A higher value of FCR indicates a lower efficiency of conversion of feed into animal product. FCR for all feed DM was lowest for milk (1.1) and for the meat systems FCR ranged from 2.0 for poultry meat to 34.2 for upland lamb. The average for the suckled beef and lamb systems (29 kg feed DM/kg product) was higher than the global average value for ruminants of 20 quoted by Galloway et al. (Reference Galloway, Burke, Bradford, Naylor, Falcon, Chapagain, Gaskell, McCullough, Mooney, Oleson, Steinfeld, Wassenaar and Smil2007) and may have reflected the relatively high proportion of grass used in the production of suckled beef and lamb in the United Kingdom compared with other regions of the world. The average value for non-ruminant meat production (2.8) was lower than the comparable global value of 3.8 for non-ruminant meat production of Galloway et al. (Reference Galloway, Burke, Bradford, Naylor, Falcon, Chapagain, Gaskell, McCullough, Mooney, Oleson, Steinfeld, Wassenaar and Smil2007) and may have reflected a higher than average level of technical efficiency in the United Kingdom compared with other countries.
Total and edible FCR (input per unit of output)

FCR = feed conversion ratios.
1Whole milk, bone-in carcase fresh weight or egg + shell.
Concentrate fresh weight FCR for meat production (Table 7) ranged from 2.3 for poultry meat to 8.8 kg/kg product for cereal beef, and were slightly greater than those of Garnett (Reference Garnett2009), who quoted FCR, defined in terms of kilogram of ‘cereals’ per kilogram ‘animal weight’, of 1.7 and 2.4 for chickens and pigs, respectively and from 5 to 10 for ‘cattle’. Garnett (Reference Garnett2009) stated that it took approximately four times as much weight of ‘cereals’ to produce a kilogram of ‘animal weight’ for ‘cattle’ as for non-ruminant livestock. It is evident that this statement is only correct for cereal beef production (and then only when compared with poultry meat and only if ‘cereals’ are the sole components of the concentrate), which was also the least efficient system in terms of edible feed conversion. However, the cereal beef system is largely confined to male beef crossbred calves born to dairy cows and heifers. This type of beef accounted for only 0.06 of the total beef produced in the United Kingdom in 2009 (D. Pullar, personal communication, 2009). It is notable that apart from cereal and lowland suckler beef, concentrate FCR were broadly similar between ruminant and non-ruminant meat production (Table 7), in agreement with Galloway et al. (Reference Galloway, Burke, Bradford, Naylor, Falcon, Chapagain, Gaskell, McCullough, Mooney, Oleson, Steinfeld, Wassenaar and Smil2007).
The proportion of cereal grain and other edible feeds in the concentrate formulation (Table 4) has a substantial effect on the edible concentrate FCR – the lower the proportion of cereal grain and pulses in the mix, the lower the edible FCR. Edible concentrate FCR in Table 7 ranged from 0.1 for milk to 4.1 for cereal beef, reflecting the proportions of edible constituents (Table 4) and, in the case of the ruminant systems, the total input of concentrate relative to forage. It is notable that only the milk system had concentrate FCR <1.0, that is, the output of liquid milk exceeded the concentrate input. This is hardly surprising because milk contains only 124 g DM per kg fresh weight (Food Standards Agency, 2002). A more equitable basis for comparisons of milk and meat are per unit of energy and protein in the edible product where differences in edible FCR between milk and non-ruminant meat production are relatively small (Table 7).
In contrast, life-cycle analysis of UK salmon farming revealed a total FCR of 1.4 kg feed fresh weight/kg salmon for a diet, which contained 0.67 fish-derived meals and oils and 0.33 crop-derived ingredients (Pelletier et al., Reference Pelletier, Tyedmers, Sonesson, Scholz, Ziegler, Flysjo, Kruse, Cancino and Silverman2009). Feed conversion is more efficient for salmon than for meat production from domestic livestock because salmon, being poikilotherms, do not need to divert a significant proportion of feed energy to maintain body temperature as is the case with homeotherm domestic mammals and poultry. Applying edible proportions of crops and crop products in Table 3 to the average UK salmon diet gave an estimated edible proportion of 0.36 and an edible FCR of 0.48 kg feed/kg product.
Total feed protein conversion ratios were generally greater than for total DM conversion, implying that dietary protein is used relatively inefficiently to produce edible animal protein in milk, meat and eggs. Thus, the conversion ratio for protein in milk production, of 5.6 kg feed protein/kg milk protein, is some five times greater than the conversion ratio for total feed DM. The ratios for protein conversion in ruminant meat production were much greater than for milk or the non-ruminant systems, indicating a very low overall efficiency of nitrogen use in ruminant systems. Inefficiencies in the conversion of feed protein into edible animal protein present a major challenge to livestock nutritionists, as excretion by the animal of excess dietary protein is not only a source of diffuse pollution as nitrate and ammonia, but is also a potential source of greenhouse gas emissions as nitrous oxide.
The total energy and protein conversion ratios in Table 7 are in broad agreement with those of CAST (1999) for the USA, which gave values for total energy of 4.0 for milk, 14.3 for beef, 4.8 for pigs and 5.3 for poultry meat. Corresponding edible energy conversion ratios were 0.93, 1.5, 3.2 and 3.6 for milk, beef, pigs and poultry, respectively (CAST, 1999). The lower edible energy ratio for UK milk (0.47) probably reflects the relatively lower proportion of grain in UK dairy concentrate compared with the USA. Pelletier et al. (Reference Pelletier, Pirog and Rasmussen2010) found that that edible energy conversion ratio of a pasture-finishing beef production system in the USA was 1.4; a value very similar to that found by CAST (1999), but somewhat lower than the value of 1.9 in Table 7 for the upland suckler beef system, reflecting a lower input of human-edible feed (wheat grain) in the US system compared with the UK system.
It is notable that on an edible feed conversion basis spring-calving/grass finishing upland suckler beef and lowland lamb production were more efficient than pig and poultry meat production (Table 7). Edible protein conversion ratios in the CAST report were 0.48, 0.84, 3.4 and 1.6 for milk, beef, pigs and poultry (CAST, 1999) and were generally similar to those in Table 7.
Despite the significant roles of grassland and crop by-products in the nutrition of UK livestock, with the exception of milk and upland suckler beef production, conversion ratios of edible feed protein into animal protein were >1.0, that is, more edible protein was consumed than produced.
Improving edible FCR
The target for edible feed conversion is that a livestock system should produce more edible energy or edible protein than it consumes as feed; that is, the FCR should be 1.0 or lower. Clearly, few FCRs in the above analysis are <1.0 (values in bold in Table 7) and some, such as lamb and suckler beef production are much less efficient than other livestock systems in which the breeding female is either a minor overhead cost in the life cycle (e.g. poultry meat) or is the major productive unit herself (e.g. milk and eggs).
What changes in diet are necessary to achieve values for edible protein FCR of <1 so that more edible animal protein is produced than is consumed as edible feeds? The obvious option is to re-formulate the concentrate to reduce cereal grain and soyabean meal, both of which have a high-edible proportion (Table 3). A further option for the ruminant meat systems is to substitute concentrate by high-quality forage.
The example concentrates in Table 4 were therefore re-formulated by replacing cereal grain and soyabean meal with cereal by-products and other by-product feeds as much as possible, while maintaining similar concentrations of ME and CP, with the objective of reducing edible FCR so that it did not exceed 1.0 at fixed total feed input and product output. The milk system already had FCR of <1 (Table 7) so the diet was not changed. With the exception of the poultry diets, cereal grain and soyabean meal were replaced entirely by cereal by-products and other animal feeds. The poultry meat diet was re-formulated to comprise (g/kg fresh weight): 350 cereal grain, 520 cereal by-products, 50 soyabean meal, 70 other by-products and 10 mineral/vitamin premix. The layer diet was re-formulated to contain (g/kg fresh weight) 280 grain, 520 cereal by-products, 70 other oilseed meals, 30 other by-products and 10 mineral/vitamin premix. With the exception of the lowland suckler beef system in which it was necessary to replace 357 kg of concentrate DM with grass silage DM to reduce further the total amount of edible feed consumed, total concentrate input remained constant. The re-formulations did not take account of the possibility that the amino acid profiles of the new diets would be different and might not support the same daily weight gain, nor did they take account of the possibility that limited supplies of by-products might make the diets impractical or uneconomical.
Replacing cereal grain with cereal by-products produced values for edible protein FCR of 1.0 for all systems except cereal beef, where the FCR was 1.73. A further feature of the cereal beef diet was that because the cereal by-products had higher concentrations of CP than grain (Table 2), total input of protein was increased even though the proportion of edible feeds was decreased. The only alternative would be to replace concentrate by high-energy, low-protein silage such as whole-crop maize, thus creating a different system of beef production with a longer total feeding period of 15 to 16 months.
Improving total FCR
The edible FCR may also be improved by improving total FCR, either by increasing animal output from the same total feed input, or by reducing the total quantity of feed required to produce the same output. The latter approach is relevant to meat animals slaughtered at a constant weight to meet market specifications for carcase composition and is achieved by increasing growth rate to reduce the number of days to reach slaughter weight.
Genetic improvement has produced significant cumulative increases in output per head over past decades. For example, selection for milk yield has raised average output per cow in the United Kingdom by an average of 112 litres per lactation over the period 1990 to 2006 (Boyns, Reference Boyns2009). In non-ruminants, genetic selection for lean tissue growth has produced marked improvements in FCR and also in the time taken to reach slaughter weight. Thus, in poultry meat production the average number of days to slaughter is now 42 (Table 5) compared with 85 days taken in 1957 to achieve similar carcase fatness (Havenstein et al., Reference Havenstein, Ferket and Qureshi2003a and Reference Havenstein, Ferket and Qureshi2003b). Most of the improvement was due to genetics rather than to nutrition. The extent to which it may be possible to achieve further increases in daily growth rate, especially in non-ruminants, without compromising animal welfare is debatable.
Conclusions
Almost 42 million tonnes of grass and forage crop DM were estimated to have been consumed in the United Kingdom from 2008 to 2009 in the production of milk and meat from ruminants. Much of this land would otherwise be a largely inaccessible resource for the production of human food, though it could be argued that the land could produce biomass for energy or be re-wilded for enhancing biodiversity. Although cereal grains comprised <0.5 of total concentrates used by UK livestock from 2008 to 2009, they represent >5 million tonnes of crop grown on arable land, most of which could potentially be used for the production of human food.
Milk was the most efficient livestock system in terms of converting potentially human-edible feed into animal product. This was partly because forage comprised 0.75 of the total feed DM input to the dairy cow, partly because the concentrates used in milk production contained a relatively lower proportion of edible constituents than those used in non-ruminant systems and partly because in the majority of the ruminant meat systems the breeding female comprised a significant overhead cost of production.
With the exception of upland suckler beef, and despite the significant roles of grassland and crop by-products in the nutrition of meat-producing livestock, the conversion ratios of energy and protein in edible feeds into edible energy and protein in meat were >1.0, highlighting the need to improve efficiency of feed use in the livestock industry, especially in the ruminant meat sector.
Differences in feed use between systems of meat production were reduced when feed conversion was calculated as edible feed input per unit of product. On this basis, upland suckler beef and lowland lamb production were the most efficient systems of meat production. With the exception of cereal beef, replacement of cereal grain and soyabean meal with cereal by-products gave edible protein FCR values of <1.0, indicating the potential to reduce the proportion of edible ingredients in concentrate formulations to improve efficiency of edible feed use by livestock.
It is concluded that by accounting for the proportions of human-edible and inedible feeds used in typical livestock production systems, a more realistic estimate of efficiency can be used for purposes of comparisons between systems.
Acknowledgements
I am grateful to Phil Garnsworthy, Nottingham University; Adrian Williams and Eric Audsley, Cranfield University; Maggie Gill, Aberdeen University and Sue Popple, Department for Environment, Food and Rural Affairs for their helpful comments in the preparation of this paper.