


1. Introduction
The dynamics and mass balance of the West Antarctic ice sheet depend critically on the motion of ice streams. Despite the low driving stresses (10−1 bar), the ice streams move at velocities up to two orders of magnitude greater than the surrounding ice sheet. It is not possible to accommodate this fast motion by ice deformation alone (e.g. Reference BentleyBentley, 1987; Reference Echelmeyer, Harrison, Larsen and MitchellEchelmeyer and others, 1994) and it is thought that most of the motion occurs by basal sliding. Seismic experiments demonstrate that there is a dilated basal till layer with average thickness ∼6 m (Reference Blankenship, Bentley, Rooney and AlleyBlankenship and others, 1987) beneath locations observed on Ice Stream B. The results of borehole drilling support this conclusion (Reference Engelhardt, Humphrey and KambEngelhardt and others, 1990). It is generally thought that this dilated till layer or a thin water layer between the ice and till allows the ice to partially decouple from the underlying bedrock (e.g. Reference Alley, Blankenship, Bentley and RooneyAlley and others, 1987).
Siple Dome is situated on a plateau between Ice Streams C and D (Fig. 1). It is the largest of the inter-ice-stream ridges, and was selected as a site for a deep ice core because of its potential to yield information about the history of adjacent ice streams and past West Antarctic climate. We performed radio-echo sounding (RES) traverses during the 1994–95 and 1996–97 Antarctic field seasons that crossed the curvilinear topographic scar features on the northeast and southwest flanks of Siple Dome visible in satellite imagery (Fig. 2). From the earlier RES traverses, Reference Jacobel, Scambos, Raymond and GadesJacobel and others (1996) inferred the northeast scar feature to be a formerly active ice-stream margin.
Map view of the Siple Coast region of West Antarctica. The inset panel shows the position of the region on the Antarctic continent.

Advanced Very High Resolution Radiometer (AVHRR) satellite image of Siple Dome showing Ice Streams C and D. White lines show the path of the RES traverses discussed here. Formerly active ice-stream margins can be seen near both ends of the RES traverse (“Scar Feature” and “Duckfoot”). Image courtesy of T. Scambos, National Snow and Ice Data Center, University of Colorado.

The focus of this paper is a composite RES profile across Siple Dome shown by the continuous solid white line spanning the dome in Figure 2. The RES profile (Fig. 3, upper panel) spans from 90 km south of the summit, crossing a formerly active margin of Ice Stream C (and several other topographic features) to 71 km north across the formerly active “Siple Ice Stream” (SIS) margin. From these records we use the pattern of reflected power from the bed to infer the spatial pattern of basal properties beneath the dome and the adjacent dormant ice streams.
The upper panel displays a composite of 4 and 3 MHz RES data. The first 0.75 μs (80 m) of data (clipped by the direct wave) are shown in black. Surface topography was obtained primarily by global positioning system surveying (Reference Scambos and NeresonScambos and Nereson, 1995). WGS84, World Geodetic System 1984 ellipsoidal elevation. The lower panel displays the BRPR (Equation (2)) and the IRPN (Equation (3)) shifted by −1 for display purposes, and is discussed in subsequent sections. The vertical line in both panels marks the frequency transition in the data. Ice Stream D is to the north (right), and Ice Stream C is to the south (left).

2. Data Analysis
The RES data were reduced to determine the variation of bed reflectivity. The bed-reflection power (BRP) measured by RES is affected both by the travel path through the ice and by the bed reflectivity. Therefore, effects from the travel path must be taken into account in order to isolate the spatial pattern of reflection power actually caused by variations in bed reflectivity. Here we outline the steps described in detail in Reference GadesGades (1998) to isolate variations in bed reflectivity.
2.1. Selection of basal reflection
The data are first bandpass-filtered with a zero-phase forward-and-reverse digital filtering routine (a fourth-order Butterworth filter; corner frequencies 1 and 10 MHz) to reduce environmental background noise. The filtered data are plotted and an automated bed-reflection picking routine is used to determine the precise travel time and amplitude of the bed reflection from within a hand-selected time window which brackets the bed. Figure 4 displays the bed-reflection portion of a typical record with the picked features labeled.
A typical bed-reflection amplitude signal plotted as a function of the two-way travel time. The timing and amplitude of the maximum and minimum are labeled, and the period of the pulse T is shown as the window of time between the dashed vertical lines.

The shape of the bed reflection is uniform across Siple Dome, which allows for a simple definition of the duration of the reflection (bed-reflection window). The period of the bed reflection T is defined to be twice the time interval between the maximum and minimum values (Fig. 4), consistent with the results of Fourier analysis in defining the center frequency of the bed-reflection. For the purposes of calculating ice thickness, the delay time between the onset of the direct wave and the point of bed-reflection pulse maximum is chosen as the bed location.
2.2. Correction for frequency differences
The main profile across Siple Dome is a composite of data collected at two frequencies. The first section (−71.1 to −54.4 km) was measured with center frequency ∼4 MHz. The other section (−54.4 to + 71.1 km) was measured with center frequency ∼3 MHz. Center frequencies of these data were determined by averaging the Fourier power spectra of the bed-reflection pulse of the records in each section. Precise results yield 3.9 ± 0.3 MHz for the “4 MHz” section and 3.1 ± 0.3 MHz for the “3 MHz” section. The system response, the ice attenuation and the basal reflectivity are potentially all frequency-dependent. A small (10 km) section was repeated at both frequencies. The mean value of the bed-reflection amplitude (peak-to-peak) of the 4 MHz measurements was 1/1.76 times that of the 3 MHz measurements. Before any subsequent calculations were made, the amplitude of the 4 MHz portion of the data was scaled up by this factor to ensure continuity across the two sections.
2.3. Calculation of power
We define the returned power P from within a time window t 1−t 2 as one-half the sum-of-squared amplitudes (Ai ) divided by the number of samples in the window:

This definition is consistent with the definition of the power of a monochromatic sinusoidal wave train, which is simply half the amplitude squared integrated over a full period.
For calculations of BRP using Equation (1) we define the time window as T centered on the reflected pulse (Fig. 4). As a measure of radio-wave reflection and attenuation properties within the ice column (the path effects), we use Equation (1) with t 1 = 2 μs and t 2 = 6 μs. This time window begins immediately after the clipped direct wave and ends just before the bed reflection for the shallowest part of the profile. This quantity, the internal reflection power (IRP), is a measure of the amount of energy being reflected from within the ice column and is assumed to be an index of the power attenuated/scattered in the ice.
Calculation of the IRP is motivated by the fact that variations in the BRP may be caused by variations in the IRP. An increase (decrease) in the BRP may be caused by a decrease (increase) in the IRP. On the other hand, an increase (decrease) in both the IRP and BRP might indicate that either the attenuation in the ice decreased (increased) or the amount of energy propagating from the transmitter into the subsurface ice increased (decreased). For example, buried crevasses likely scatter and reflect energy, thereby reducing energy propagation into the ice interior and to the bed. This would in turn decrease both the BRP and IRP. Buried crevasses probably cause the simultaneous decrease in IRP and BRP near −70 km and at 60 km (Fig. 5).
Relative power levels of (from top to bottom) BRP, IRP and noise. The BRP varies with IRP, noise, ice thickness and dielectric properties at the bed. The large-scale variation in BRP is due to varying ice thickness across the profile (discussed in section 2.4).

The RES system records ∼1 μs of pre-trigger signal with each record, which enables us to determine the level of background noise. The noise power (calculated using Equation (1)) provides a reference for interpreting the signal-to-noise ratio. Figure 5 displays a semi-log plot of the BRP, IRP and noise (all calculated by Equation (1)). The noise level is more than an order of magnitude less than the IRP and BRP. The decrease in noise level near the summit (∼5 to +10 km) corresponds to a reduced traverse speed across the surface while profiling, which increased the number of averages in each measurement in that section. The IRP is relatively constant across the dome, but the variability increases across the scar features at either end of the profile. The large decrease in the BRP between −60 km and the summit is primarily related to the increase in ice thickness and is discussed in detail in section 2.4.
2.4. Correction for ice-thickness variation
The reduction of RES signal with path length (travel time or ice thickness) is a first-order effect. The greater the path length, the greater the attenuation due to geometric spreading of the wavefront and absorption/reflections within the ice. Changes of ice thickness across Siple Dome cause the measured BRP to vary by nearly two orders of magnitude (Fig. 5). To determine the actual BRP variation due to variations in bed properties, we must account for the effect of varying ice thickness. We do not know the values of relevant system parameters (e.g. transmitted power, receiver/antenna gain) and we do not have a suitable bed-reflection calibration point such as an ice shelf, so we cannot calculate absolute BRP (as is done in, e.g., Reference Shabtaie, Whillans and BentleyShabtaie and others, 1987; Reference Bentley, Lord and LiuBentley and others, 1998). However, the data span a sufficient ice-thickness range to allow an accurate empirical correction for the geometrical spreading and absorption, which should both be smooth functions of ice thickness.
The empirical relationship between ice thickness and BRP is established using a section of the RES profile from −54 to +57 km (Fig. 3). where the ice and bed properties are expected to be homogeneous so that variations in measured BRP are caused primarily by variations in ice thickness. In this section, the IRP is nearly constant, which suggests that the ice properties are relatively homogeneous. Obvious contrasts in ice or bed properties (e.g. across the scar features) are not present in this section.
The resulting empirical equation (Fig. 6) forms the basis for correcting for variation of BRP caused by variation in ice thickness. An exponential function characterizes the BRP/ thickness relationship well (r 2 = 0.8, rms = 0.04 × 10⁴ mV2 sample−1), and the residuals are evenly distributed about the function. The fractional uncertainty increases with increasing values of travel time (Fig. 6, inset panel). The goodness of fit and pattern of the residuals suggests that the data chosen for this empirical relationship are not significantly affected by variations in bed reflectivity or ice properties. An alternative explanation, that the ice properties and/or bed reflectivity vary smoothly as a function of ice thickness, is not physically reasonable.
Main panel: BRP vs travel-time relation. The data are displayed as points. The solid line displays the best (least-squares) exponential fit to the data. Inset panel: fractional residuals from fit.

It is convenient to define the normalized depth-corrected bed-reflection power (BRPR) as the ratio of the locally measured BRP to the BRP calculated from the local ice thickness and the empirical fit:

For comparison, the normalized internal reflection power (IRPN) is defined as the ratio of the measured values to the mean value:
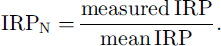
Variations of these quantities from 1 identify spatial changes in the ice and/or on the bed. Both BRPR and IRPN are shown in Figure 3 (lower panel), where the variation of BRPR and IRPN can be seen in relation to the topographic and stratigraphic features of the dome. The BRPR is nearly constant across Siple Dome, but both its magnitude and variability increase across the SIS margin. On average, the BRPR increases by a factor of ∼4 (maximum ∼7), which implies that the physical conditions at the bed changed across the transition. Similar changes occur on the Ice Stream C side of Siple Dome. These corrected data are discussed further below.
3. Discussion
3.1. Structure of the bed: Siple Dome
The increase in BPRR measured across the ice-stream margin allows us to place limits on the basal composition beneath Siple Dome. The average BRPR beneath Siple Dome is as small as 1/7 of that under SIS (Fig. 7). The power reflectivity can be at most
 . Therefore, we can infer that the reflectivity under Siple Dome is at most
 .
Upper panel: 3 MHz RES traverse across the north scar of Siple Dome, with clipped data shown in black. The horizontal axis is consistent with Figure 3. Evidence of buried crevasses is seen as faint point diffractors (visible as hyperbolae) between 60 and 65 km in the top 200 m of the profile. WGS84, World Geodetic System 1984 ellipsoid elevation. Lower panel: the BRP R and IRP N are the same as shown in Figure 3.

Calculations of the reflectivity for measured properties of frozen permafrost materials (Reference GadesGades, 1998) show that the reflectivity for these materials is generally
 . Using a three-layer reflectivity model (Reference Born and WolfBorn and Wolf, 1980), we calculate that if a frozen till layer does exist beneath Siple Dome, it must be less than ∼10−1 m thick to be consistent with
 .
Although the RES data limit
 to ≤0.14 for the Siple Dome bed, we expect that the actual value is significantly smaller. Based on a one-dimensional heat-flow calculation (Reference Nereson, Waddington, Raymond and JacobsonNereson and others, 1996) and on direct measurements through boreholes (personal communication from H. Engelhardt, 1998), it is likely that Siple Dome is frozen at its bed. As a first estimate, we calculate the bed reflectivity for Siple Dome by estimating the dielectric properties of the bedrock. The range of dielectric permittivities for rock is relatively narrow, from 7 (limestone) to 10 (sandstone) or 11 (basalt) (e.g. Reference Bogorodsky, Bentley and GudmandsenBogorodsky and others, 1985; Reference JonesJones, 1987), and the electrical conductivity is expected to be 10−4 to 10−5 Sm−1 (Reference JiracekJiracek, 1967). We use a two-layer reflectivity model (Reference Born and WolfBorn and Wolf, 1980) and calculate the power reflection coefficient for ice frozen directly to this range of rock types. Results indicate that the power reflection coefficient should range between
 and
 .
3.2. Structure of the bed: SIS
We proceed under the assumption that beneath Siple Dome
 The increase in reflected power by an average factor of ∼4 across the SIS margin implies that the reflectivity increases to
 under SIS. The large reflectivities under SIS cannot be the result of ice frozen to solid bedrock because that would require permittivities and/or conductivities for the rock that are well beyond the expected range. The large reflectivities are likely due to ice overlying liquid water or a saturated till layer. Both possibilities are considered below.
A water layer ∼30 mm thick and electrical conductivity in the range of that measured in the basal layer under Ice Stream B (2.5 × 10⁻² Sm−1) (Reference Engelhardt, Humphrey and KambEngelhardt and others, 1990) would yield
 . However, it is unlikely that such a large thickness of water could exist as a distributed layer over a hard bed. For example, it would be unstable and evolve into a channelized network (Reference WalderWalder, 1982). The large reflectivity may also be due to water distributed in the pores of a till layer similar to that found beneath the active Ice Stream B (Reference Blankenship, Bentley, Rooney and AlleyBlankenship and others, 1987; Reference Engelhardt, Humphrey and KambEngelhardt and others, 1990). We note, however, that the wavelength used for these RES measurements (∼100 m) is unlikely to allow us to directly distinguish between the scenario of a thin water layer (or channelized system) and a saturated till.
In addition to a thawed saturated till layer, the high reflectivity
 could also be explained by the existence of a frozen till layer at the bed. The dielectric permittivity (∊) for a frozen till layer composed of the rock types mentioned above and a porosity of 30% would be 6–8. The conductivity (σ) of a frozen till layer is poorly constrained, and few measurements have been made of the electrical properties of frozen composite materials. Conductivities for a variety of synthetic permafrosts given by Reference JiracekJiracek (1967) range from 8 × 10⁻⁴ to 2 × 10⁻² Sm−1. Measurements by Reference Hoekstra and DelaneyHoekstra and Delaney (1974) show that the conductivity of a water- saturated sand-and-gravel mixture was 10−3 Sm−1 but about 30 times lower (3 × 10⁻⁵ Sm−1) when frozen at −3°C. Composites with finer grains show smaller decreases in conductivity when frozen. The conductivity of finer-grained water-saturated materials decreases smoothly with temperature across the freezing temperature, and for many materials electrical conductivity may not decrease significantly until temperatures are well below freezing. If we assume that the results given by Reference Hoekstra and DelaneyHoekstra and Delaney (1974) for the water-saturated sand-and-gravel mixture are typical of rock/water composites, the conductivity of a frozen till layer similar in composition to the layer beneath Ice Stream B would decrease from 2.5 × 10⁻² Sm−1, as measured when thawed, to 8 × 10⁻⁴ Sm−1 when it freezes. Based on the range of experimental results for the conductivity of frozen rock/water composite materials (Reference JiracekJiracek, 1967; Reference Hoekstra and DelaneyHoekstra and Delaney, 1974), the estimate above represents a lower limit on the frozen-till conductivity.
If SIS is frozen to a till layer (∊ = 7; σ = 8 × 10⁻⁴ Sm−1) on top of bedrock, using the three-layer reflectivity model we calculate that the till layer would need to be at least 1 m thick to produce
 . Since the estimated conductivity for the frozen till is likely a lower limit, the frozen till layer could be even thinner. This thickness is similar to that thought to exist beneath active ice streams. We therefore do not rule out the possibility that the SIS bed is a frozen till layer. Because the bulk conductivities of thawed and frozen tills are similar, an equivalent till thickness is expected if the layer is thawed. Therefore we cannot distinguish between the two cases with our RES data.
The small-scale variability of the BRPR beyond the SIS margin could be caused by increased variability of the IRPN and/or small-scale (less than one ice thickness) variations in properties at the bed. Figure 7 shows increased variability in the IRPN over the scar feature that is likely caused by changes in scattering from buried crevasses in the firn. Variability in basal layer properties is also indicated by the point diffractors (appearing as hyperbolae) at the bed in Figure 7 beyond 62 km. Such diffractors would be expected if the basal till-layer geometry is spatially variable so that the ice–till interface is in places rough on the scale of a wavelength (∼50 m). If the bed is everywhere a non-diffuse (specular) reflector, a laterally heterogeneous layer would have variable reflectivity, but would not give rise to the point diffractors seen in the RES profile. The variation in reflected power and the presence of diffractors therefore indicate heterogeneity in the basal conditions beneath SIS.
Figure 7 shows that the internal layering is disrupted at 60 km, and yet the BRPR does not increase significantly until 62 km. The returned signal from this 2 km portion of the profile is affected by increased attenuation because both BRPR and IRPN decrease, which makes it difficult to accurately locate the transition in reflected power. However, it does appear that the increase in bed reflectivity occurs on the ice-stream side of the outer boundary of the dormant ice stream. If true (and if the reflectivity increase is interpreted as being a transition to a thawed bed), it may indicate migration of the frozen boundary into the dormant ice stream and away from its presumed initial position at the formerly active ice-stream margin.
3.3. Structure of bed: “Duckfoot”
RES data gathered from 55–90 km south of the summit used a slightly different center frequency than the rest of the profile (Fig. 8). This section of the profile crosses a formerly active margin of Ice Stream C that has been called the Duckfoot (Reference Jacobel, Scambos, Nereson and RaymondJacobel and others, 2000). The effect of varying ice thickness was removed from the BRP using the relation described in section 2.4 to produce the BRPR.
Upper panel: 4 MHz RES traverse across the inactive Ice Stream C margin. Data are reduced by the methods described above, with clipped surface data shown in black.WGS84, World Genetic System 1984 ellipsoidal elevation. Lower panel: the horizontal axis is consistent with Figure 3. The BRP R (Equation (2)) and IRP N (Equation (3)) (shown in lower panel) are the same as in Figure 3.

Large BRPR variations are also visible in this region (Fig. 8). While the amplitude of these variations cannot be determined precisely (for the reasons discussed in section 2.2), a pattern of higher values and larger variability similar to those observed on the north scar is evident. The highest returned power is formed under the region where the internal layering is most organized (Fig. 8: −70 to −83 km). It is likely that the pattern of reflected power is similarly caused by liquid water or thawed/frozen till at the bed. A second zone of relatively organized internal layering (Fig. 8: −83 to −85 km) does not show the same level of increased reflection power, but this is likely obscured by variations in near-surface crevassing (as evidenced by lower IRPN).
4. Conclusions
RES traverses across curvilinear scar features visible in AVHRR imagery on the flanks of Siple Dome support the idea that these scars are artifacts of formerly active ice-stream margins. The RES profiles show a large contrast in the BRPR across the dormant ice-stream margins, suggesting that either liquid water or a meters-thick, possibly frozen till layer exists beneath the now dormant ice streams surrounding Siple Dome. While it is generally thought that fast ice-stream motion occurs when liquid water is present at the bed, the possibility of liquid water existing beneath the dormant streams suggests this may not be a sufficient condition. The variability of the BRPR and the presence of point diffractors at the bed imply small-length-scale changes in basal properties beneath SIS. In contrast, the much reduced and spatially constant BRPR beneath Siple Dome suggests that the ice is frozen directly to bedrock or a thin till layer (∼10−1 m). The absence of a thick till layer beneath Siple Dome is consistent with its apparent stability as an inter-ice-stream ridge in the past (Reference NeresonNereson, 2000) and may suggest that it will remain as a stable limitation of ice-stream width in the future.
5. Acknowledgements
This research was supported by U.S. National Science Foundation grants OPP 93-16807 and OPP 95-30827. We acknowledge the contributions of field team members N. Nereson and T. Scambos.



