1. Introduction
Over the last 20 years, international metal prices have surged. Since the early 2000s, the IMF Commodity Metals Price Index has seen a more than three-fold increase and investments in mineral exploration in developing countries have been consistently increasing (Bebbington et al., Reference Bebbington, Hinojosa, Humphreys Bebbington, Burneo and Warnaars2008; Hinojosa et al., Reference Hinojosa, Bebbington and Addison2010). Moreover, metal prices are expected to remain elevated in comparison to historical standards. As a result, mineral-abundant areas have increasingly hosted new mining operations (SNL MEG, 2013).
Populations in close proximity to mines are likely to enjoy the potential benefits of the mining industry: direct job creation, the construction of new infrastructure and local multiplier effects. At the same time, communities living close to mines are typically the most exposed to environmental externalities of the mining industry: they are likely to compete with mines for water and land use; they can experience economic, social and cultural repercussions from inflows of new workers. How are living standards of these communities affected by mining operations? Does mining development improve access to basic services and education for local populations? What is the net impact on the structure of local economies? Does corporate social responsibility (CSR) influence the impact on mining communities? This paper tries to answer these questions by studying the nexus between the mining boom and a set of local development indicators in Peru.
We have chosen to focus on Peru for its illustrative value since it is one of the countries with the highest concentration of mining activities in the world. Moreover, most mining operations are spread along the Highlands, a vast portion of national territory with relatively homogeneous environmental, climatic, and socioeconomic characteristics. This, in combination with good-quality and widely available data, allows us to obtain a considerable sample of the size and level of comparability between mining and non-mining areas.
Our results suggest that the potential benefits of the recent mining boom on local economies are largely untapped. The recent mining boom has created labour opportunities in this sector and affected internal migration flows, but it has generated negligible spillovers for non-mining activities. Moreover, populations living in new and non-mining areas have experienced no statistically different changes in welfare and housing conditions and in access to basic services. A set of institutional reforms and policy measures introduced since the 1990s have contributed to limiting the adverse effects of extractive industries that the country has experienced in its long mining tradition, but they have been less effective in unleashing the local potential benefits of mineral resource wealth. In addition, based on our estimates, we argue that, so far, CSR spending has not substantially improved the effects of local mining. The results of this paper, therefore, are consistent with the interpretation of the growing climate of social tensions as a manifestation of the incongruity between the fast growth of large mining operations and the low level of resulting gains produced for local populations.
The paper is organized as follows. Section 2 presents a brief literature review about the local impacts of extractive activities. Next, in section 3, we describe recent changes in the history of the Peruvian mining sector. Section 4 develops a simple conceptual framework showing that the impacts of mining growth on local populations are theoretically ambiguous. Sections 5, 6 and 7 present the methodology and data we use to construct a counterfactual scenario to evaluate the effect of new mining activities in Peru. Section 8 discusses the main results and section 9 summarizes the key findings and offers our main conclusions.
2. Literature review
Numerous case studies on the local impacts of extractive activities have tried to assess whether the mining industry benefits or has an adverse effect on the wellbeing of communities living close to mines. Most of them focus on a limited area, on specific firms or subsectors. They often describe the environmental and health impacts of mining activities on local populations and the risk that most benefits of mining exploitation will be transferred outside the zone of extraction or processing (IIED & WBCSD, 2002; Yelpaala and Ali, Reference Yelpaala and Ali2005; Crowson, Reference Crowson and Richards2009; and, above all, numerous documents provided by journalists and activist organizations).Footnote 1 Other works, instead, emphasize the progressive role of mining operations in local development and in the control of negative externalities (McMahon and Remy, Reference McMahon and Remy2001; evidence described by the industry association International Council on Mining and Metals [ICMM]). Case studies conducted in Peru also reveal both the advantages and disadvantages that may be accrued from the interactions between mines, local communities and local economies (Glave and Kuramoto, Reference Glave and Kuramoto2007; Aragón and Rud, Reference Aragón and Rud2009; De Echave et al., Reference De Echave, Hoetmer and Palacios2010). These works can provide useful insights into the local impacts of the mining industry, but usually consider emblematic examples which may not fully reflect general patterns and trends.
Systematic statistical and international evidence is provided by the literature on resource abundance which is converging towards some stylized facts: point-source wealth tends to jeopardize economic growth; better institutions can reduce the likelihood of a resource curse, but a rich point-sourced resource dependence may be deleterious for the quality of institutions and their pro-development role (Isham et al., Reference Isham, Woolcock, Pritchett and Busby2005; Mehlum et al., Reference Mehlum, Moen and Torvik2006; Mavrotas et al., Reference Mavrotas, Mansoob Murshed and Torres2011; van der Ploeg, Reference van der Ploeg2011). However, conclusive claims cannot be made on the basis of this literature alone. Some authors challenge the econometric methodology, specification or the measurement of resource abundance and find results which are not consistent with the existence of a negative relationship between resource abundance and economic development or growth (Brunnschweiler and Bulte, Reference Brunnschweiler and Bulte2008; Alexeev and Conrad, Reference Alexeev and Conrad2009). Moreover, most of the literature on curse hypothesis is based on cross-country studies and does not focus on local impacts. Not all channels that are relevant at the local level are equally translated at the national level. The effect of extractive activities on migration, for example, may be more important within the national borders, while the environmental impact can be concentrated in the areas close to the mining operations. Cross-country studies may fail to capture these effects.
To circumvent these weaknesses, this paper contributes to the literature on the role of mineral resource wealth in local economic development by providing nationally representative evidence based on variations within the country. We estimate the impact of the mining boom in the decade up to 2007 from a set of local socioeconomic indicators in Peru by combining difference-in-difference estimations with propensity score matching techniques (PSM-DD) to construct a proper counterfactual for comparing non-mining and mining districts. This approach can provide more systematic evidence than anecdotal and case studies. It is also more robust than cross-country studies since, by focusing on a single country, many geographical, institutional, political and cultural characteristics which may affect both mining operations and their impact can be considered common to all observations and therefore they do not produce biases in the estimates. Finally, the PSM-DD technique permits the control of other confounding factors which may vary across districts. In particular, this technique allows us to compare mining districts and ‘comparable’ districts, namely districts which, in the absence of a mining boom, would have similar outcome indicators.
This paper integrates a recent strand of literature of country-level works which study the link between resource abundance and local development using different regions within the same country as units of analysis (Papyrakis and Gerlagh, Reference Papyrakis and Gerlagh2007; Domenech, Reference Domenech2008; Boyce and Emery, Reference Boyce and Herbert Emery2011; Michaels, Reference Michaels2011; Caselli and Michaels, Reference Caselli and Michaels2013) or controlling for the proximity to extractive activities (Aragón and Rud, Reference Aragón and Rud2012). This paper can be considered as an extension of Zegarra et al. (Reference Zegarra, Orihuela and Paredes2007), which estimates the impact of mining in Peru using a similar methodology. However, our paper departs from this work in at least three main aspects. First, since we use census data, we can consider a greater number of districts and we can apply difference-in-difference (DD), rather than cross-sectional estimations as in Zegarra et al. (Reference Zegarra, Orihuela and Paredes2007). In this way, we can correct potential biases due to time-invariant confounding unobservable variables. Second, our work redefines the unit of analysis. We find that is possible to construct a proper counterfactual for new mining areas but not for old mining areas. Consequently, the impacts of mining can only be evaluated for the wave of investments that began in the mid-1990s. Third, the scope of the research has been expanded. The analysis incorporates the effects on migration and labour outcomes. This is an important extension since we find that the most significant impacts of the recent mining boom have been those on the incidence of migrants and on the distribution of employment. Moreover, we try to assess whether a relevant engagement of mining companies in CSR initiatives can change their impact on local communities.
This work, therefore, also relates the debate on the role that CSR and institutional quality can play in mitigating the possible adverse effects of extractive activities, enhancing the potential benefits of mines in surrounding areas and managing social conflicts. International organizations (McMahon and Remy, Reference McMahon and Remy2001; World Bank, 2008), industry associations,Footnote 2 research centres (IIED & WBCSD, 2002) and major NGOs (Herbertson et al., Reference Herbertson, Ballesteros, Goodland and Munilla2009) are converging to produce a set of guidelines for inclusive and sustainable mining which pivot around institutional conditions: transparency in dispute resolution and in managing mining revenues; long-term vision in managing price and revenue volatility; informed and capacitated participation of all stakeholders; government credibility and capacity of enforcement, supervision and regulation. At the same time, CSR has gained increasing importance in the relations between extractive activities and local communities with the idea that a coherent CSR strategy can be a win-win solution for corporate goals and for the wellbeing of the society. Some examples include the Global Reporting Initiatives, the UN Global Compact, the Centre for Social Responsibility in Mining, and the Corporate Social Responsibility Initiative. The contribution of CSR projects or a real change in production and management practices, however, is contested (Pesmatzoglou et al., Reference Pesmatzoglou, Nikolaou, Evangelinos and Allan2012).
Peru offers an interesting case study also with respect to these issues. From the early 1990s, the country has introduced important reforms and has tried to comply with the current international consensus on sustainable mining development. Moreover, some of the biggest mining companies have invested heavily in CSR initiatives. In theory, the recent mining boom, thus, has occurred in an institutional context that encourages a positive interaction between mines and local populations. In practice, the recent mining boom has seen a proliferation of new mining-related social conflicts. To provide an explanation for these apparent contradictions, the study concentrates on new mining areas which, at the beginning of the boom, had not previously experienced a tradition of mining development. A focus on new mining districts allows us to assess the specific impact of the new institutional setting without combining it with the long-lasting effects of mining activities which took place before the institutional reforms of the 1990s. Then we focus the analysis further on districts characterized by a low social corporate spending in order to evaluate whether CSR strategies of mining firms were able to mediate their impact.
3. The Peruvian 21st-century mining boom
Throughout its long history of mining exploitation, Peru did not manage to transform its enormous mineral wealth into a sustained process of economic and human development. In the 1990s, however, the country promoted a set of economic and institutional reforms that reinvigorated the positive auspices of the pro-development role of this sector. The government passed several legislative measures to reduce obstacles to foreign capital inflows towards the mining industry, to promote privatization and to ensure a favourable fiscal regime and a stable and clear legal framework. In the late 1990s these new investment conditions, the economic stabilization of the Peruvian economy and the recovery of the international economic cycle led to a surge in mining investment and production. Between 1996 and 2009, annual mining investments increased from US$387 to US$2,771 million (MINEM, 2004, 2009). From 1995 to 2005, mining GDP grew at yearly average rates of 8.2 per cent compared to a total GDP growth of 3.2 per cent. In this period, Peru enhanced its position as a metallic producer and in 2008 it was the first and second world producer of, respectively, silver and zinc, and the third world producer of copper, tin and bismuth. The decade of the mining boom also witnessed a strengthening of the role of the state in environmental regulation and monitoring. Furthermore, since 2000–2002, Peru has promoted fiscal and political decentralization and the current fiscal legislation provides for redistributive mechanisms that should prioritize those areas more exposed to potential negative effects of mining operations. These new rules and the surge in mining production led to a rapid increase of transfers to regional governments that in 2007 reached a level 38 times higher than in 2002. In 2008, revenues generated by the mining sectors accounted for a large share of total transfers to regional (60 per cent) and local governments (39 per cent).Footnote 3 Mining expansion has also created new labour opportunities, especially in areas at high altitudes where several economic activities are not viable or remunerative. According to the estimates of the Instituto de Ingenieros de Minas del Perú (IIMP), in 2009 more than 2.5 million people were directly or indirectly dependent on mining (IIMP, 2010).
At the same time, Peru has fostered public–private partnership and consultative mechanisms in managing community–mine relationships (Arellano-Yanguas, Reference Arellano-Yanguas2008), while multinational corporations have increasingly invested in development and infrastructure projects. Between 2000 and 2009, expenditure of mining companies for infrastructure and social programs grew from US$30.5 to US$73.5 million (Hoyos Ordonez, Reference Hoyos Ordonez2002; IIMP, 2010).
Despite this notable progress in the legal and institutional settings, the mining industry has been facing growing unrest from local interest groups. The number of concessions for mining exploration and exploitation rose from 1,525 in 1994 to 2,100 in 2007 (MINEM, 2012). In 2009, about 24 per cent of the 21 major populated watersheds were subject to mining concessions (elaborated from Bebbington and Bury, Reference Bebbington and Bury2009). This rapid extension of the territorial influence of mining has increased the contacts between enterprises and local communities as well as competition for other human and productive water and land uses. In 2009, the Peruvian Ombudsman's office recorded 129 socio-environmental conflicts and about 65 per cent of them (83) were mining-related disputes. Most mining conflicts are, primarily, struggles over the use and contamination of water resources (60 per cent) and for land acquisition and access (15 per cent) (Glave and Kuramoto, Reference Glave and Kuramoto2007). Management of mining revenues has also received criticism. Some authors suggest that, in Peru, management and distribution of mining taxes and royalties tends to be problematic (Barrantes et al., Reference Barrantes, Zarate and Durand2005; Arellano-Yanguas, Reference Arellano-Yanguas2008). Moreover, direct investment by mines in social development and infrastructure is highly concentrated: in 2008, two companies alone financed 36 per cent of all funds allocated in that year (IIMP, 2010).
Qualitative evidence suggests that local populations and their organizations,Footnote 4 overall, agree that the mining companies, so far, have not produced a sizable positive impact on their living conditions. They claim that labour opportunities in mines are very limited and not stable, while fiscal revenues distributed at the local level are lower than expected. In some cases, rural organizations have denounced unfair land transactions with mines or damage to health, soil and water resources.
This rapid overview clearly shows a complex dynamic system where perceptions, expectations and real and potential impacts are difficult to evaluate and to unscramble. In the following section, we identify and briefly discuss the main channels of potential impacts of the mining industry on a set of socioeconomic dimensions. We then try to understand which of these potential effects have materialized on the ground by comparing mining districts with suitable counterfactual non-mining districts.
4. A schematic conceptual framework
This section offers a schematic conceptual framework of the linkages between different economic dimensions (assets, prices and population dynamics) that can be activated or affected at the local level by the expansion of existing mining activities or the opening of new mining operations. Based on the empirical and theoretical literature discussed in the previous section, we expect that mining activities can spur a range of interconnected local effects:
-
(a) Public goods and access to public services. Mining industries can lead to an increase in public goods and services through different channels (Ticci, Reference Ticci2007):
-
• increase in demand for public goods and services, rise in political opportunity for their provision, and reduction in their financial cost due to changes in size, income and geographical distribution of population;
-
• loosening of government budget constraints due to a rise in inflows of mining revenues; indeed, the international emphasis on the issue of resource revenues transparency (as emblematically represented by the case of EITI) suggests that financing of public expenditure is one of the main pro-developmental roles of mining industries in resource-rich countries (Liebenthal et al., Reference Liebenthal, Michelitsch and Tarazona2005);
-
• increase in private investment in construction and maintenance of infrastructure;
-
• promotion of local development projects by mining firms.
-
-
(b) Physical and human capital. Local public expenditure and funds directly managed by mining companies can finance health and educational services and infrastructure, or transport, communication and power projects, with positive effects on physical and human capital accumulation. In contrast, air, water and soil pollution of mines can negatively affect human capital by causing health problems.Footnote 5 Finally, to the extent that mining growth expands or reduces business and labour opportunities, it can also affect the capacities and incentives of households to invest both in human and in physical capital.
-
(c) Migration flows and urbanization. Mining activities can encourage:
-
• environment and land-related movements: farm households that have lost their lands or have been negatively affected by environmental externalities of mining may move to other districts or to urban areas;
-
• labour-related migrations: mining areas usually attract immigration flows of people who seek jobs in the mining industry or in other sectors with upstream or downstream linkages.
-
-
(d) Farming activities. The potential impact of mining development on farming activities is ambiguous. On the one hand, mining operations can crowd out the agricultural sector since they often require an intensive use of water resources, are land demanding and can create heavy environmental externalities. On the other hand, in some cases, large mining corporations finance agriculture development projects (from extension services and technical assistance to capacity building, access to credit and irrigation infrastructures) or construction of rural roads with positive effects on agricultural productivity and farmers' access to markets. In addition, if mines attract new workers and their families, local food markets might develop, resulting in increased returns to agriculture. Some case studies confirm the possibility of these opposite effects. Aragón and Rud, (Reference Aragón and Rud2009), for instance, found that, in Peru, the gold mine Yanacocha has produced a positive impact on households' income by stimulating the demand for local goods, agricultural products included, while in Ghana, they estimated (Aragón and Rud, Reference Aragón and Rud2012) that areas closest to gold mines have seen a decline by about 40 per cent of agricultural productivity, probably because of pollution.
-
(e) Relative and absolute local prices, wages, employment and sector composition of local economy. A mining boom can be associated with changes in population size and in the composition of population by age, income, occupation and education. Expansion of mining operations can increase local labour demands through direct labour employment and through an increase in demand for local goods and services. All these factors are likely to shape the level and structure of employmentFootnote 6 as well as incomes in different sectors and relative prices of locally traded and untradeable goods compared to tradable goods. An increasing return to service and mining-related manufacturing activities can, for example, induce economic diversification of household income sources out of the farming sector.
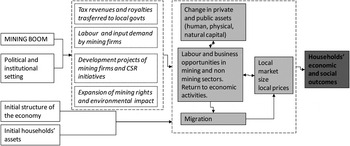
All these potential effects of mining growth are likely to manifest themselves as an impact on the level and distribution of household economic wealth and expenditure. The final effect, however, is ambiguous. Figure 1 illustrates the main mechanisms at stake. The blocks in italics show the different channels of transmission, but not all of them are always activated in all mining areas and neither do their effects always have the same characteristics. In addition, political and institutional contextual settings, mines' attitudes, CSR practices and procurement policies,Footnote 7 initial household asset endowments, ex ante specialization and tradition of local economic conditions can mediate or feed the various interlinks.
Main channels of mining impacts on local economies

This means that the impact of the recent mining boom on local economies is context specific, is not univocally predictable and can change across different countries or regions. The effects of mining on local economies (from asset endowments and sector composition of employment, to local prices and households' welfare) remain, therefore, an empirical questionFootnote 8 which requires econometric analysis able to control for those factors which may influence the exposure to a mining boom, the initial conditions and the final local outcomes. The next section develops an econometric analysis with these characteristics.
5. Estimation methodology
We estimate the effects of the mining boom on a set of outcomes by combining a DD estimate with propensity score matching (PSM). In this study, districts located in the Highlands constitute our units of analysis and the exposure to the 1993–2007 mining boom represents the ‘treatment’ for which we want to study the effects.
The simple comparison between the mean outcomes of treated and untreated units might be misleading if some factors influence both the outcome and the probability of participating in the treatment. We need, instead, to use ‘comparable’ districts, namely districts that, in the absence of a mining boom, would have shown similar outcome indicators. For this purpose, we resort to the PSM technique to balance for observable characteristics and create groups that are as similar as possible in terms of confounding variables.Footnote 9 Let Y i 1 be the outcome value of district i if i is treated (i.e., is a mining district) and Y i 0 the outcome value of district i if i is not treated (i.e., is a non-mining district). We also define D(Z) as the observed participation status, with D = 1 in case of treatment, D = 0 otherwise, and Z indicating the set of variables which determine treatment group membership (i.e., exposure to the mining boom). PSM assumes that there are no other unobservable variables which are linked to the exposure to the mining boom and which also affect expected impacts Y. If this condition is not met, the matching method will generate biased estimates of impacts. However, if the unobservable variables that have these features are permanent, the bias may be eliminated, coupling PSM with DD (Heckman et al., Reference Heckman, Ichimura, Smith and Todd1998). For example, this method controls for the bias arising from a change in the economic environment – a macroeconomic change or a weather shock such as El Niño – that involves all districts and that might affect both outcome variables and mining operations. Moreover, by focusing the analysis on the Highlands region, the assumption of homogeneous impacts across districts appears more plausible.
The PSM-DD estimator of the ‘Average Treatment Effect on Treated’ (ATT) is constructed by comparing the before and after mining boom mean change in outcome measures for the mining districts with those for the matched non-mining districts:
 $$\eqalign{ATT &= E_{p\lpar Z/D_i = 1\rpar } \left\{\left[E\lpar Y_i^{1\comma t + 1} -Y_i^{1\comma t}/D_i = 1\comma \; p\lpar Z_i\rpar \rpar \right.\right. \cr &\quad \left. \left. -E\lpar Y_i^{0\comma t + 1} - Y_i^{0\comma t} /D_i = 1\comma \; p\lpar Z_i\rpar \rpar \right]/D_i = 1 \right\}.}$$
This study calculates propensity scores using a logit regression and applies nonparametric kernel matching. The PSM estimator for ATT can be analytically expressed as (Guo and Fraser, Reference Guo and Fraser2010):
 $$ATT = {1 \over n_1} \sum_{i\in I_1 \cap S_p} \lcub \lpar Y_i^{1\comma t + 1} - Y_i^{1\comma t} \rpar - \sum_{j \in I_0 \cap S_p} W\lpar i\rpar \lpar Y_j^{0\comma t + 1} - Y_j^{0\comma t}\rpar \rcub$$
where n 1 is the number of mining districts, i ∈ I 1 are mining districts, j ∈ I 0 are non-mining districts, Sp is the common support region, and W(i, j) is the weight given to the j th non-mining district in making a comparison with the i th mining district. Weights are assigned according to a kernel function of the predicted propensity score following Heckman et al. (Reference Heckman, Ichimura and Todd1997). Standard errors are estimated using the bootstrapping method. In order to ensure robust findings, we exclude districts with a history of mining exploitation and we restrict the analysis by comparing non-mining areas and areas where mining activities have grown after 1993 (hereafter referred to as ‘new mining districts’). Former specialization in the mining sector, indeed, is likely to affect both the participation in the mining boom and its impact.Footnote 10 This two-fold effect impedes the construction of an appropriate counterfactual for old mining districts. A focus on new mining areas, therefore, allows us to avoid the risk of confounding past effects of mining development with those triggered by the recent mining boom.
6. Data sources and classification of mining areas
Our empirical analysis is based on the combination of various data sources. Data on socio-demographic characteristics and labour indicators at district level come from the Population and Housing Census of 1993 and 2007. The Mining Directory of the Ministry of Energy and Mines provided the list of all mining units in activity in the Peruvian territory. For additional mining information, we rely on the Datamart system of the Ministry of Energy and Mines (MINEM, 2012). Data on agricultural production and agricultural producer prices are drawn from SISAGRI, the source for aggregated Ministry of Agriculture data, while other information on agricultural and farming stocks comes from the 1994 Peru National Agricultural Census (CENAGRO 1994). This information is also linked to other data on geographical characteristics that are gathered by the National Statistical Office.
After the construction of the data set, the first step in investigating the welfare and distributive impacts of mines at the local level is the creation of a dummy variable which identifies those areas that have been exposed to the influence of the recent mining boom. We use districts, the third-level country administrative subdivision after departments and provinces, as units of analysis. This choice presents some advantages. It appears a reasonable compromise between larger units, which might fail to capture the effects of localized environmental externalities, and smaller units which are not suitable to embody economic linkages that go beyond the nearest areas to mines. Moreover, a district-level analysis ensures a large sample size and a sufficient degree of homogeneity: in the Highlands, there are 1,207 districts with a lower average and standard deviation in terms of surface than on the Coast and in the Jungle, the other two natural regions of Peru.
We define mining areas as those districts where the number of mining workers in 2007 was above the average within the group of districts with at least one mining worker (108) or where there is at least one medium-large operative mining unit. All remaining districts are defined as non-mining or untreated (UD). Mining districts, in turn, are divided between new (NMD) and old mining districts (OMD) defined as mining districts where the number of mining workers in 1993 was, respectively, below and above the average. Finally, we denote mining districts with high (or low) social corporate spending in all mining districts where average per capita spending for social projects in 2007 was above (below) the average within districts with positive companies' social spending (195 soles).Footnote 11 This classification identifies 1,074 UD and 95 NMDs which are homogeneously distributed along the Highlands and 38 OMDs which are more concentrated in the Central and South Eastern Highlands (see table A1 in the online Appendix, available at http://journals.cambridge.org/EDE).
A number of reasons and arguments underpin the choice of this definition:
-
(a) The selection of districts with operative large and medium-sized mining units ensures that the list of mining areas does not include those districts where firms undertake only exploration work, or are no longer or are not yet active. We do not use this criterion for small and artisanal mines since data might not be complete due to the presence of informal activities. The possibility of a wide diffusion of small and artisanal activities is controlled for by considering the incidence of mining employment which is measured by census data rather than by administrative data.
-
(b) The criterion based on the number of mining workers allows us to avoid the risk of some districts being classified as non-mining even if there are companies operating in the territory but with a headquarters in a nearby district.
-
(c) Identification of old mining districts is based only on the number of people employed in the mining sector in 1993 since, to our knowledge, detailed data on metallic mining operations prior to the mining boom are not available.
-
(d) The use of average values as threshold levels appears to be the most consistent criterion with the results of the analysis, namely the estimates of average effects of the mining development on districts which participated in the mining boom between the 1990s and the 2000s.
-
(e) Further restrictions imposed in the analysisFootnote 12 (see next paragraph) ensure that, both in 1993 and in 2007, the number of mining workers in non-mining districts used for the construction of counterfactuals is below the average values employed in the classification. The same holds for CSR spending.
We recognize that other slightly different criteria could be applied. In an earlier study, one of the authors (Ticci, Reference Ticci2011) classified as mining those districts with a share of district surface under mining concessions above a certain threshold and conducted robustness checks using different thresholds. Further, she selected old mining districts according to the presence of operative mining firms in 1994. However, concessions could also include areas which were not really exploited and data on operative units in the early 1990s were not disaggregated by size. The approach proposed in the present work addresses these imprecise elements. Finally, by using additional information, we assess the capacity of the proposed classification to reflect the scope of socioeconomic direct and indirect impacts of mining development that we have identified in the conceptual framework of section 4. The average amount of land under mining concessions for each type of operation – exploitation, exploration, inactive and abandoned mines – and the average amount of mining tailings are much greater in mining than in non-mining districts (see table A2 in the online Appendix). Therefore, there is evidence that the proposed classification mirrors the exposure of district territory to intense mining activities.
Furthermore, the incidence of mining canon on the main public transfers to local governments is higher among mining than non-mining districts, but in this case the gap is less defined. In line with the legislation, mining canon also reaches non-mining districts. But the main feature of mining canon distribution is its temporal and geographical concentration. Mining canon transferred to local governments has accelerated only in recent years (see table A3 in the online Appendix) and is concentrated on a limited number of districts: the top 20 districts (about 1.7 per cent of all Highlands districts considered in the analysis) account for 34 per cent of total mining canon received by local governments in the 1996–2005 period. The distribution of CSR spending and mining classification shows a greater correspondence (see table A3 in the online Appendix), with a sharp divide between non-mining and new mining districts. However, these flows are also concentrated in a restricted number of districts which might capture the bulk of benefits. By interpreting this descriptive evidence on the basis of our schematic framework, two main considerations can be pointed out. First, the proposed classification matches the relevance of the mining sector at the district level. Second, we can reasonably expect that, in Peru, the impact of the mining boom acts more through its effects on land rights, incentives for labour-related migration and demand for local inputs, goods and services rather than through local public expenditure and CSR initiatives of mining companies. Estimates of the impacts might provide additional evidence to evaluate this interpretation.
7. Constructing the counterfactual
In order to create a comparable control group for mining districts and to estimate the propensity scores, we evaluate a set of potentially relevant control Z variables that are exogenous and might affect both changes in outcome variables and the likelihood of participating in the mining boom:
-
(a) Known metallic deposits in 1997. Investors are likely to firstly target areas where the presence of metallic deposits is documented.
-
(b) Land utilization and the presence of farm activities prior to the mining boom. Mining investments might be discouraged in districts where land disputes with local populations are more likely, namely in districts with greater utilization of land for productive uses and a higher return to farming activities before the mining boom. At the same time, farming specialization might affect both the exposure of the local economy to mining risks and its capacity to capture mining benefits. The analysis uses a set of proxies of these factors drawn from 1994 CENAGRO: agriculture land as a share of total district area, average share of farmers' land used for farming or breeding in the district, average share of farmers' non-irrigated agricultural area in the district, and the share of non-formally titled plots of land.
-
(c) Average district altitude. The presence of metal resources is more likely in districts at high altitudes, but these areas can also be less accessible and less endowed with public services because costs for the provision of public services are higher than in other areas. This, in turn, might influence the return to economic activities and migration decisions. Moreover, altitude tends to correlate with climate conditions that affect types and productivity of farming activities.
-
(d) Mining exploration operations and exploitation activities in the surrounding districts prior to the mining boom. Existence of these operations can prefigure successive activities of mining exploitation in the district. At the same time, exploration activities can also lead to land disputes or transactions, while local populations can change their investment and migration choices as they anticipate a future mining expansion. We therefore include a dummy that indicates whether in the district there was at least one concession for mining exploration in 1994–1997 and a dummy that takes value 1 if the district belongs to a province where another district had at least one mining exploitation concession in 1994–1997.
-
(e) Protected areas in the district can prevent mining investments and influence other economic activities, infrastructural development and distribution of human settlements.
-
(f) Regional dummies are used to control for historical and political factors, for differences in rock composition, in distribution of mineral deposits and availability of water resources which are important inputs for mining, energy and farming production.
-
(g) Human capital at household level prior to the mining boom. Some initial household characteristics could correlate with the probability of living in mining or non-mining areas but also with affordability in meeting private costs associated with access to public services (private costs of connection, preparation of home facilities, etc.) and with changes in overall social and economic welfare status. In order to control for these effects, we introduce the average education level of the heads of households in 1993 and share of heads of households whose mother tongue was a native language in 1993.
-
(h) Change in welfare index in the earlier period. We include the growth rate of welfare index, a key and representative outcome variable, before the mining boom to assess the presence of correlation between unobservables and the probability of receiving the treatment.
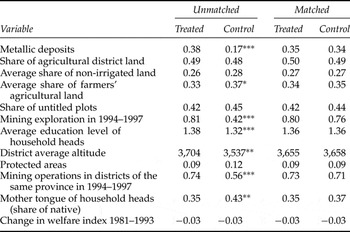
In order to estimate a population-level treatment effect, we estimate the propensity scores applying the Stata module pscore elaborated by Becker and Ichino (Reference Becker and Ichino2002) and using weighted logit regression.Footnote 13 Weights are calculated according to the reference population of each outcome variable. The matching procedure passes the balancing test which is restricted to the common support to improve the quality of the matches (Caliendo and Kopeinig, Reference Caliendo and Kopeinig2008). Table 1 shows that the matching allows a substantial reduction in bias for all confounding variables. Standardized differences between NMD and UD in the matched sample are very low and not statistically significant.
Mean values of overall and matched sample

Notes: *, ** and *** indicate significance levels of 10%, 5%, 1%, respectively of t-tests for equality of means in the groups of new mining and non-mining districts, both before and after matching; t-tests are based on a regression of the variable on a treatment indicator. Before matching, this is an unweighted regression on the whole sample; after matching, the regression is weighted using the weight assigned to the matched observation by the Kernel-based matching and based on the on-support sample. Regional dummies are included but not reported.
8. Average treatment effects
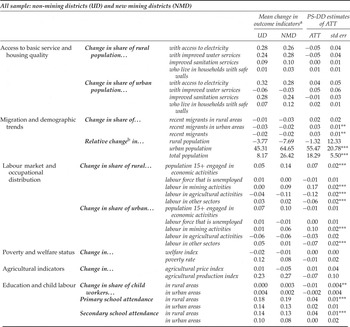
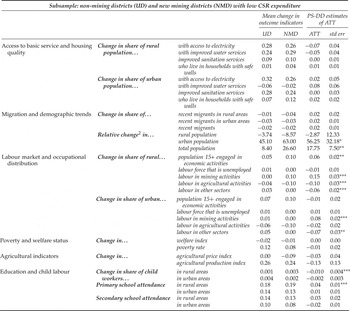
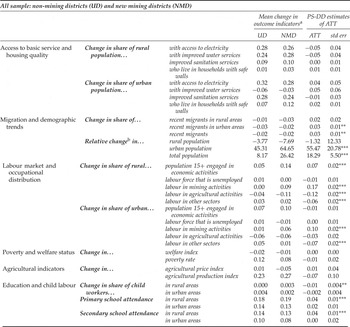
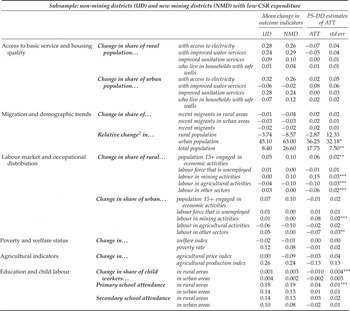
This section uses the propensity score calculated above to estimate the average treatment effects of the mining boom on a set of outcome variables that cover various dimensions of local development: demographic trends, access to public goods, housing conditions, employment, and diversification of local economy. Recalling the scheme in figure 1, this means that we focus on the dimensions representing the final outcomes (light and dark grey blocks) rather than on the transmission channels (blocks with dashed lines). Each mining district is matched with a weighted average of a share of non-mining districts in the control group on common support. This share is determined by the choice of bandwidth. We show the results when the bandwidth is set at 0.06 but, to check the robustness of the results, estimates are replicated for other bandwidths, 0.01, 0.08 and 0.5. Tables 2a and 2b present the mean average changes in the outcome variables across NMDs and UMDs within the common support and the PS-DD estimates of average impacts experienced, overall, by NMDs and by NMDs with low corporate social spending. OMDs are excluded from the sample.
Double difference estimates
Double difference estimates
Notes:
(i) aMean changes in outcome indicators between 1993 and 2007 are restricted only to those districts determined by PSM.
(ii) bATT estimates of relative changes are calculated without combining propensity score matching with difference-in-difference.
(iii) *, ** and *** indicate significance levels of 10%, 5%, 1%, respectively, when testing the null hypothesis of equality of mean changes between UD and NMD.
(iv) PS kernel-matched standard errors are obtained by bootstrapping (100 repetitions).
(v) Number of observations in the common support varies across indicators because of data availability. ATT estimates in the overall sample are based on a number of observations ranging from 1005 and 959 observations (873/917 comparison and 86 NMD). ATT estimates in the subsample are based on a number of observations ranging from 975 and 895 observations (827/917 comparison and 68 NMD).
(vi) PS-DD estimates refer to the 1993–2007 period for all indicators with the exception of changes in agriculture indicators which are related to the 1999–2007 period.
We find that new mining areas saw a significantly faster growth of total and urban populations than non-mining areas, probably reflecting their capacity to attract migration flows or contain outmigration. While, on average, non-mining districts experienced a decrease in immigrant populations, new mining areas received migrants from other districts. These differences, however, are smaller or not significant when the analysis focused on districts with lower corporate social spending. Therefore, the presence of mining firms with active social responsibility policies might have acted as a catalyst for migration flows.
As far as sectorial labour allocation is concerned, overall, the districts of the Highlands experienced a generalized reduction in the labour share of farming activities and this pattern was more marked in rural mining areas. However, we cannot unequivocally state that the mining boom caused a deterioration of the agriculture sector since our estimates do not highlight an impact on crop producer prices and on the district value of agriculture production. These data, therefore, do not allow us to conclude whether the reduction in agriculture labour share is explained by the negative effect of mining on access to or quality of land and water resources or by the arrival of new workers employed in mining-related activities. Mining growth, in fact, has also produced a positive effect on the share of the labour force employed in the mining sector both in urban areas and, to a greater extent, in rural areas. The mining boom in the decade up to 2007, however, seems to have blocked economic diversification towards non-primary sectors. The proliferation of new mining operations has had a large and negative impact on the share of the population working in non-mining and non-agricultural activities, which remained almost unchanged between 1993 and 2007 in NMDs compared to a growth by 3–5 percentage points in non-mining rural and urban areas of the common support. When we restrict the analysis to districts with a low level of corporate social spending, the effect on mining and agriculture labour share remains significant but smaller, while the impact on the remaining sectors is unchanged. These outcomes indirectly suggest that those areas that enjoyed a higher participation of mining companies in development and assistance projects might have been more able to exploit labour opportunities in mining, but CSR has not helped to trigger multiplicative effects on other sectors.
The risk of mining specialization with few spillovers for manufacturing and service sectors is confirmed by the results on the labour market. The reduction in the labour share of non-primary sectors is not accompanied by an expansion of labour and business opportunities able to respond to the growing labour supply. In rural areas of NMDs, we found significant positive impacts for the involvement of adults in economic activities and, in the considered period, the share of the rural population above 15 years and engaged in productive activities grew more in NMDs than in UDs. However, in urban areas the role of the mining boom in vitalising labour market was less evident with non-significant impacts on labour participation and unemployment.
New mining operations did not improve access to public services. In the period 1993–2007, the Highlands' rural areas saw considerable advances in access to water, electricity and, albeit to a lower extent, to sanitation services, but the mining boom in the decade up to 2007 did not accelerate this progress. Moreover, our results suggest that, so far, CSR has not helped to overcome bottlenecks in materialising these potential benefits: there is no sign of impact on access to basic services, not only when the analysis focuses on districts with low levels of corporate social expenditure, but also in the overall sample. These findings are in line with widespread concerns regarding the total amount of mining revenues (which has grown only recently) as well as their management and geographical concentration.
The mining boom seems to have contributed to the improvement of educational outcomes that many Highlands districts have achieved since the mid-1990s. We found a negative impact (albeit very small) on child labour and a positive effect on primary and secondary school attendance in rural areas. It is not easy to conclude whether this link is explained by changes in the demographic composition of district populations due to migration inflows, by greater financial resources for educational services and facilities, or by higher expected returns to education in the local labour market. However, it is worth observing that CSR might have enhanced the effect on primary and secondary school attendance since this impact, respectively, decreases or becomes non-statistically significant in the sample restricted to districts with low corporate social spending.
Finally, we estimated the mean impact of the mining boom on changes in poverty rates and on the welfare ratioFootnote 14 which is a proxy of the real per capita expenditure. PS-DD estimates of ATT are not significant in all the samples we considered. Therefore, the arrival of new mining firms did not lessen nor exacerbate the growth in poverty rates experienced by Highlands districts between 1993 and 2007.
9. Discussion of results and concluding remarks
The main impacts that the mining boom introduced into new mining areas are those related to demographic trends and to occupational distribution. Mining expansion has positively affected immigration inflows and has fostered a change in labour sectorial composition towards mining activities while producing a negative impact on the labour share of agriculture and non-primary sectors. Therefore, the opening of new mining operations can have a propulsive role for local economies but the main risk relates to falling into a trap of mining specialization with few links with other industries. In fact, the local employment effect of mining growth, at least so far, has also been negligible. A possible explanation is that the impact of mining development on employment opportunities is still incipient in new mining districts and it was not able to exceed the increase in labour supply associated with population growth and migration flows. However, it is also worth highlighting that we consider a rather protracted period and that descriptive evidence on districts with a long tradition of mining development is not encouraging: during the entire period of mining growth (1993–2007), the labour share of non-primary activities in old mining districts was higher than in the remaining districts, but it declined over time.
Our findings indicate that greater CSR may have increased opportunities for mining employment and attracted larger inflows of migrants, but it has largely failed to support local populations in taking advantage of business and labour opportunities that mining growth and its indirect effects could have opened in non-primary sectors. With the exception of slightly positive effects on school attendance in rural areas, our analysis does not allow us to draw definitive conclusions on the role of corporate social expenditure in enhancing the positive effects of mining activities on the economic status and living conditions of local populations. Despite the great emphasis on the potentialities of CSR practices, our results suggest that, if there is an effect, it is likely to be small and this interpretation is consistent with evidence of a great concentration of CSR spending in few districts.
It is clear that the main findings of this study relate to the impacts that do not emerge. Some of the most anticipated impacts are, indeed, ‘missing’: we found no sign of impacts on improvement in access to basic services and on some of the principal welfare indicators such as housing conditions, poverty rate and per capita real expenditure.
In conclusion, our results indicate a mismatch between the limited impact on several dimensions of wellbeing (employment, basic needs, poverty) and the indications of great expectations revealed by positive effects on demographic growth and share of immigrant population. This contrast not only implies a delay in the materialization of local potential benefits of mineral resource wealth, but may also have a role in fuelling conflicts between local communities, governments and mining firms. This risk is particularly high in countries with a long mining history such as Peru. Data limitations prevent us from identifying a good strategy for old mining districts. Thus, we refrained from estimating the effect of the recent mining boom in these areas, but the former history of mining exploitation reveals many episodes of environmental and health damage and the creation of economic enclaves (Ticci, Reference Ticci2007). In the absence of clear evidence of tangible benefits and outcomes, the consequent negative reputational effects of the mining industry are likely to have fostered a climate of hostility even if the new institutional contexts have helped to diminish or avoid the negative side-effects of mining activities that local communities have experienced in the past. In other words, Peru's efforts to follow international consensus and create an institutional environment in line with the international ‘sustainable mining’ agenda have given a positive but not conclusive contribution to building an inclusive local mining development. In the case of Peru, the reform of regulatory and legal frameworks seems not to have been sufficient to ensure that the extractive sector serves as a lever for local development. Further in-depth and country-specific research might help understand whether additional factors need to be considered, from ex ante conditions to conflicting and changing objectives of different stakeholders.
Supplementary materials and methods
The supplementary material referred to in this paper can be found online at journals.cambridge.org/EDE/.