


Scientist–practitioners have long endeavored to identify the precise regulatory mechanisms that trigger specific stress-related diseases of the mind and body. Prodigious progress over the last several decades has led to a rapidly growing stressdisease literature. The integrative allostatic load (AL) model stands as a testament to this progress and allows for the measurement of multisystemic physiological dysregulation exacted by chronic stress and unhealthy behaviors (McEwen & Stellar, Reference McEwen and Stellar1993). In this article, we propose that AL can be applied to further understand comorbidities related to stress pathophysiology.
Using the AL model as a framework, biological comorbidity is here conceptualized as an aggregate of physiological dysfunctions captured by measuring numerous biomarkers together in synergy as opposed to separately as is convention in biomedicine. This perspective recognizes the vast interindividual differences with respect to psychosocial stress exposure across life span development linked to a multitude of multisystemic pathways toward or against disease. In this article, we will integrate perspectives related to mitochondrial biology as a key player in the AL time course, epigenetics related to child maltreatment, and the evolution of distinct personalities and biobehavioral patterns as key considerations for the advancement of the AL model and the prediction of disease trajectories.
Equifinality and Multifinality in Stress Phenomena
At the epicenter of the stress-disease literature are perspectives related to equifinality and multifinality that are considered conceptual cornerstones of developmental psychopathology (Cicchetti, Reference Cicchetti, Beauchaine and Hinshaw2008). Equifinality refers to similar health outcomes that arise from different causes (Cummings & Worley, Reference Cummings and Worley2005). For example, imagine two adolescent girls where one suffers from depression and the other from conduct disorder. Equifinality proposes that these alternative psychopathological pathways can lead to later developing similar conditions. In one such study, girls with either depression or conduct disorder converged toward experiencing similar adversities (e.g., poorer education and early parenthood) and developing specific psychologies (e.g., anxiety disorder and substance abuse) in adulthood (Bardone, Moffitt, Caspi, Dickson, & Silva, Reference Bardone, Moffitt, Caspi, Dickson and Silva1996).
By contrast, multifinality describes the process by which similar causes lead to different health outcomes. As an example, it has been argued that the male-predominant development of antisocial personality disorder and the female-predominant development of borderline personality disorder may arise from similar ontogenic trajectories related to specific emotional regulatory mechanisms common to both psychopathologies (Beauchaine, Klein, Crowell, Derbidge, & Gatzke-Kopp, Reference Beauchaine, Klein, Crowell, Derbidge and Gatzke-Kopp2009). Equifinality and multifinality represent systems theories that force us to reconceptualize diversity in processes and outcomes in the life sciences. This framework also allows us to further refine our understanding of adaptation and maladaptation of developmental trajectories, and to move toward more comprehensive, nondeterministic models of health trajectories (Cicchetti & Rogosch, Reference Cicchetti and Rogosch1996).
The concepts of equifinality (different beginnings leading to the same outcome) and multifinality (different outcomes resulting from the same beginning) overlap with the advancement of the stress-disease literature. Stress is broadly defined as a real or interpreted threat to an individual's physiological and psychological integrity that results in biological and behavioral responses (McEwen & Seeman, Reference McEwen and Seeman1999). Theories of stress have a long history endeavoring to answer questions regarding (a) the nature of “stress,” (b) which “stressors” elicit which biological response patterns, (c) how to accurately predict specific physical and psychological outcomes, and (d) how overlapping processes interact to render individuals more or less susceptible to morbidity and comorbidities throughout life (Lupien et al., Reference Lupien, Ouelle-Morin, Hupback, Walker, Tu, Buss and Cicchetti2006). At the core of all stress-related diseases are adaptive biobehavioral responses that have evolved to ensure our survival, but that have ultimately become strained by cumulative overuse.
Neural Regulation of Stress Responses
The notions of equifinality and multifinality are crucial to understanding stress physiology. Stress response patterns lead to converging multisystemic processes that can diverge into a multitude of pathologies. At first, real or interpreted threats trigger the sympathetic–adrenal–medullary (SAM) axis to release catecholamines (e.g., adrenalin) within seconds from the adrenal medulla. Second, the hypothalamus–pituitary–adrenal (HPA) axis is activated within minutes to produce glucocorticoids. The paraventricular nucleus of the hypothalamus activates the HPA axis by stimulating corticotropin-releasing factor (CRF). CRF then travels through a portal system linking the hypothalamus to the pituitary, where it signals the secretion of adrenocorticotropin hormone (ACTH) from the anterior pituitary rich with blood capillaries. Systemic ACTH then travels to the adrenal cortex where it precipitates cellular activities in the zona fasticullata region of the adrenal cortex to produce glucocorticoids such as cortisol in humans that has catabolic effects (Sapolsky, Romero, & Munck, 2000).
The SAM and HPA axes mobilize energy necessary for adaptation, but at the cost of recalibrating many biological functions in turn (McEwen & Wingfield, Reference McEwen and Wingfield2003). Compensatory alterations during acute stress include decreased digestion and bodily growth/repair, counterbalanced to accommodate increased neurological, cardiovascular, respiratory, and immune activities that are metabolically taxing. For example, the HPA axis eventually inhibits the hypothalamus–pituitary–gonadal axis secretion of gonadal hormones (e.g., testosterone and estrogens) at the long-term detriment of reproductive functioning. By contrast, stress-induced hypothalamus–pituitary–gonadal axis activations have been shown in animals (Viau, Reference Viau2002), suggesting that possible coactivation with the SAM axis and HPA axis may occur under acute stress. Beyond these nonlinear peripheral effects, glucocorticoids also cross the blood–brain barrier where they modulate a wide variety of neural functions.
The brain's ultimate role during stress is to detect threat and promote adaptation. In addition to the pituitary and hypothalamic control of the HPA axis, there are three major brain structures involved in the regulation of stress responses: (a) the hippocampus linked to memory and cognition, in addition to being implicated in negative feedback regulation of the HPA axis; (b) the amygdala responsible for fear conditioning and emotional processing with outputs to SAM axis and neuroendocrine regulatory systems, and; (c) the prefrontal cortex involved in cognition, coping strategies, and exerting top-down control over subcortical structures (Gray & Bingaman, Reference Gray and Bingaman1996; McEwen, Reference McEwen2004; McEwen, Weiss, & Schwartz, Reference McEwen, Weiss and Schwartz1968; Reul & de Kloet, Reference Reul and de Kloet1985; Sanchez, Young, Plotsky, & Insel, Reference Sanchez, Young, Plotsky and Insel2000; Thayer & Lane, Reference Thayer and Lane2009). Glucocorticoid receptors are involved in negative feedback of the HPA axis under stress reactive conditions, while mineralocorticoid receptors are traditionally thought to be involved in basal HPA axis regulation (Goel, Workman, Lee, Innala, & Viau, Reference Goel, Workman, Lee, Innala and Viau2014).
Life Cycle Model of Stress
Fundamental to adaptation is the brain's evaluation of threat (Herman, Ostrander, Mueller, & Figueiredo, Reference Herman, Ostrander, Mueller and Figueiredo2005; McEwen, Reference McEwen2007) and execution of physiological responses that are influenced by inheritance and experience. Throughout lifespan development, the timing and duration whereby major stressors and/or traumas are experienced will profoundly affect neurological development linked to stress pathophysiology. The three aforementioned brain regions that are central to HPA axis regulation in humans attain development at different critical windows. First, the hippocampus attains complete maturation at age 2. Second, the prefrontal cortex is most plastic between the ages 8 to 14. Third, the amygdala continues to grow slowly until the late 20s (Giedd et al., Reference Giedd, Snell, Lange, Rajapakse, Casey and Kozuch1996; Yakovlev, Reference Yakovlev1967). As we age, these same brain regions become malleable at different moments that mirror these developmental windows (Lupien, McEwen, Gunnar, & Heim, Reference Lupien, McEwen, Gunnar and Heim2009).
Lupien et al. (Reference Lupien, McEwen, Gunnar and Heim2009) developed the life cycle model of stress to address heterogeneity in stress response patterns and psychopathologies. This model proposes that exposure to adversity and chronic stress during key critical periods can impair the development of these brain regions, particularly those that have not fully matured at the time of exposure (Lupien et al., Reference Lupien, McEwen, Gunnar and Heim2009). Ultimately, early life adversities in concert with genetic constitutions exert enduring effects on brain development linked to HPA axis functioning and diverse psychopathologies (McNeil, Cantor-Graae, & Weinberger, Reference McNeil, Cantor-Graae and Weinberger2000; Taylor, Way, & Seeman, Reference Taylor, Way and Seeman2011; van Erp et al., Reference van Erp, Saleh, Huttunen, Lonnqvist, Kaprio and Salonen2004; van Haren et al., Reference van Haren, Picchioni, McDonald, Marshall, Davis and Ribchester2004).
Lifelong brain changes ultimately diminish the organism's ability to adapt, leading to subtle recalibrations in stress responsivity that could be used to detect disease trajectories. According to the life cycle model of stress (Lupien, Ouellet-Morin, Herba, Juster, & McEwen, Reference Lupien, Ouellet-Morin, Herba, Juster, McEwen, Spengler and Binder2016), regional volumes of these neurological structures in conjunction to biological signatures (e.g., hypercortisolism vs. hypocortisolism) can be used to predict differential risk profiles for specific psychopathologies (e.g., depression vs. posttraumatic stress disorder) in adulthood as well as inform when certain traumas might have occurred in early life (Lupien et al., Reference Lupien, McEwen, Gunnar and Heim2009). While direct measurement of central nervous system substrates are costly and potentially invasive, indirect assessment using peripheral biomarkers routinely collected in biomedical practice and the discovery of emergent biomarkers may prove helpful. Such an approach allows scientist–practitioners to infer the temporal pathophysiological cascades of specific stress-related diseases of adaptation.
Allostasis
Sterling and Eyer coined the term allostasis to describe the adaptive biological processes that preserve “stability through change” (Sterling & Eyer, Reference Sterling, Eyer, Fisher and Reason1988). Allostasis is essentially the dynamic and multifaceted biological processes that maintain stability of physiological systems via recalibration of homeostatic parameters to meet the demands of the environment (Sterling & Eyer, Reference Sterling, Eyer, Fisher and Reason1988). The SAM and HPA axes stress responses are examples of allostasis. Transcending homeostatic feedback loops, allostatic mechanisms represent whole-body adaptation to contexts (Schulkin, Reference Schulkin2003) that alters physiological functioning via compensatory and anticipatory mechanisms controlled by the brain (Ganzel, Morris, & Wethington, Reference Ganzel, Morris and Wethington2010). Health in allostatic theory is thus defined as optimal predictive fluctuation whereby shifts in the probability or anticipation to environmental demands optimize biobehavioral responses.
In their view, Sterling and Eyer felt that homeostatic principles did not adequately explain how organisms adapt to physical or psychological demands imposed by the environment. Homeostatic models generally define health as an internal milieu whereby all physiological parameters have relatively “normal” values. In contrast, disease occurs when physiological parameters fall into “abnormal” ranges. Sterling and Eyer reasoned that focusing on homeostatic set points and endpoints but not on checks and balances among coordinated physiological activities makes it difficult to understand how adaptive processes can become maladaptive when overused. In the context of stress physiology, physical and psychosocial stressors are multisystemic processes that act through many filtered layers of positive/negative feedbacks (Kagan & Levi, Reference Kagan and Levi1974; Le Moal, Reference Le Moal2007) that are exquisitely dynamic.
Allostatic regulatory systems interact in a hierarchical and nonlinear manner. This concept is informative in understanding diverse morbidities and comorbidities that must be conceptualized across time. In response to stressors, for example, individuals will engage in compensatory behaviors to optimize adaptation (Sterling & Eyer, Reference Sterling, Eyer, Fisher and Reason1988). From this perspective, health behaviors can be considered as “higher order” allostatic mechanisms activated in reaction to external and internal cues. Unhealthy behaviors (e.g., smoking or overeating) are often enacted to counteract, for instance, negative affective states related to predispositions. Despite their purpose as behavioral compensatory mechanisms, unhealthy behaviors due to distress have the propensity of increasing pathophysiology even further and potentiating further disease(s).
The concept of allostasis is also useful for understanding biological comorbidities at a multisystemic level. According to allostatic theory, pathology itself is the end product of adaptive processes that have become malfunctional. For instance, an individual may develop chronic hypertension due to a recalibration of cardiovascular functioning in order to meet the demands of a stressful environment. However, over time this may promote further pathology in the form of arterial stiffening, coronary artery calcification, or aneurism as cardiovascular disease(s) progress. Given the multifaceted nature of stress pathophysiology and the fact that stress hormones can modulate essentially every living cell, numerous stress-related diseases can develop simultaneously.
Returning to our example, a chronically distressed individual who progresses from hypertension to more severe cardiovascular diseases may develop psychiatric symptoms that appear distinct from their heart health, but that are interconnected with stress pathophysiological processes. For example, it has been speculated that a common pathway can explain higher comorbidity of depression among women with cardiovascular disease (Moller-Leimkuhler, Reference Moller-Leimkuhler2010). Moreover, gender-related biological and psychosocial factors linking comorbid depression and cardiovascular disease are related to a myriad of overlapping factors like smoking, treatment noncompliance, hypertension, hypercholesterolemia, obesity, diabetes, HPA axis dysfunction, and immune functioning (Joynt, Whellan, & O'Connor, Reference Joynt, Whellan and O'Connor2003) that are increasing internationally among women (Moller-Leimkuhler, Reference Moller-Leimkuhler2010). This perspective departs from traditional definitions of comorbidities as etiologically distinct disease processes and is reflected in our use of the term biological comorbidities throughout this article.
In our perspective of biological comorbidities, comorbid conditions can coexist independently, dependently, or the first condition might predispose to the second condition without necessarily being causal (Anisman & Hayley, Reference Anisman and Hayley2012; Valderas, Starfield, Sibbald, Salisbury, & Roland, Reference Valderas, Starfield, Sibbald, Salisbury and Roland2009). In addition, comorbidity can give rise to biological signatures that may not be specific to any one disease. For example, elevated cytokines are common to depression, cardiovascular disease, Parkinson disease, and even some cancers (Anisman & Hayley, Reference Anisman and Hayley2012). All of these complexities render comorbities challenging to pinpoint precisely. Beyond biological processes specific to any one individual, the social environment can also influence allostatic mechanisms. This is a critical confounder in our views of comorbities that often fail to consider social contexts.
In proposing allostasis, Sterling and Eyer (Reference Sterling, Eyer, Fisher and Reason1988) attempted to explain how organisms reestablish homeostasis in the face of stressful environments. The process of recalibrating homeostasis occurs in the context of demanding social conditions. Using blood pressure as an example, Sterling and Eyer questioned why chronically stressed rats or monkeys do not always return to a homeostatic “average” level when experimental stressors are removed. They argued that this happens because elevated blood pressure is matched or fluctuates to help cope with environmental demands such as social adversities (Sterling & Eyer, Reference Sterling, Eyer, Fisher and Reason1988). Moreover, individual differences in a myriad of interacting risk and protective factors further influence health and well-being within psychosocial contexts. For example, coping behaviors represent subsidiary allostatic mechanisms that compensate for dysfunction, but potentially at the expense of long-term health when damaging (e.g., smoking and excessive alcohol).
Sterling and Eyer (Reference Sterling, Eyer, Fisher and Reason1988) were particularly interested in age-related changes in blood pressure and differences according to socioeconomic strata. They argued that the principles of homeostasis could not explain changes in blood pressure throughout the life span, nor could there be any absolute homeostatic set points giving diurnal variations. For example, a prospective study showed that poor housing quality, Black race/ethnicity, and low positive caregiving behavior was related to amplified HPA axis activity from age 7 to 48 months (Blair et al., Reference Blair, Raver, Granger, Mills-Koonce and Hibel2011). Sterling and Eyer (Reference Sterling, Eyer, Fisher and Reason1988) speculated that under conditions of increasing social demands (e.g., entering school age), the blood pressure of children increases with age in order to calibrate functioning to environmental demands.
Ultimately, it is when allostasis is chronically dysregulated that pathophysiological processes emerge. A major challenge is determining which allostatic mechanisms are predictive of specific pathologies and how these translate into morbidity of a specific organ system or of multiple organ systems simultaneously. One approach involves assessing dynamic functions of specific stress-related biomarkers over time to capture distinct biological signatures in line with the life cycle model of stress (Lupien et al., Reference Lupien, McEwen, Gunnar and Heim2009).
Allostatic states
Allostatic states reflect response patterns in which specific allostatic systems are dysregulated. As illustrated in Figure 1, four potential pathophysiological profiles representing allostatic states have been outlined (McEwen, Reference McEwen1998). First, repeatedly activated responses refer to too much stress in the form of repeated, uncontrollable events that cause cumulative elevations of stress mediators (e.g., adrenalin or cortisol) over sustained periods of time. Second, nonhabituating responses refer to failure to habituate or adapt to the same stressor that leads to the overuse of stress mediators because of the failure of the body to dampen or eliminate the hormonal stress response to repeated events. Third, prolonged responses represent a failure to shut off either the hormonal stress response or to display the normal trough of the circadian patterns. Fourth, inadequate responses represent hypoactive stress responses that may involuntarily allow other systems, such as inflammation, to become hyperactive. Allostatic states therefore reflect response patterns in which physiological systems become over- or underactive.
Allostasis, allostatic states, and allostatic load. (cf. McEwen, Reference McEwen1998).

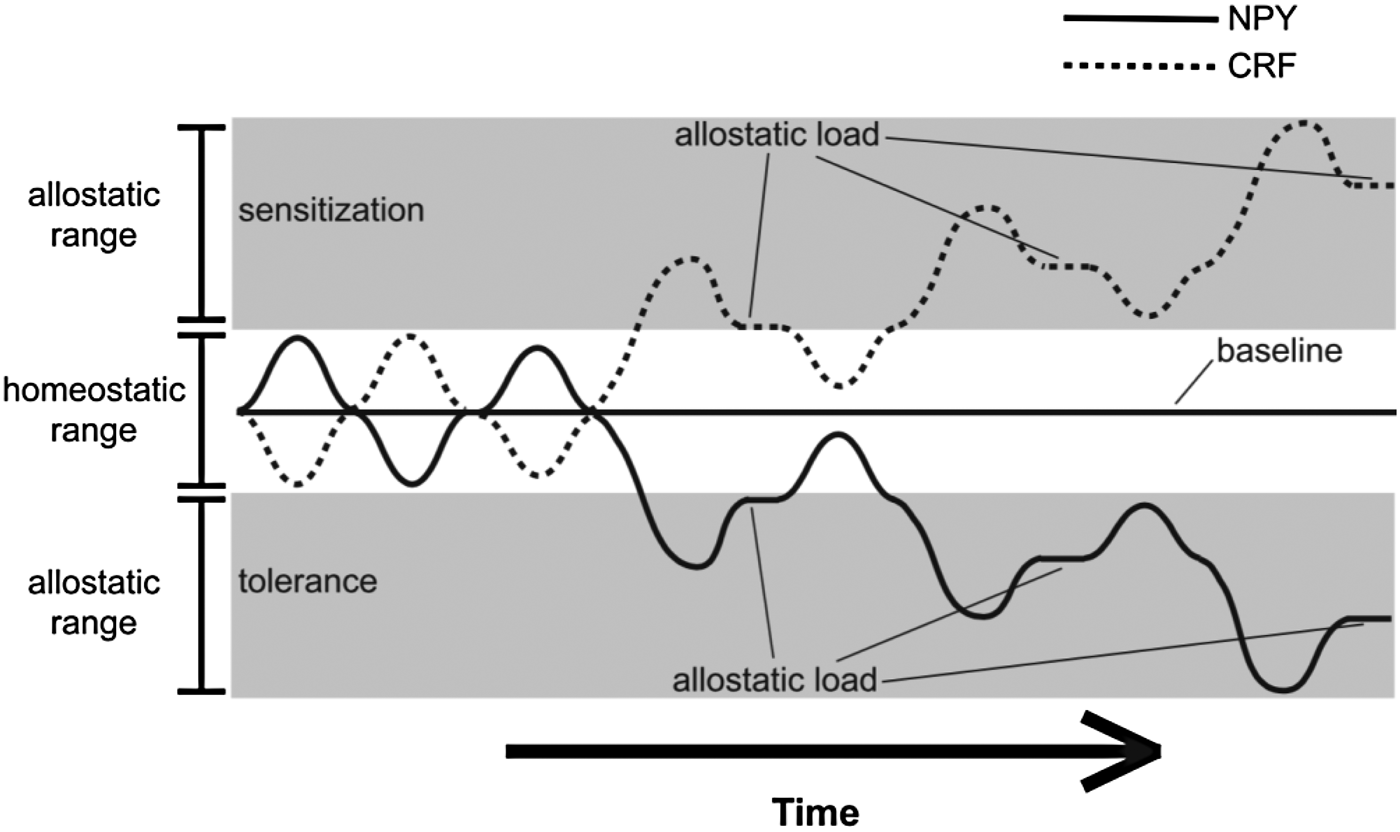
Allostatic states were originally conceptualized by Koob and Le Moal (Reference Koob and Le Moal2001) to understand physiological dysregulations that occur with drug and alcohol abuse. A study by Valdez and Koob (Reference Valdez and Koob2004) suggests that dysregulations between CRF and the anxiolytic neuropeptide Y (NPY) is linked to alcoholism. Elevated CRF levels may propel alcoholic behaviors to reduce distress and increase NPY levels associated with reward. This relation is an excellent example of how a transitory allostatic state can materialize into chronic pathophysiology as the system succumbs to strain. Over time and chronic abuse, this process becomes a physiological necessity and source of dysregulation as tolerance and sensitization occur (Valdez & Koob, Reference Valdez and Koob2004). Figure 2 depicts the cyclic wave relation between CRF and NPY. This dynamic pathophysiological process occurs simultaneously in multiple systems in combination. Demarcating such patterns brings us one step closer to our objective to determine specific disease pathways.
Dysregulation of neuropeptide Y (NPY) and corticotropin-releasing factor (CRF) systems following chronic alcohol use as examples of allostatic states (Valdez & Koob, Reference Valdez and Koob2004). In the context of alcoholism, initial increases in NPY and decreases in CRF become blunted through sensitization and tolerance processes. As time progresses, this allostastic state becomes an allostatic load as the allostatic ranges of NPY and CRF become increasingly dysregulated.
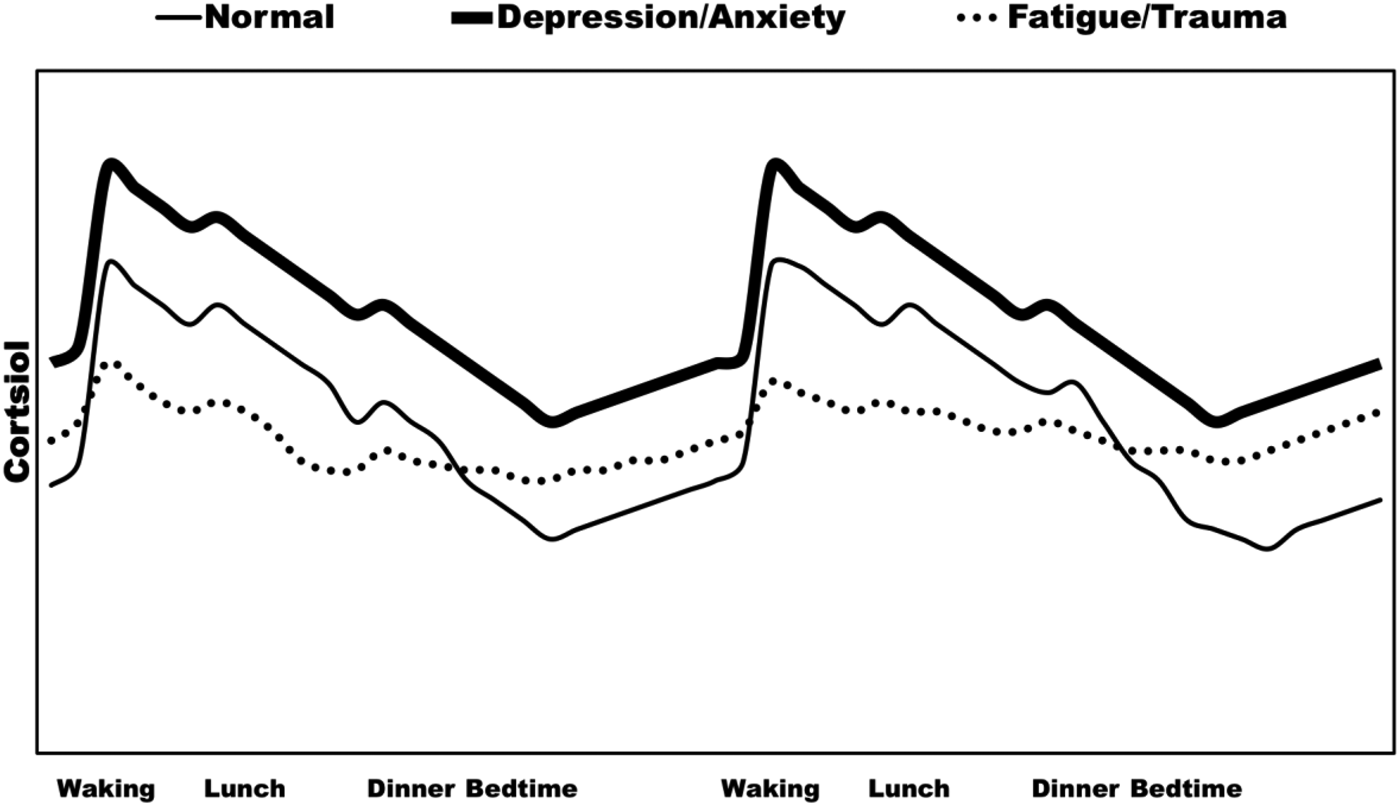
Another example of allostatic states are abnormalities in diurnal HPA axis functioning that can be used to identify disease vulnerabilities. As hypothetically illustrated in Figure 3, a meta-analysis of 62 studies concluded that the cortisol awakening response, a normal circadian mechanism that metabolically prepares us for the day, is positively associated with workplace stress and general life stress, but is otherwise negatively associated with symptoms of burnout, fatigue, and exhaustion (Chida & Steptoe, Reference Chida and Steptoe2009). Hypocortisolism is a phenomenon that occurs in approximately 20%–25% of patients suffering from stress-related diseases like chronic fatigue syndrome, fibromyalgia, posttraumatic stress disorder, burnout (Juster, Seeman, et al., Reference Juster, Bizik, Picard, Arsenault-Lapierre, Sindi and Trepanier2011; Marchand, Juster, Durand, & Lupien, Reference Marchand, Juster, Durand and Lupien2014), and atypical depression to name a few (Fries, Hesse, Hellhammer, & Hellhammer, Reference Fries, Hesse, Hellhammer and Hellhammer2005). By contrast, increased HPA axis functioning during the afternoon and evening has likewise been associated with depressive symptoms (Deuschle et al., Reference Deuschle, Schweiger, Weber, Gotthardt, Korner and Schmider1997; Muhtz, Zyriax, Klahn, Windler, & Otte, Reference Muhtz, Zyriax, Klahn, Windler and Otte2009). Stress scientists endeavor to identify patterns of multiple biomarkers that maximally predict specific disease trajectories.
Hypothetical diurnal cortisol profiles in normal and psychopathological conditions.
Methods to detect allostatic states with stress hormones can include investigating biomarker dynamics in the context of natural diurnal variation, reactive profiles with experimentally applied stressors, and/or pharmacological challenges. “Stressing” or challenging organisms allows us to demarcate mechanisms of biological redundancy and compensatory mechanisms that maintain allostatic states. Stress responses are energetically taxing (Goldstein & Kopin, Reference Goldstein and Kopin2007) and may be uniquely understood under conditions of distress where the organism is perturbed. Despite the general definition of an endophenotype as a state-independent process, it has been argued that it is specifically when allostatic mechanisms are challenged that specific biological signatures emerge (Anisman & Hayley, Reference Anisman and Hayley2012). Over time, allostatic states prompt compensatory recalibrations among numerous biomarkers. This makes delineating time courses of dysregulation difficult when attempting to determine which players falter first in the multiple paths toward stress-related pathology (McEwen, Reference McEwen2008).
AL
Multiple biological systems are interconnected to promote adaptation. When allostatic mehanisms are cumulatively activated, this multisystemic coordination becomes a strain known as AL (McEwen & Stellar, Reference McEwen and Stellar1993). AL is defined as the multisystemic “wear and tear” the brain and body experience when repeated allostasis and allostatic states exact their harmful toll under conditions of cumulative strain (Figure 1). Because the brain plays a central role in coordinating allostatic processes (McEwen, Reference McEwen2007), brain changes associated with AL (e.g., synaptic and dendritic remodelling, suppressed neurogenesis, and structural atrophy/hypertrophy) further diminish the organism's ability to adapt.
The AL model integrates multiple knowledge bases. At the center of AL is the coordination of allostasis that depends on the brain's evaluation of threat and execution of physiological responses (Herman et al., Reference Herman, Ostrander, Mueller and Figueiredo2005; McEwen, Reference McEwen2007, Reference McEwen2008). The perception of threat and mobilization of allostatic mechanisms (e.g., stress responses) are further shaped by individual differences in constitutional (e.g., (epi)genetics, development, and experience), behavioral (e.g., coping and health habits), and historical (e.g., trauma/abuse, major life events, and stressful environments) factors (Juster, McEwen, & Lupien, Reference Juster, McEwen and Lupien2010; McEwen, Reference McEwen1998). Over time, chronic stress and AL can perpetuate or exacerbate unhealthy behaviors (e.g., poor sleep, diet, smoking, drinking, and physical inactivity) that eventually lead to allostatic overload that culminates in disease outcomes (McEwen & Wingfield, Reference McEwen and Wingfield2003).
AL time course
The AL model postulates that stress-related pathophysiology can be detected and objectively measured by assessing a battery of subclinically relevant biomarkers that are routinely collected in medical practice (McEwen & Seeman, Reference McEwen and Seeman1999). It has been proposed that under chronic stress, stress hormones like catecholamines and cortisol first become misbalanced and induce an interconnected domino effect on interdependent biological systems that collectively collapse as individual biomarkers “topple and trail” toward disease (Juster, Bizik, et al., Reference Juster, Bizik, Picard, Arsenault-Lapierre, Sindi and Trepanier2011). Numerous biomarkers contribute to further AL and eventual allostatic overload. This is the ultimate tipping point in the theoretical sequence embodied in our domino effect analogy.
Understanding AL interconnectivity may be crucial for predicting biological comorbidities. A key principle of the AL model is that multiple mediators of adaptation are involved and interconnected in a nonlinear network. Each mediator system produces biphasic effects and is regulated by other mediators, often in reciprocal fashion, leading to nonlinear effects upon many organ systems of the body (McEwen, Reference McEwen2009). For example and as mentioned earlier, cortisol suppresses the production of inflammatory mediators over time. Using our domino effect analogy, prolonged secretion of stress hormones like adrenaline and cortisol can lead to desensitization, and thus falter in their ability to protect the distressed individual and instead begin to simultaneously damage the brain and other organ systems (Juster, Bizik, et al., Reference Juster, Bizik, Picard, Arsenault-Lapierre, Sindi and Trepanier2011). Stress hormones and their antagonists (e.g., dehydroepiandrosterone), in conjunction with pro- and anti-inflammatory cytokines (e.g., tumor necrosis factor-α [TNFα], and interleukin-10) represent the AL biomarkers referred to as the primary mediators (McEwen, Reference McEwen1998).
Synergistic effects of primary mediators exact primary effects on cellular activities (enzyme activities, receptor signalling, ion channel transport, and gene expression changes) that compromise the physiological integrity of allostatic mechanisms. This form of subcellular AL is the gatekeeper linking primary mediators toward increasing downstream multisystemic dysregulation. As will be discussed in a later section, mitochondrial dysfunction, oxidative stress, and inflammation represent interconnected cellular consequences of the hyperglycaemic effect that stress hormones exact on peripheral organ systems. Together, this leads to further AL at a subcellular level that we define as primary outcomes (Picard, Juster, & McEwen, Reference Picard, Juster and McEwen2014).
Over time, subsidiary biological systems compensate for the over- and/or underproduction of primary mediators/effects/outcomes and in turn shift their own operating ranges to maintain abated chemical, tissue, and organ functions. This prodromal stage is referred to as the secondary outcomes, whereby metabolic, cardiovascular, and immune parameters reach subclinical levels. It is at this level of analysis that we can consider the origins of biological comorbidity and the detection of downstream effects that originate with faltered primary mediator functioning. Finally, AL progression leads to allostatic overload (McEwen & Wingfield, Reference McEwen and Wingfield2003) and tertiary outcomes that include stress-related diseases typically regarded as unrelated from the point of view of their macroscopic clinical presentation.
Indexing AL: Research Approaches and Clinical Applications
Traditional sample-based AL index
The AL model proposes that by measuring the multisystemic, reciprocal interactions of stress mediators, individuals at high risk of clinical outcomes can be identified (McEwen, Reference McEwen1998; Picard, Juster, et al., Reference Picard, Juster and McEwen2014). The measurement of AL combines multisystemic information to predict stress-related diseases that may otherwise not be detected using clinical cutoffs for single biomarkers. Developed initially as a tool to predict tertiary outcomes in older adults, Seeman, Singer, Rowe, Horwitz, and McEwen (Reference Seeman, Singer, Rowe, Horwitz and McEwen1997) pioneered the first operational definition of AL using the MacArthur Studies on Successful Aging cohort, which led to a count-based AL index representing the following 10 biomarkers: 12-hr urinary cortisol, adrenalin, and noradrenalin output; serum dehydroepiandrosterone-sulfate (DHEA-s), high-density lipoprotein (HDL), and HDL to total cholesterol ratio; plasma glycosylated hemoglobin (HbA1c); aggregate systolic and diastolic blood pressures; and waist to hip ratio.
The AL index represents the number of dysregulated biomarkers within a collected array. Cutoffs are determined according to participants' values that cross a high-risk percentile. For example, biomarkers in which higher levels are problematic (e.g., HbA1c and blood pressure) use the 75th percentile as a cutoff, while the 25th percentile would be used when lower levels are problematic (e.g., DHEA-s and albumin). Such cutoffs were originally based on the biomarker distributions for an entire sample. Once tabulated using a binary system (e.g., 1 = high risk, 0 = normal), the AL index is calculated by adding all biomarker codings that could range from a possible 0 to 10 (based on 10 biomarkers) and then used to predict health outcomes. Beyond these traditional MacArthur biomarkers, many others have been incorporated into numerous analyses worldwide using similar count-based formulations. This simplicity makes indexing AL amenable to both empirical and clinical contexts (Juster & Lupien, Reference Juster, Lupien, Schenck-Gustafsson, DeCola, Pfaff and Pisetsky2012).
Previous reviews (Beckie, Reference Beckie2012; Juster, Bizik, et al., Reference Juster, Bizik, Picard, Arsenault-Lapierre, Sindi and Trepanier2011; Juster et al., Reference Juster, McEwen and Lupien2010) indicate that increased AL indices are associated with a multitude of causes like socioeconomic disadvantage, poor social networks, workplace stress, and lifestyle behaviors as well as a multitude of consequences like all-causes mortality, cardiovascular disease, psychiatric symptoms, cognitive decline, physical/mobility limitations, and neurological atrophy. The most consistent cause of elevated AL is increased age. This is critical for conceptualizing comorbidities and chronic diseases more generally that also increase as we age. Given wide variation in successful or unsuccessful aging in the context of multiple life domains, age alone is inadequate to represent an individuals' morbidity burden (Karlamangla et al., Reference Karlamangla, Tinetti, Guralnik, Studenski, Wetle and Reuben2007; Yancik, Ganz, & Varricchio, Reference Yancik, Ganz, Varricchio and Conley2001). As a consequence of this assertion and a growing interest in this booming literature, AL can be indexed throughout the life cycle and at increasingly younger ages than originally proposed. This has important implications not only in terms of research but also in clinical practice as detection and prevention strategies are further developed.
Clinical population-based AL index
Contrary to the general medical contention that tissue-specific alterations lead to tissue-specific disease, we propose that allostatic states induce primary effects systemically across cell types and organ systems, thereby explaining the co-occurrence of multiple disease conditions or comorbidities. Medical professionals routinely incorporate biomarkers of secondary outcomes (e.g., glycolipid profiles and blood pressure) in standard examinations; however, attention is largely placed to values reaching clinically significant levels (Bizik et al., Reference Bizik, Picard, Nijjar, Tourjman, McEwen and Lupien2013) without assessment of primary mediators, effects, and outcomes. This then leads to dysregulation of secondary outcomes like lipid profiles, cardiovascular functioning, and glucose metabolism. In reality, the secondary outcomes in the AL time course represent the biomarkers traditionally used in biomedicine to signal high risk of specific diseases (e.g., diabetes or cardiovascular disease).
Delineating the time course whereby specific allostatic biomarkers become collectively dysregulated could be of tremendous value in predicting not only biological comorbidities secondary to a primary physical diagnosis but also comorbidities secondary to a primary psychiatric diagnosis. For example, patients with severe mental disorders are prone to comorbidities (e.g., cardiovascular disease and metabolic syndrome) related to preexisting risk factors (e.g., substance abuse) and/or treatment side effects (e.g., cognitive impairment). We believe that these processes can be proactively prevented by accounting for multisystemic dysregulations by measuring AL (Bizik et al., Reference Bizik, Picard, Nijjar, Tourjman, McEwen and Lupien2013). The development of AL algorithms in clinical settings represents the next frontier of the AL model and will allow for the detection of individuals at risk of stress-related morbidities and biological comorbidities.
Our group has developed an AL formulation tailored for clinical practice with cutoffs based on population norms rather than those of a given sample as is traditionally done in the AL literature (Juster, Sindi, et al., Reference Juster, Sindi, Marin, Perna, Hashemi and Pruessner2011). This approach was first reported in a comparative analysis using a population-based Taiwanese aging cohort that showed only modest differences in various permutations of AL algorithms (Seplaki, Goldman, Glei, & Weinstein, Reference Seplaki, Goldman, Glei and Weinstein2005). The following will demonstrate a simple formulation to calculate an AL index based on clinical reference ranges used routinely for diagnostic purposes in biomedical practice.
Let us consider as an example total cholesterol with a normal range between 3.3 and 5.2 nmol/l (Juster & Lupien, Reference Juster, Lupien, Schenck-Gustafsson, DeCola, Pfaff and Pisetsky2012). To determine the range, subtract the lower limit from the upper limit (5.2 – 3.3 = 1.9). To determine the quartile, divide the range by four (1.9 ÷ 4 = 0.475). To finally determine the cutoff, either subtract the quartile from the upper limit for the upper cutoff (5.2 – 0.475 = 4.725) or add the quartile to the lower limit for the lower cutoff (3.3 + 0.475 = 3.775) in the case of biomarkers like HDL cholesterol, DHEA-s, and albumin, whereby lower levels denote danger. Based on this example, a patient with total cholesterol at 4.725 nmol/L or higher would get a score of “1” while values below this would be scored as “0.”
In summary, a clinical AL index is the sum of a person's dysregulated biomarkers. Figure 4 provides a description of how this is done for multiple biomarkers and alternative approaches when norms do not exist. AL indices can also serve as a starting point for a discussion between patients and health care practitioners regarding adaptive behaviors and prevention of the development of negative sequalae related to the illness and its treatment (Bizik et al., Reference Bizik, Picard, Nijjar, Tourjman, McEwen and Lupien2013). Previous reports have shown that a clinical AL index was associated with increased subjective reports of chronic stress, frequency of burnout symptoms, as well as hypocortisolemic profiles characteristic of fatigue states (Juster, Bizik, et al., Reference Juster, Bizik, Picard, Arsenault-Lapierre, Sindi and Trepanier2011). Using a clinical formulation may also be helpful when studying young samples or those with biomarker values that are unknown (e.g., sexual minorities compared to heterosexual individuals; Juster et al., Reference Juster, Hatzenbuehler, Mendrek, Pfaus, Smith and Johnson2015). While this formulation is designed for medical practice, it does not yield cutoffs that are exceedingly different from those based on biomarker distributions based on sample distributions generally used in empirical AL studies (Seplaki et al., Reference Seplaki, Goldman, Glei and Weinstein2005).
Clinical approach to calculating and interpreting allostatic load indices (Bizik et al., Reference Bizik, Picard, Nijjar, Tourjman, McEwen and Lupien2013). Upon identifying patients at high risk of developing comorbidities, an allostatic load index can be easily calculated based on clinical norms for biomarkers routinely collected. The 14 biomarkers listed here are examples from a previous study of workplace stress that introduced our clinical allostatic load index formulation (Juster, Sindi, et al., Reference Juster, Sindi, Marin, Perna, Hashemi and Pruessner2011). In the formulation used here, a one-tailed approach is applied using either the lower limit or the higher limit to denote risk. However, for some biomarkers, such as serum cortisol, as measured here, a two-tailed approach could be set at the 12.5th and 87.5th percentile to denote risk attributable to hypo- and hypercortisolism. The asterisk is used to denote that the clinical norms will change according to the biochemical assays used and the vehicle (e.g., plasma, serum, saliva, urine, or hair).

Calculating a clinical AL index to monitor biological comorbidities could also help identify specific systems associated with unique clinical manifestations and to then tailor appropriate interventions and/or monitor progress over time. In our quest to refine understanding of individual differences in health and disease, ascribing sex-specific cutoffs to clinical norms would be most beneficial in advancing gender medicine (Juster et al., Reference Juster, Preussner, Desrochers, Bourdon, Durand and Wanin press). This approach recognizes that men and women have different constitutions and will therefore show different responses to specific treatments. Moreover, it is important to note that many AL biomarkers such as cortisol and cytokines do not have established norms for either sex, and this needs to be rectified.
To date and to the best of our knowledge, it is not yet known what constitutes critical levels of AL and how this can be used to predict specific conditions and comorbidities in clinical settings. For example, does an AL score greater than 5 represent a critical threshold for developing cardiovascular disease and which biomarkers are most important? Is the overall AL score more meaningful than the combination of individual biomarkers or systemic clusters? Does this vary between individuals over time, and how long before it reaches dangerous levels? As the AL literature grows, this issue of specificity will continue to be a priority area. This may require alternative approaches to measuring multisystemic dysregulations by focusing on precise biological signatures beyond composite indices and the discovery of emergent mechanisms.
AL is capturing complex interactions that cannot be easily deduced until clinical research is conducted. Data collected in clinical practice by various health professionals could be compiled and explored in relation to AL levels juxtaposed to psychosocial, behavioral, and treatment-related factors. While this could be especially informative for the development of comorbidities, the potential to further identify the biological signatures of specific psychopathologies is also possible (Juster, Bizik, et al., Reference Juster, Bizik, Picard, Arsenault-Lapierre, Sindi and Trepanier2011).
As we advance biomedical detection strategies, it will be increasingly possible to collect biomarkers from the periphery that inform us of central nervous system activities (e.g., brain-derived neurotrophic factor [BDNF] discussed in a later section). This mind–body connection therefore represents a promising avenue to advance more integrative clinical approaches. Given that the AL model is ideally suited for the early detection of disease and comorbidities, it must therefore become accessible to health care professionals (Juster, Bizik, et al., Reference Juster, Bizik, Picard, Arsenault-Lapierre, Sindi and Trepanier2011). This could address research that has centered on which biomarkers are maximally predictive of specific disease trajectories or recurrence as well as the identification of biological signatures that can inform health care providers on appropriate individualized treatment strategies (Anisman & Hayley, Reference Anisman and Hayley2012).
Pharmacological AL
Pharmacological AL (Juster, Bizik, et al., Reference Juster, Bizik, Picard, Arsenault-Lapierre, Sindi and Trepanier2011) refers to the adverse effects that medications can exert that can inadvertently prompt individuals to remediate the biological system(s) affected by unhealthy means. For example, smoking is often used to dampen adverse side effects of antipsychotic medications, but smoking further amplifies AL levels and can exacerbate comorbid trajectories. Such behavioral “side effects” represent maladaptive allostatic mechanisms whereby patients strive to reregulate medicinally altered neurotransmitter functions linked, for instance, to cognition and motivation. Unhealthy compensatory behaviors may be used to reregulate the alteration of reward mechanisms that are modulated by the dampening of pharmacological agents (Bizik et al., Reference Bizik, Picard, Nijjar, Tourjman, McEwen and Lupien2013).
The concept of pharmacological AL shows particular promise in the AL literature on health behaviors linked to biological comorbidities that are secondary to severe mental illness (Figure 5). For example, antipsychotic treatment is linked to three major neurochemical effectors of pharmacological AL due, in part, to dopaminergic, acetylcholinergic, and opioidergic systems (for reviews, see Bizik et al., Reference Bizik, Picard, Nijjar, Tourjman, McEwen and Lupien2013; Juster, Bizik, et al., Reference Juster, Bizik, Picard, Arsenault-Lapierre, Sindi and Trepanier2011). In this model, patients with severe mental illness may damagingly engage in unhealthy behaviors (e.g., smoking) in order to counteract the effects medications have on these systems. To further understand comorbid manifestations among psychiatric patients more broadly, refined biomarker approaches are needed (Anisman & Hayley, Reference Anisman and Hayley2012). The concept of allostasis represents a useful way to identify interindividual predispositions among common mechanisms that ultimately contribute to stress-related outcomes.
Pathways to comorbidity and mortality in schizophrenia and bipolar disorder (Bizik et al., Reference Bizik, Picard, Nijjar, Tourjman, McEwen and Lupien2013). Central to every domain depicted are the direct and indirect effects of chronic stress and concomitant mediators of allostatic load.

AL and complexity systems theory
AL is a complex system. Specifically, it is a nonlinear, emergent, self-organizing, multidimensional, multilevel, multisystems, and network-based construct (Buckwalter et al., Reference Buckwalter, Castellani, McEwen, Karlamangla, Rizzo and John2015). Given issues related to which biomarker panel to incorporate in order to maximally predict specific diseases, the limitations of binary perspectives that often accompany the use of a composite AL index, the multiple synergistic factors related to AL cumulative health risk, and the differential expression among diverse groups, Buckwalter et al. (Reference Buckwalter, Castellani, McEwen, Karlamangla, Rizzo and John2015) recently employed case-based computational modeling of AL to assess clinically relevant risk profiles.
The research group used cross-sectional data for 20 standard AL biomarkers from the Midlife Development in the United States and MacArthur Midlife Research Network cohorts. Nine AL clinical profiles were reduced and further contrasted to 23 circumscribed medical conditions that differed between men and women. Specifically, women were overrepresented on low stress biomarkers such as peak airway flow, DHEA-s, and insulin-like growth factor and overall healthy profile clustering around the centroid, and low stress hormones. By contrast, men were overrepresented on high blood pressure, metabolic syndrome parameters, high stress hormones, and high blood sugar (Buckwalter et al., Reference Buckwalter, Castellani, McEwen, Karlamangla, Rizzo and John2015). This clinical approach based on complexity theory might be useful in the prediction of comorbidities during aging.
Comorbidity nosology and AL
Within an expanded AL framework, biological comorbidities can be conceptualized as the sum total of physiological dysregulations that an individual accrues that need not be clinically manifest. Using a comorbidity nosology adapted from the World Health Organization International Classification of Functioning, Disability, and Health (World Health Organization, 2002), Karlamangla et al. (Reference Karlamangla, Tinetti, Guralnik, Studenski, Wetle and Reuben2007) proposed a system that assesses the functional severity, from protective zones to severe dysfunction, for several domains (e.g., coronary blood flow and blood pressure) from several physiological systems in order to multidimensionally measure comorbidities in older adults (Karlamangla et al., Reference Karlamangla, Tinetti, Guralnik, Studenski, Wetle and Reuben2007).
Specifically, 13 systems for comorbidity assessment are listed each with its own subdomains of functioning: mental functions, sensory functions and pain, voice and speech functions, cardiovascular, haematological, immunological, respiratory, digestive, metabolic, endocrine, genitourinary and reproductive/sexual, neuromusculoskeletal and movement functions, and skin (Karlamangla et al., Reference Karlamangla, Tinetti, Guralnik, Studenski, Wetle and Reuben2007; World Health Organization, 2002). The range of function falls along a continuum that can include clinical indices (e.g., bone mineral density, fasting blood glucose, cardiac output), distinct categories (e.g., normal flow, atypical electrocardiography, angina pectoris) or some combination of the two; Karlamangla et al., Reference Karlamangla, Tinetti, Guralnik, Studenski, Wetle and Reuben2007). This is a promising approach that will need to be explored prospectively using clinical research approaches aimed at delineating specific clusters related to overlapping disease profiles.
It is critical that the subclinical processes that predict morbidity and comorbidity cannot be subsumed easily using any single measure. This underlines the complexity of AL within a multisystemic network that further speaks to the complexities of discerning morbidity and comorbidity. With this mind, we turn our attention next to the subcellular processes whereby chronic stress “gets under the skin” and develop the concept of mitochondrial AL (MAL) as the next frontier in research innovation that aims to better predict specific disease outcomes.
Subcellular Mechanisms of Multimorbidity: MAL
Researchers have long attempted to resolve the subcellular mechanisms underlying the damaging health effects of stress (patho)physiology. Throughout the evolution of the AL model, a persistent conundrum has been the lack of understanding regarding “primary effects” of the AL time course. At the cellular level, it remains unclear how stress-induced primary mediators such as corticosteroids, catecholamines, glucose, and lipids, and inflammatory mediators are transduced into secondary and tertiary outcomes that manifest clinically as disease. In other words, how are primary mediators sensed and what are the resulting intracellular changes that lead to disease? Recent evidence integrating cellular, metabolic, and molecular processes associated with stress indicates that a specific cellular component (the mitochondrion) may contribute to primary mediators downstream from health effects (Picard, Juster, et al., Reference Picard, Juster and McEwen2014).
This section provides a brief overview of mitochondria, then discusses mechanisms by which AL mediators cause persistent mitochondrial structural and functional alterations known as MAL, and finally outlines potential pathways whereby MAL causes molecular and cellular hallmarks of stress pathophysiology (Figure 6). Because mitochondria are present in all organs of the body and MAL may develop concurrently across cell types, mitochondrial dysfunction does not impact individual organs in isolation. Rather, MAL exerts damaging cellular effects across cell types and organ systems, thus leading to coexistence of multiple diseases or symptoms that we argue has applications to demarcating the origin of biological comorbidities.
The stress–disease cascade and mitochondrial allostatic load (Picard, Juster, et al., Reference Picard, Juster and McEwen2014). Chronic stress perturbs adaptive glucocorticoid signalling and glucose levels (primary mediators) that in turn alter mitochondrial structure and function (primary effects), generating oxidative stress and cellular damage (primary outcomes). This process cumulatively worsens risk factors (secondary outcomes), which consequently leads to disease (tertiary outcomes). In this multilevel cascade, mitochondrial dysfunction is depicted as an early event mediating the relationship between primary mediators of chronic stress and disease trajectories. mtDNA, mitochondrial DNA; ROS, reactive oxygen species.

Mitochondria
Mitochondria arose approximately 1.5 billion years ago from the symbiotic union of the ancestral eukaryotic cell and an aerobic (i.e., capable of using oxygen to produce energy) bacterium (Margulis & Bermudes, Reference Margulis and Bermudes1985). This singular event constituted a turning point in the evolution of complex life (Lane & Martin, Reference Lane and Martin2010), with the larger amount of energy afforded by hundreds of energy-producing oxygen-consuming mitochondria populating the cell's cytoplasm, enabling the regulation of the complex genome comprising >20,000 genes (Wallace, Reference Wallace2010). This culminated in the development of multicellular organisms, tissues, organs, and breathing bodies that interact in complex ways with their environment. For this evolutionary reason, functioning of the human organism and its interaction with the environment is closely linked to energy metabolism in general, and to mitochondrial function in particular.
Mitochondria exhibit several ancestral features of their bacterial origin, including the circular mitochondrial DNA (mtDNA). In humans and animals, the mtDNA is uniquely inherited from the mother (Giles, Blanc, Cann, & Wallace, Reference Giles, Blanc, Cann and Wallace1980), and shows defined single nucleotide polymorphisms (SNPs) that correlate with the maternal lineage, and thus race/ethnicity (Kenney et al., Reference Kenney, Chwa, Atilano, Falatoonzadeh, Ramirez and Malik2014; Wallace & Chalkia, Reference Wallace and Chalkia2013). The mtDNA does not have loose ends and does not contain telomeres, the DNA–protein complexes at the end of chromosomes in the nucleus (Chan & Blackburn, Reference Chan and Blackburn2004). The functional importance of mtDNA lies in that it encodes critical genes for energy production by the respiratory chain, and mtDNA damage decreases mitochondrial energy production capacity, and thus cellular energy supply.
Mitochondria derive energy from ingested food substrates and breathed oxygen. The end product of this respiratory chain is the production of adenosine triphosphate (Mitchell & Moyle, Reference Mitchell and Moyle1967), which fuels the majority of cellular reactions, including gene expression, chromatin remodelling, ion homeostasis, protein and hormone synthesis, secretion, neurotransmitter release/reuptake, muscle contraction, and more. Beyond energy production, mitochondria also perform several essential functions that influence cell function and fate, and can be a potent source of disease (Wallace, Reference Wallace2013).
Nonenergetic functions of mitochondria are involved in widespread cellular functions central to stress physiology. Specifically, these include (a) cellular calcium homeostasis that regulate cellular metabolism and signal transduction within the cell (Glancy & Balaban, Reference Glancy and Balaban2012), (b) cell death via apoptotic and necrotic signalling (Kasahara & Scorrano, Reference Kasahara and Scorrano2014), (c) production of reactive oxygen species within the cell that can lead to oxidative stress when they overwhelm antioxidant defense mechanisms (Balaban, Nemoto, & Finkel, Reference Balaban, Nemoto and Finkel2005; Lambert & Brand, Reference Lambert and Brand2009), and (d) specialized cell types as well as the production of steroid hormones and catecholamine metabolism that require biosynthetic enzymes located in or on the surface of mitochondria (Papadopoulos & Miller, Reference Papadopoulos and Miller2012). Mitochondria are thus multifarious organelles whose functioning is connected to cellular function via multiple pathways that contribute to disease when dysregulated.
Primary stress mediators damage mitochondrial structure and functions in various tissues
Primary neuroendocrine and metabolic stress mediators affect mitochondrial function via various mechanisms. These include dynamic morphology transitions (i.e., shape changes), the action of specific hormone receptors localized to mitochondria, and persistent changes in mitochondrial functions.
Mitochondrial shape is dynamically remodeled. Their shape oscillates between spheroid bean- shaped and more elongated spaghetti-shaped organelles. Morphology changes are accomplished via fusion, where two mitochondria come together to form a longer and larger organelle; and fission, whereby a longer mitochondrion fragments into two shorter and smaller pieces (Chan, Reference Chan2012). These processes of “mitochondrial dynamics” respond to the metabolic environment. For example, too many energy substrates (glucose and lipids) relative to cellular demand cause fragmentation, and the opposite state of undersupply promotes fusion (Liesa & Shirihai, Reference Liesa and Shirihai2013).
Mitochondrial shape and function are interlinked. When mitochondria change shape, this acutely and chronically changes mitochondrial functions (Picard, Shirihai, Gentil, & Burelle, Reference Picard, Shirihai, Gentil and Burelle2013). For example, metabolic stress, such as hyperglycemia and hyperlipidemia, which naturally result from the action of glucocorticoids and catecholamines (Picard, Juster, et al., Reference Picard, Juster and McEwen2014), can trigger the fragmentation of mitochondria. Mitochondrial fragmentation may in turn increase reactive oxygen species production and susceptibility to cell death in cultured rodent and bovine models (Yu, Sheu, Robotham, & Yoon, Reference Yu, Sheu, Robotham and Yoon2008). In the long term, chronic mitochondrial fragmentation can lead to mtDNA damage, decreased energy-production capacity, and oxidative stress (Picard & Turnbull, Reference Picard and Turnbull2013). Of the most importance, the healthy state or “mitochondrial resilience” lies in their continuous morphological remodeling (Chan, Reference Chan2012), where mitochondria dynamically respond to environmental perturbations via reversible shape changes. This therefore represents a subcellular allostatic mechanism.
Receptors for steroid hormones and other molecular classes also exist in the mitochondrial matrix and on their surface. The glucocorticoid receptor, which is traditionally called a nuclear receptor believed to localize in the nucleus upon stimulation, is also located in the mitochondrial matrix. In the mitochondrion, it interacts with the mtDNA and impacts mtDNA gene expression (Psarra & Sekeris, Reference Psarra and Sekeris2011). This consequently influences various mitochondrial functions in a biphasic inverted U-shape pattern (Du et al., Reference Du, Wang, Hunter, Wei, Blumenthal and Falke2009). Mitochondria also respond to estrogen (Irwin et al., Reference Irwin, Yao, To, Hamilton, Cadenas and Brinton2012; Psarra, Solakidi, & Sekeris, Reference Psarra, Solakidi and Sekeris2006), angiotensin (Abadir et al., Reference Abadir, Foster, Crow, Cooke, Rucker and Jain2011), and cannabinoids (Benard et al., Reference Benard, Massa, Puente, Lourenco, Bellocchio and Soria-Gomez2012), given that receptors for these molecules are present in mitochondria. A broad range of metabolic and neuroendocrine primary mediators may thus synergistically impact mitochondrial morphology and functions (Hernandez-Alvarez et al., Reference Hernandez-Alvarez, Paz, Sebastian, Munoz, Liesa and Segales2013).
In considering developmental trajectories, it is notable that the accumulation of mtDNA damage occurs naturally with age. Damage to mtDNA is enhanced by metabolic stress. Because mtDNA damage persists over time and may actually expand, this represents a putative basis for cellular memory of adverse events transduced from allostatic states and primary mediators to mitochondria that can in turn contribute to AL. Dynamic morphological and functional remodeling are the basis for short-term adaptive bioenergetic responses.
MAL as a source of cellular dysfunction and comorbidities
Beyond energy production, mitochondria release a number of signals that influence specific cellular functions that may lead to disease when perturbed. In particular, mtDNA alterations may have long-term bioenergetic effects (Figure 7). In neurons, for instance, mitochondria are positioned in the presynaptic terminal where they regulate neurotransmission (Sun, Qiao, Pan, Chen, & Sheng, Reference Sun, Qiao, Pan, Chen and Sheng2013). In so doing, mitochondria regulate synaptic structure and function, and consequently brain function and cognition (Hara et al., Reference Hara, Yuk, Puri, Janssen, Rapp and Morrison2014; Picard & McEwen, Reference Picard and McEwen2014).
Mitochondrial allostatic load. A refined understanding of primary effect and outcomes in the allostatic load cascade is key to further understanding specific disease trajectories.

Beyond regulating synaptic transmission, mitochondrial signals may also contribute to explain how mitochondria-generated oxidative stress accelerates telomere shortening and accelerated aging phenotypes (Passos et al., Reference Passos, Saretzki, Ahmed, Nelson, Richter and Peters2007; Velarde, Flynn, Day, Melov, & Campisi, Reference Velarde, Flynn, Day, Melov and Campisi2012). Mitochondrial reactive oxygen species activate oxidative-stress sensitive proinflammatory pathways such as nuclear factor kappa B (Hayashi et al., Reference Hayashi, Yoshida, Yamato, Ide, Wu and Ochi-Shindou2008), notably involved in general inflammatory responses to chronic stress in human monocytes (Miller et al., Reference Miller, Chen, Sze, Marin, Arevalo and Doll2008). Other molecular communication mechanisms exist by which changes in mitochondrial function affects nuclear gene expression (Arany, Reference Arany2008; Guha & Avadhani, Reference Guha and Avadhani2013).
Mitochondria thus lie at the interface and sequence of events connecting primary stress mediators to defined cellular alterations linked to disease, including abnormal gene expression and epigenetic modifications. Ultimately, identifying specific subcellular processes that mediate the stress-disease cascade is of paramount importance. With this goal in mind, the development of technology to assess this level of functioning should enhance our ability to predict and prevent specific stress-related health consequences related to mechanisms shaped by our ancestral past. We believe that the measurement and characterization of MAL will be fruitful to achieve this.
Whereas evolution consists in permanent changes in the organization and content of genetic information (e.g., new gene or adaptive mutation) over thousands of years, the time scale of adaptation to life stressors occur on a much shorter time scale. One biological process that enables genetic adaptation over such a short term is epigenetics that will be described in the following section. Briefly, genes are packaged into chromatin, a DNA–protein structure that either “closes” genes to repress transcription or “opens” them to promote their expression.
MAL could contribute to persistent changes in brain and organ function by altering epigenetic processes. Mitochondrial regulation of gene expression in relation to chromatin regulation is facilitated by two major factors. The first is topological, from the perinuclear mitochondrial positioning in proximity to the genetic material (Picard, Reference Picard2015). The second is biochemical, because as part of their normal metabolism, mitochondria produce most of the substrates required for posttranslational epigenetic mechanisms of chromatin remodeling (Gut & Verdin, Reference Gut and Verdin2013; Salminen, Kaarnoran, Hiltunen, & Kauppinen, Reference Salminen, Kaarniranta, Hiltunen and Kauppinen2014). As will be described next, posttranslational modifications of the DNA itself and of proteins called histones require mitochondria-derived energy and metabolites. This constitutes the relatively malleable epigenetic landscape that may be at the origin of altered gene expression in disease conditions.
Multiple disease conditions that may result or be exacerbated by stress, including Alzheimer disease (De Jager et al., Reference De Jager, Srivastava, Lunnon, Burgess, Schalkwyk and Yu2014), show abnormal epigenetic profiles that can affect the expression of a large number of genes and alter normal function across organ systems. Accordingly, a recent study of human cells with varying levels of a unique mitochondrial defect established that the majority of genes in the human genome are under mitochondrial regulation (Picard, Zhang, et al., Reference Picard, Zhang, Hancock, Derbeneva, Golhar and Golik2014). This underscores the principle that a single mitochondrial defect may have a multifinality of effects across genes in the human genome, and across organ systems. Moving from cells to children, the following section will focus on epigenetics in the context of child maltreatment.
Child Maltreatment and Biological Embedding: A Probabilistic Pathway
Our adverse experiences throughout life set off probabilistic pathways toward the development of numerous stress-related diseases. It is essential to consider the underlying processes whereby stress-related diseases and comorbidities overlap with evolutionary preserved responses common to several conditions (e.g., inflammation; Anisman & Hayley, Reference Anisman and Hayley2012). Beyond evolutionary mechanisms, numerous interconnected factors shape differential risk and protection. Perhaps the most pernicious are early life experiences that are critical for the acquisition of vulnerable or resilient phenotypes (Le Moal, Reference Le Moal2007).
It is estimated that childhood maltreatment (CM), including but not limited to parental neglect, and psychological, sexual, and physical abuse, contributes to over 30% of adult psychopathology (Afifi et al., Reference Afifi, Enns, Cox, Asmundson, Stein and Sareen2008; McLaughlin et al., Reference McLaughlin, Green, Gruber, Sampson, Zaslavsky and Kessler2010). In extension to this, a history of CM is related to illness chronicity, greater incidence of hospitalization, increased psychological and physical comorbidities, and reduced responsiveness to psychopharmacotherapy (Du Rocher Schudlich et al., Reference Du Rocher Schudlich, Youngstrom, Martinez, Kogos-Youngstrom, Scovil and Ross2015; Klein et al., Reference Klein, Arnow, Barkin, Dowling, Kocsis and Leon2009; Tunnard et al., Reference Tunnard, Rane, Wooderson, Markopoulou, Poon and Fekadu2014; Tyrka, Burgers, Philip, Price, & Carpenter, Reference Tyrka, Burgers, Philip, Price and Carpenter2013). CM therefore represents an environmental stressor that can potentially influence multiple physiological systems, including the HPA axis central to AL.
From an evolutionary perspective, biological embedding of CM on stress regulatory pathways represents an instance where activity of an adaptive physiological system may become maladaptive. In this line of reasoning, exposure to CM by children who are expected to receive protection and care from parents may instead signal a hostile and unreliable environment. As a result, the developing brain must undergo neuroplastic changes in stress circuitry as an attempt to meet the hypervigilant demands of a threatening environment (Turecki, Reference Turecki2014). Epigenetic processes regulating gene expression function as probabilistic molecular pathways guiding structural and functional remodeling of the stress system in the face of early life maltreatment.
As discussed previously in relation to mitochondria, epigenetic modifications refer to the collective chemical and physical alterations of the genome that regulate the activity of genes in a spatially and temporally dependent manner. These modifications do not, however, influence the underlying genetic code. One of the most intensively studied epigenetic marks is DNA methylation, referring to the covalent addition of a methyl group to the 5' position of a cytosine residue often existing in a CpG context. Methylation at a cytosine residue has been frequently associated with the recruitment of methyl binding proteins, resulting in transcriptional repression through chromatin condensation (Klose & Bird, Reference Klose and Bird2006).
DNA methylation at various genomic loci persists for up to 20 years (Talens et al., Reference Talens, Boomsma, Tobi, Kremer, Jukema and Willemsen2010). However, while epigenetic marks persist for long periods, gradual changes (both global and site specific) in the methylome do occur with healthy human aging (Jones, Goodman, & Kobor, Reference Jones, Goodman and Kobor2015). Akin to our previous exposition of mitochondrial biology, the field of epigenetics is thus well suited to help address the question of how an environmental stressor such as CM may result in maladaptive biological imprinting on developing neurocircuitry. Given that brain plasticity is considerably more pronounced during childhood, sensitive periods early in life are a unique circumstance where the so-called neural programming effects of one's environment are thought to confer risk or resilience to adult psychopathology (Roth & Sweatt, Reference Roth and Sweatt2011).
Epigenetics and glucocorticoid regulation
A major consideration faced by the field of neuroepigenetics is whether environmentally encoded genome-wide epigenetic reprogramming in peripheral tissues are reflective of plastic changes within the central nervous system. Postmortem studies are a unique way to address this issue while further clarifying the relationship between CM and stress dysregulation at the molecular level. In a seminal study by McGowan et al. (Reference McGowan, Sasaki, D'Alessio, Dymov, Labonte and Szyf2009), the authors report an interaction between early life adversity and the human neuroepigenome. In their investigation of glucocorticoid receptor (GR) expression in the hippocampus of suicide completers with and without a history of CM, they found a significant CM-driven reduction in the expression of the GR gene nuclear receptor subfamily 3, group C, member 1 (NR3C1). This altered expression was explained by hypermethylation at two distinct CpG sites in exon 1F of NR3C1. Furthermore, in vitro experiments revealed that hypermethylation at these genomic loci may prevent the transcription factor NGF1-A from binding and potentiating promoter activity regulating GR gene expression (McGowan et al., Reference McGowan, Sasaki, D'Alessio, Dymov, Labonte and Szyf2009).
In a related study utilizing the same subject groupings, Labonte et al. (Reference Labonte, Yerko, Gross, Mechawar, Meaney and Szyf2012) observed a reduction in total GR and GR splice variants 1(B), 1(C), and 1(H) expression in the hippocampus of suicide completers with versus those without a history of CM. Methylation of GR1(B) and 1(C) promoter sequences negatively correlated with both total and variant specific GR expression, while methylation in the GR1(H) promoter was positively correlated with both total and variant specific GR expression. In extension to hippocampal analysis, no group differences in total or variant specific GR expression emerged in the anterior cingulate gyrus (Labonte et al., Reference Labonte, Yerko, Gross, Mechawar, Meaney and Szyf2012), a region heavily implicated in stress processes (Gianaros & Wager, Reference Gianaros and Wager2015).
Taken together, it is particularly noteworthy that a neuroanatomical area heavily implicated in inhibitory feedback of the HPA axis is selectively perturbed by early life maltreatment while others are relatively spared, consistent with the life cycle model of stress (Lupien et al., Reference Lupien, McEwen, Gunnar and Heim2009). This latter point speaks to the complexity of unraveling the biological imprint that CM leaves on the human neuroepigenome beyond neurological substrates. Further complicating matters are the dimensional effects that CM may have on epigenetic-mediated stress system dysregulation and clinical symptomology.
While human postmortem studies may have valuable biological validity, they are limited in their ability to answer many questions. To address this, peripheral sample replication of postmortem results have been recently investigated in a systematic review (Turecki & Meaney, Reference Turecki and Meaney2016). Of the 27 articles investigating CM and GR DNA methylation in human peripheral samples, 89% reported an early life adversity driven by increased methylation at the 1F exon variant. The authors interpret these findings as evidence of the stable influences that CM exerts on the HPA axis.
CM may therefore act to sensitize neural and endocrine components of the stress system in a global manner. All tissues (central and peripheral) involved in the stress cascade are affected with a similar objective toward allostatic recalibration and adaptation to a hostile environment. This interpretation speaks to not only the validity of using peripheral tissues for epigenetic analysis of CM but also the capability of stress dysregulation imposed by CM to influence many physiological systems indexed in the AL literature. Thus, investigation of the dimensional complexity inherent to CM may require studies that utilize peripheral blood samples as a proxy for environmental effects on neuroepigenetic processes.
Perroud et al. (Reference Perroud, Paoloni-Giacobino, Prada, Olie, Salzmann and Nicastro2011) tackled this dimensional complexity in an investigation of methylation of the exon 1F GR gene promoter in subjects with bipolar disorder (BD), major depressive disorder (MDD), and MDD with a comorbid diagnosis of posttraumatic stress disorder (PTSD) who were all victims of CM. Childhood sexual abuse, its severity, and the number of categories of CM each correlated with GR methylation in a positive direction. BD participants with repeated abuse as well as sexual abuse with penetration also correlated with higher methylation percentiles (Perroud et al., Reference Perroud, Paoloni-Giacobino, Prada, Olie, Salzmann and Nicastro2011). In a recent study also conducted with BD participants, methylation of the GR gene was positively correlated with physical abuse. Methylation at this locus positively correlated with clinical severity and hospitalizations (Martin-Blanco et al., Reference Martin-Blanco, Ferrer, Soler, Salazar, Vega and Andion2014). In a dimensional perspective of CM, these studies draw attention to the hypothesis that a history of early life adversity may be present in many psychopathologies. This may help explain comorbidities using stress dysregulation as a starting point and underline the need to further identity CM subtype- specific alterations of the epigenome.
Research groups have recently begun to investigate the interaction between genotype and DNA methylation, because underlying genetic sequences can largely influence epigenetic modifications. Studies of twins suggest a greater variability in DNA methylation patterns between dizygotic relative to monozygotic twins (Petronis, Reference Petronis2006). Underlying genomic variation such as SNPs may also influence methylation mechanisms in complex ways. Insight into genotype-dependent epigenetic remodeling in response to CM may therefore clarify a role for genetic variations in promoting resilience or susceptibility to early adversity. For instance, independent groups have identified an interaction between several SNPs within the FK506 binding protein 5 gene (FKBP5), and a history of CM in patients with PTSD, depression, and past suicide attempts (Appel et al., Reference Appel, Schwahn, Mahler, Schulz, Spitzer and Fenske2011; Binder et al., Reference Binder, Bradley, Liu, Epstein, Deveau and Mercer2008; Roy, Goroetsky, Yuan, Goldman, & Enoch, Reference Roy, Gorodetsky, Yuan, Goldman and Enoch2010). Furthermore, these findings have been related to intron-specific DNA methylation (Klengel et al., Reference Klengel, Mehta, Anacker, Rex-Haffner, Pruessner and Pariante2013). More precisely, a SNP in a glucocorticoid response element localized to intron 2 of the FKBP5 gene mediated the association between CM and PTSD. In sum, individuals carrying the risk allele who also had a history of CM displayed hypomethylation in intron 7 of the FKBP5 gene.
The significance of these studies draws on the regulatory role that the FKBP5 chaperone protein plays as an intracellular feedback mechanism governing GR receptor activity. Glucocorticoid binding to its receptor induces the expression of FKBP5, which then inhibits receptor–ligand binding and translocation of the hormone complex to the nucleus, where it would normally result in recruitment of molecular machinery responsible for gene transcription. Klengel et al. (Reference Klengel, Mehta, Anacker, Rex-Haffner, Pruessner and Pariante2013) provided evidence of a mechanism in which GR may regulate FKBP5 expression through DNA methylation at the same genomic loci that is perturbed by CM, namely, intron 7. Taken together, what begins to emerge is a probabilistic molecular pathway involving (a) a complex interaction between early life adversity, (b) an individual's genomic landscape, and (c) the neuroepigenome as they relate to perturbations in an evolutionarily adaptive system ordinarily under tight physiological equilibrium.
In terms of allostatic calibration, an overactive stress response may be adaptive during the years of adversity. Yet, once the child develops out of this experience, the HPA axis may remain “scarred” with an epigenetic memory biasing its activity toward maladaptive molecular and hormonal cascades. Losing regulatory control over the HPA axis results in ineffective inhibition of CRF secretion and an overactive system. Higher levels of CRF in cerebrospinal fluid have been documented in adults with a history of childhood abuse (Mello et al., Reference Mello, Faria, Mello, Carpenter, Tyrka and Price2009). HPA axis hyperactivity is also evident further downstream in the stress hormone cascade and interacts with subcellular processes like those discussed in relation to mitochondria. While investigating ACTH release in response to a psychosocial laboratory stressor, Heim et al. (Reference Heim, Newport, Heit, Graham, Wilcox and Bonsall2000) found that women with a history of childhood abuse showed a greater stress response than age-matched controls. This finding was further exaggerated in women with a history of childhood abuse and a current diagnosis of MDD (Heim et al., Reference Heim, Newport, Heit, Graham, Wilcox and Bonsall2000).
One way to interpret these results is as evidence of the dimensionality of HPA axis dysregulation, whereby CM may contribute as a graded diathesis for adult psychopathologies like MDD and personality disorders. Along with CM, other risk factors such as sex/gender, genetic predispositions, and social factors may act in an additive or interactive manner to predict further AL (Juster, Bizik, et al., Reference Juster, Bizik, Picard, Arsenault-Lapierre, Sindi and Trepanier2011; Juster et al., Reference Juster, Seeman, McEwen, Picard, Mahar, Mechawar and Cicchetti2016). The consequences of early exposure to cumulative stress, and the neuroendocrine milieu that accompanies it, results in a lasting dysfunction in multiple central and peripheral systems also observed in individuals with a diagnosis of mental and physical illnesses.
Epigenetic embedding of immune functioning
Impaired glucocorticoid-mediated immune regulation can also account for many of the long-lasting effects of CM on later physiology (Ehlert, Reference Ehlert2013). For example, victims reporting a history of early maltreatment display heightened immune activation in adulthood (Danese et al., Reference Danese, Moffitt, Pariante, Ambler, Poulton and Caspi2008). Early life events act to reprogram global GR sensitivity through epigenetic processes like DNA methylation (McGowan et al., Reference McGowan, Sasaki, D'Alessio, Dymov, Labonte and Szyf2009; Turecki & Meaney, Reference Turecki and Meaney2016). Because glucocorticoids play a fundamental role in maintaining immune homeostasis, variations in GR responsiveness perturb this equilibrium and lead to the development of related pathology.
Adding further to the pathophysiological cascade, inflammation reciprocally impairs GR sensitivity in part through the actions of TNFα and interferon γ (IFNγ). Because GRs are not only regulated by but also play a fundamental role in epigenetic processes, chronic immune activation results in global changes to the epigenome. For instance, cytokines suppress the protein Merm1 and its ability to bind to the GR co-activator GRIP (Jangani et al., Reference Jangani, Poolman, Matthews, Yang, Farrow and Berry2014). This results in impaired GR transcription by reducing GR recruitment to its binding sites. This observation was accompanied by a loss of GR-dependent H3K4Me3, an epigenetic histone modification found on active promoters. Furthermore, loss of Merm1 due to cytokine activity was discovered in inflammatory and neoplastic human lung pathologies (Jangani et al., Reference Jangani, Poolman, Matthews, Yang, Farrow and Berry2014). Beyond immune recalibrations, methylation status of the GR promoter is also related to cardiovascular reactivity in the context of the social–evaluative threatening cold pressor task (Li-Tempel et al., Reference Li-Tempel, Larra, Sandt, Meriaux, Schote and Schachinger2016).
Epigenetic embedding of BDNF
Thus far, several of the peripheral biomarkers related to the HPA axis, immune system, and cardiovascular functioning discussed in relation to epigenetics have also served as integral indicators when calculating AL indices. More recently, researchers have begun considering central biomarkers such as BDNF. Chronic stress imposed by CM is related to lower plasma BNDF levels in MDD patients without comorbid anxiety disorder. This association is both dose dependent and mediated by methionine carriers of the Val66Met polymorphism. Exposure to recent life events, however, resulted in similar decreases in plasma BDNF independent of genotype. The authors conclude a Gene × Environment interaction on serum BDNF such that methionine carriers are particularly sensitive to early life stress (Elzinga et al., Reference Elzinga, Molendijk, Oude Voshaar, Bus, Prickaerts and Spinhoven2011).
The consequences of low plasma BDNF levels are strongly substantiated in psychiatric conditions such as PTSD, BD, first episode psychosis, major depression, and suicidal behavior (Fernandes et al., Reference Fernandes, Gama, Cereser, Yatham, Fries and Colpo2011; Kim et al., Reference Kim, Lee, Won, Park, Lee and Lee2007; Pillai et al., Reference Pillai, Kale, Joshi, Naphade, Raju and Nasrallah2010; Su et al., Reference Su, Xiao, Lin, Qiu, Jin and Wang2015). This neurotropic factor was also assessed recently in relation to cardiovascular trauma (Takashio et al., Reference Takashio, Sugiyama, Yamamuro, Takahama, Hayashi and Sugano2015). Low plasma BDNF levels were linked not to the presence of heart failure but to its severity.
To further understand potential mechanisms, we turn once more to the field of epigenetics to help explain how a history of early life adversity results in such widespread physiological dysregulation. For example, a recent study showed that bulimic women with a history of CM or borderline personality disorder had a propensity toward elevated methylation at specific BDNF promoter region sites (Thaler et al., Reference Thaler, Gauvin, Joober, Groleau, de Guzman and Ambalavanan2014), which may repress BDNF gene expression and its neurotrophic effects on the brain. Given these widespread associations, epigenetic embedding of BDNF functioning may represent a key mechanism for understanding comorbidities in various disease processes.
A model of environment-dependent evolutionary adaptivity in child maltreatment
Summarizing the work above, we propose a model whereby CM results in chronic stress that acts to globally reprogram the sensitivity of various physiological systems intricately related to glucocorticoid signaling and AL. We emphasize DNA methylation as a probabilistic molecular pathway through which this may occur, while recognizing that other epigenetic modifications are also involved. It is arguable that these molecular modifications may represent an adaptive form of compensatory genomic and neural plasticity in response to an unreliable and hostile early life environment in line with the life cycle model of stress (Lupien et al., Reference Lupien, McEwen, Gunnar and Heim2009). However, their persistence in nonthreatening contexts may be cumulatively maladaptive.
This model can be expanded in line with the evolutionary framework espoused by the differential susceptibility model of psychopathology (Boyce & Ellis, Reference Boyce and Ellis2005; Ellis & Boyce, Reference Ellis and Boyce2011; Ellis, Boyce, Belsky, Bakermans-Kranenburg, & van IJzendoorn, Reference Ellis, Boyce, Belsky, Bakermans-Kranenburg and van IJzendoorn2011; Ellis, Essex, & Boyce, Reference Ellis, Essex and Boyce2005) that has contributed significantly to the field of developmental psychopathology. Briefly, the differential susceptibility theory posits that the presence of genetic mutations promoting susceptibility to psychopathology in threatening environments are maintained throughout evolutionary history due to their counterbalanced adaptability in nurturing environments. As an example, we emphasize here genetic variation in the oxytocin receptor rs53576 genotype due primarily to oxytocin's role in social bonding. Individuals of the GG genotype are more receptive to social cues and prosocial in their behavior (Hostinar, Cicchetti, & Rogosch, Reference Hostinar, Cicchetti and Rogosch2014; Kogan et al., Reference Kogan, Saslow, Impett, Oveis, Keltner and Rodrigues Saturn2011; Tost et al., Reference Tost, Kolachana, Hakimi, Lemaitre, Verchinski and Mattay2010). Conversely, one can speculate that a homozygous G genotype may sensitize the individual to being more vigilant to, and affected by, the negative social environment with abusive caregivers.
Behavioral tendencies to seek out conspecific support may be adaptive during acute but not chronic stress. For instance, execution of “tend-or-befriend” biobehavioral patterns (Taylor et al., Reference Taylor, Klein, Lewis, Gruenewald, Gurung and Updegraff2000) emphasizing social interaction in an unreliable and hostile environment may expose the child to more frequent and intense experiences of abusive behavior. Returning to CM and HPA axis function, an adverse early environment may temporarily activate adaptive stress responses that originally evolved to energize and motivate an organism to cope with threat. Because the threat in CM continues to persist chronically, physiological systems aimed at maintaining equilibrium in glucocorticoid signaling become epigenetically reprogramed to meet environmental demands.
Early brain development is marked by a heightened sensitivity to the plastic neural programming effects of one's environment (Roth & Sweatt, Reference Roth and Sweatt2011). Once this critical period of plasticity diminishes with further neurodevelopment, CM induced epigenetic signatures and their influences on stress neurocircuitry persist robustly into adulthood. This phenomenon is referred to as an epigenetic “memory” (Lutz, Almeida, Fiori, & Turecki, Reference Lutz, Almeida, Fiori and Turecki2015) that is biologically embedded by experiences in early life. As such, a molecular cascade meant to be adaptive in one particular environment or period of development produces persisting and maladaptive consequences in others. The consequences we refer to specifically are global and can be understood by assessing AL developmentally.
Child maltreatment and AL
A promising way to summarize physical health indicators from multiple impaired systems throughout lifespan development is to measure AL prospectively. A recent study showed that using systolic/diastolic blood pressure, HDL, total cholesterol to HDL ratio, HbA1c, C-reactive protein, albumin, and creatinine clearance, child abuse and neglect (experienced between ages 0 and 11) predicted AL in adulthood (mean group age of 41), while controlling for age, sex, and race/ethnicity (Widom, Horan, & Brzustowicz, Reference Widom, Horan and Brzustowicz2015). These impressive results reveal a long-term impact of CM and neglect on physical health as far as 30 years later in life. Adverse childhood experiences are even linked to biological aging and chronic diseases via neural recalibrations that modulate AL (Danese & McEwen, Reference Danese and McEwen2012).
This association expands to public health. In a large-scale Nord-Trøndelag Health Study of 37,612 participants (between 30 and 69 years old), the detrimental impact of adverse childhood experiences on physical health was substantiated (Tomasdottir et al., Reference Tomasdottir, Sigurdsson, Petursson, Kirkengen, Krokstad and McEwen2015). Twenty-one chronic diseases, and 12 biological parameters associated with AL were investigated and related to quality of early life. Results revealed that 44.8% of participants with a very good childhood experienced multimorbidity compared to 77.1% of those with a very difficult childhood. The prevalence of individual diseases also differed by childhood quality. Chronic back pain, obesity, hyperlipidemia, mental health problems, osteoarthritis, asthma, cardiovascular disease, dental health problems, psoriasis, thyroid disease, gastroesophageal reflux disease, fibromyalgia, diabetes, rheumatic arthritis, chronic obstructive pulmonary disease, renal disease, osteoporosis, ankylosing spondylitis, and epilepsy each presented worse in those who experienced a very difficult childhood (Tomasdottir et al., Reference Tomasdottir, Sigurdsson, Petursson, Kirkengen, Krokstad and McEwen2015).
Age-adjusted differences using individuals reporting a “very good childhood” as reference was computed by sex for secondary AL parameters. For women, significant differences at the 95% confidence interval emerged in height, waist, waist to hip ratio, body mass index, systolic blood pressure, heart rate, pulse pressure, and nonfasting glucose. In men, these differences occurred in all of the above parameters apart from non-fasting glucose, but were also observed in diastolic blood pressure. Taken together, this reveals the robust effects of CM on peripheral physiology in both sexes.
A major goal of developmental traumatology as a field consists of not only systematic investigation of the impact that CM has on psychobiological development but also more importantly, biopsychosocial factors mediating this association. For instance, in the National Child Development Study, 3,782 women and 3,753 men were followed up seven times in relation to adverse childhood experiences (ACEs) measured prospectively at ages 7, 11, and 16 (Barboza Solis et al., Reference Barboza Solis, Kelly-Irving, Fantin, Darnaudery, Torrisani and Lang2015). AL was operationalized via data from a biomedical survey collected at age 44 with 14 biomarkers reflecting four systems. In both sexes, ACEs were associated with higher AL after adjusting for early life factors and childhood illness.
Early adversity also interacts with difficulties in adulthood to synergize AL. Pathway analysis revealed that the aforementioned association reported by Barboza Solis et al. (Reference Barboza Solis, Kelly-Irving, Fantin, Darnaudery, Torrisani and Lang2015) was largely explained by early adult factors between ages 23 and 33. In men, two or more ACEs accounted for a mediation effect of 59% following the incorporation of health behaviors, education level, and wealth. For women, the mediation effect was 76% after including smoking, body mass index, education level, and wealth into the model. These results suggest that early psychosocial stress may also have an indirect effect on physiological “wear and tear” through its association with health behaviors, severe mental illness, and socioeconomic status. Social support across the life span may also partially mediate the relationship between child maltreatment and AL in adulthood; although differences in race/ethnicity and sex have emerged (Horan & Widom, Reference Horan and Widom2015).
CM and neglect directly predict AL despite the introduction of potential mediators such as internalizing and externalizing problems in adolescence, as well as social support and risky lifestyles in middle adulthood. These discrepancies may be the result of clustering early life maltreatment into a single composite score as opposed to attempting to understand the adverse effects of specific early life events on AL. From an epigenetic standpoint, type, severity, and duration of CM can have vastly different effects on chemical and physical modifications to the genome that have been explored in relation to DNA methylation at the FKBP5 and solute carrier family C6, member 4 (SLC6A4) genes, respectively (Kang et al., Reference Kang, Kim, Stewart, Kim, Bae and Kim2013; Perroud et al., Reference Perroud, Paoloni-Giacobino, Prada, Olie, Salzmann and Nicastro2011).
Careful consideration of mediating factors should also be emphasized in CM studies because they also translate to biological signatures impinging on an individual's physiology in developmental psychopathology and clinical remediation. For instance, the relationship between child maltreatment and higher DNA methylation of the BDNF locus has been found among borderline personality disorder patients. Furthermore, those subjects who responded to a 4-week course of intensive dialectical behavior therapy showed a significant decrease in methylation over time. Methylation status was significantly associated with changes in impulsivity, depression, and hopelessness scores. Thus the participation in psychotherapy may rescue or modify harmful epigenetic profiles characteristic of CM. Regardless of the various limitations faced by the field, understanding the psychobiology of maltreatment through an allostatic framework can serve as a tool to guide future evidence-based practices for both treatment and prevention. Epigenetics serves as a conduit through which to gain this insight.
In summary, CM and early adversities can biologically embed stress responsitivity to environmental demands. From an evolutionary perspective, this could help explain individual differences in biobehavioral patterns (e.g., hyper- vs. hypocortisolemic profiles) and the development of distinct temperaments that are the phenotypic expression of children's sensitivity to adversity (Davies, Sturge-Apple, & Cicchetti, Reference Davies, Sturge-Apple and Cicchetti2011). In the following section, we will explore evolutionary perspectives of personality development linked to biobehavioral patterns and AL.
Evolutionary Perspectives, AL, and Personality Development
Akin to allostatic “stability through change,” change is the only constant as far as evolution is concerned (Schulkin, Reference Schulkin2011). Throughout time, natural selection (survival of the fittest) and sexual selection (survival of the sexes) has dynamically shaped the development of differential biobehavioral responses to environmental stimuli. Natural selection represents the process by which favourable traits that are heritable become more common in successive generations if they ensure reproductive success, and unfavourable traits that impede reproduction become less common (Darwin, Reference Darwin1859). In addition to such natural pressures, sexual selection refers to the process by which certain preferred traits or attractive ornaments (e.g., peacock plumage) are more likely to be passed on because they signal something about the bearers fitness (Darwin, Reference Darwin1871), even if they are metabolically taxing. Darwin was in effect the first scientist to fully appreciate how living organisms differ from one another in their adaptive qualities and limitations (Korte, Koolhaas, Wigfield, & McEwen, Reference Korte, Koolhaas, Wingfield and McEwen2005). A Darwinian framework is therefore informative in helping to conceptualize how AL leads to diseases of adaptation and multimorbidity.
The spectrum spanning from adaptive allostasis to maladaptive AL is the product of evolutionary pressures (Schulkin, Reference Schulkin2003). When a biological system incurs some reproductive advantage based on environmental circumstances, stereotyped response patterns become evolutionarily preserved (Pacak & Palkovits, Reference Pacak and Palkovits2001). In the context of stressful circumstances, individual differences in biological sensitivity to threat have ensured our survival, but are also intricately related to pathogenic susceptibilities when these systems malfunction. These represent variations along a continuum of multilevel adaptation/maladaption determined by preserved biobehavioral patterns, but that can also potentiate psychopathological processes when circumstances do not require them.
Allostatic overload
Conceptualized within a compelling evolutionary framework (McEwen & Wingfield, Reference McEwen and Wingfield2003), allostatic overload explains the AL breaking point by marrying biomedical and ecological traditions. Allostatic states occur in the natural world in preparation for seasonal events: for example, fat deposition in a hibernating bear, or a bird preparing to migrate, or a fish readying to spawn. Type 1 allostatic overload occurs when energy demands exceed energy supply (negative energy balance), for example, when starving or migrating. Such situations activate an emergency life history stage (LHS) to help cope with the needs of survival (Wingfield et al., Reference Wingfield, Maney, Breuner, Jacobs, Lynn and Ramenofsky1998). This can be thought of as a protracted allostatic state under acute conditions.
By contrast, Type 2 allostatic overload occurs when energy supplies exceed energy demand (positive energy balance), for example, when overeating or hibernating. This conceptual distinction is important when we consider the multifaceted interactions between chronic stress and lifestyle choices that contribute to disease and comorbidities. Over time, strained allostatic responses shift functioning from AL to allostatic overload via unhealthy behaviors. Thus, we can distinguish AL as it relates to a spectrum ranging from a normal adaptation to predictable environmental demands that can, in unfavorable conditions, lead to the two varieties of allostatic overload (McEwen & Wingfield, Reference McEwen and Wingfield2003).
“Hawks and doves” game theory
Korte et al. (Reference Korte, Koolhaas, Wingfield and McEwen2005) developed an evolutionary framework based on the hawks and doves game theory to conceptualize AL according to individual differences. The high aggression displayed by hawks and the low aggression displayed by doves might have led to the preservation of personality types and differential biobehavioral responses: bold hawks preferentially biobehave with fight–flight responses (e.g., SAM axis release of catecholamines) while doves cautiously adopt freeze–hide responses (HPA axis production of glucocorticoids; Korte et al., Reference Korte, Koolhaas, Wingfield and McEwen2005). This could explain why certain individuals are more vulnerable than others to specific stress-related diseases and why evolution has preserved our hardwired fear for life-threatening stimuli (Öhman & Mineka, Reference Öhman and Mineka2003). In this model, hawks are more likely to exhibit violence, impulse control disorders, hypertension, cardiac arrhythmias, sudden cardiac death, atypical depression, chronic fatigue states, and inflammation. By contrast, doves are at greater risk of developing anxiety disorders, metabolic syndromes, melancholic depression, psychotic states, and infection (Korte et al., Reference Korte, Koolhaas, Wingfield and McEwen2005).
The evolutionary trade-offs of various biobehavioral patterns can therefore render organisms vulnerable to specific diseases (i.e., equifinality) based on preserved biobehavioral patterns. Because natural and sexual selection exerts genetic benefits by maximizing reproductive success of the adapted organisms even at the expense of individual happiness, health, and longevity, the individual's health and well-being is not the primary goal of evolution (Korte et al., Reference Korte, Koolhaas, Wingfield and McEwen2005). The authors further stress that the progressive shifts from allostasis, AL, and allostatic overload has been shaped by the course of evolution by trade-offs on the basis of costs and benefits that occur at different stages of the life cycle or that are affected by season, social status, sex, or environmental change (Korte et al., Reference Korte, Koolhaas, Wingfield and McEwen2005).
From this game theory perspective, the SAM axis activation of Hawks and the HPA axis activation of Doves could also modulate differential immune functioning and other basal biological functions that are required to successfully achieve specific LHS (e.g., breeding and migration). When these processes are pitted into emergency situations, recalibrations of biobehavioral responses will lead to changes in LHS in order to adapt to the more pressing challenges at hand. Korte et al. (Reference Korte, Koolhaas, Wingfield and McEwen2005) argue that such emergency LHS will prompt a series of evolutionarily preserved strategies such as moving away from the stressor, taking refuge from the stressor, and seeking refuge first and then moving toward more favourable conditions (Korte et al., Reference Korte, Koolhaas, Wingfield and McEwen2005). Thus, these coping strategies are achieved by mobilizing energy reserves or seeking refuge, finding the right habitat, and/or resuming a normal LHS depending on the domination or subordination of conspecifics.
Dominance hierarchies
Just as allostatic mechanisms are shaped by evolutionary pressures, biobehavioral responses are oriented to the social milieu (Schulkin, Reference Schulkin2011). Complex social processes (e.g., pairbonding) among primates require heavy computational demands that have led to the evolution of our expanded cerebral cortex as populations grow (Dunbar & Shultz, Reference Dunbar and Shultz2007). For example, access to mates requires metabolically expensive physiological processes as resources become scarcer with ever growing society. Among social species, dominance hierarchies are especially powerful in determining how individuals sustain physical and psychosocial stressors.
According to Sapolsky (Reference Sapolsky2005), dominance hierarchies within species represent inequalities in resources akin to human socioeconomic gradients. Specifically, resource inequalities will lead to two patterns: a top-down “despotic” aggression to appropriate resources or a bottom-up “equalitarian” cooperation to distribute resources (Sapolsky, Reference Sapolsky2005). In accordance with Korte et al.’s (Reference Korte, Koolhaas, Wingfield and McEwen2005) hawks and doves analogy, Sapolsky (Reference Sapolsky2005) states “In the realms of animal ‘culture,’ multigenerational transmission of a culture of low aggression and high affiliation in a troop of wild baboons, for example, results in subordinates that do not display the stress related pathophysiology found in other troops.” Translated to humans, this represents a wide spectrum of biobehavioral patterns that have been preserved over the ages. Fight-or-flight responses (Cannon, Reference Cannon1932) reflect dominant strategies, while tend-and-befriend responses (Taylor et al., Reference Taylor, Klein, Lewis, Gruenewald, Gurung and Updegraff2000) may reflect affiliative strategies. Various psychopathological conditions may therefore represent extreme variants of otherwise adaptive strategies.
Using all available data on a variety of species spanning from African elephants to Harris's hawk, Goymann and Wingfield (Reference Goymann and Wingfield2004) performed a comparative study and showed that it is the relative AL of social status that predicts whether dominant or subordinate members of a social unit manifest either high or low glucocorticoid concentrations. In line with Sapolsky's research, this conclusion further suggests that it is not domination or subordination that is critical, but rather the ways in which this social status is achieved and maintained that determines the physiological costs associated with a specific social rank (Goymann & Wingfield, Reference Goymann and Wingfield2004). To summarize, the environment will drive natural and sexual selection, ultimately shaping the expression of biobehavioral patterns and the complex advent of traits that ensure the survival of the species subjected to specific stressors.
At the core of these evolutionary mechanisms are the influence of mitochondrial acitivities that provide energy, (epi)genetic risk factors, early life events, lifestyles, and stressful psychosocial experiences to name a few (McEwen & Wingfield, Reference McEwen and Wingfield2003). In many cases, psychopathology emerges as the manifestation of extreme variance of biobehavioral traits that have served some inherently adaptive processes. The evolution of distinct personality types that dictate variation on various spectrums related to approach/withdrawal, cooperation/competition, and submission/domination exists because they have, under certain circumstances, provided their bearer with some reproductive advantage that ultimately ensured their resistance to extinction. In the following section, we will expand these evolutionary perspectives by exploring personality theories that view behaviors, traits, and motivational dimensions as integral to (mal)adaptive interpersonal processes.
Interpersonal circumplex: From hawks and doves to human personality
Major models of personality theory converge on the observation that personality development and psychopathology center around the two fundamental psychological dimensions of relatedness and self-definition (Blatt, Reference Blatt2008; Luyten & Blatt, Reference Luyten and Blatt2011, Reference Luyten and Blatt2013). Relatedness can be described as the capacity to establish and maintain “meaningful, mutually satisfying, reciprocal interpersonal relationships,” while self-definition is conceptualized as the capacity to establish and maintain “a differentiated, integrated, realistic, essentially positive sense of self” (Luyten & Blatt, Reference Luyten and Blatt2011, p. 54). By extension, disrupted personality development and associated psychiatric disorders may be characterized as reflecting impairments in the capacity for relatedness/attachment, in the capacity for self-definition/identity, or both (for a full review of Blatt's two polarities model, including implications for diagnosis and proposed associations of these dimensions of vulnerability with developmental, environmental, evolutionary, neurobiological, and sociocultural factors, see Blatt, Reference Blatt2008; Luyten & Blatt, Reference Luyten and Blatt2011, Reference Luyten and Blatt2013).
The interpersonal circumplex model (Figure 8; Kiesler, Reference Kiesler1983; Leary, Reference Leary1957; Pincus, Reference Pincus, Lenzenweger and Clarkin2005; Wiggins, Reference Wiggins1979, Reference Wiggins, Kendall and Butcher1982, Reference Wiggins, Cicchetti and Grove1991) provides a rich framework from which to understand dispositional vulnerability to psychiatric disorders and comorbidities in humans. The circumplex organizes interpersonal traits and behaviors around a circle defined by two orthogonal dimensions of dominance versus submission and affiliation versus hostility. These dimensions have also been described in terms of agency versus communion metaconstructs (Bakan, Reference Bakan1966).
The interpersonal circumplex in the context of the “hawks–doves” analogy. Extreme behaviors situated close to the periphery of the circle are more maladaptive than behaviors situated near the central point of origin (Carson, Reference Carson1969; Kiesler, Reference Kiesler1996). For example, unmitigated agency (focus on the self and excluding others) and unmitigated communion (focus on others and excluding the self) have been associated with interpersonal and emotional difficulties as well as poor mental and physical health outcomes (Helgeson & Fritz, Reference Helgeson and Fritz1998, Reference Helgeson and Fritz2000). This is exemplified here in relation to the dominant Hawks and submissive Doves analogy used to explain biobehavioral stress patterns that lead to specific diseases (Korte et al., Reference Korte, Koolhaas, Wingfield and McEwen2005).

Agency refers to strivings for mastery, power, and self-differentiation (i.e., capacity for self-definition), while communion refers to strivings for intimacy, union, and solidarity (i.e., capacity for relatedness/attachment). Agentic acts ranging from dominant to submissive behaviour are therefore behaviors that assert status relative to others. In contrast, however, communal acts ranging from agreeable to hostile behavior can be conceptualized as behaviors that promote versus hinder intimacy and affiliative connection. This model has been linked to individual differences in interpersonal traits (Wiggins, Reference Wiggins1995) and behaviors (Moskowitz, Reference Moskowitz1994), along with a number of other interpersonal factors and processes including sensitivities (Hopwood et al., Reference Hopwood, Ansell, Pincus, Wright, Lukowitsky and Roche2011), values (Locke, Reference Locke2000), problems (Alden, Wiggins, & Pincus, Reference Alden, Wiggins and Pincus1990), social support behaviors (Trobst, Reference Trobst2000), and variability indices (Moskowitz & Zuroff, Reference Moskowitz and Zuroff2004). These develop over time through reciprocal influence and dynamic interactions between individuals.
These dynamic transactions are governed by rules of interpersonal complementarity. While reciprocity is expected along the agentic dimension (i.e., dominance invites submission, and submission invites dominance), correspondence is also expected along the agentic dimension (i.e., warmth invites warmth, and hostility invites hostility), and this pattern holds for other points around the circle (e.g., warm dominance invites warm submission, hostile dominance invites hostile submission, etc.; Carson, Reference Carson1969; Kiesler, Reference Kiesler1983). The negotiation of behavior among conspecifics culminates in the promotion versus disintegration of relational stability. This is thought to be influenced by overt behavioral acts as well as by the covert experience of each individual, such as emotions, perceptions, expectations, interpretations, and other social–cognitive mental representations (see Kiesler, Reference Kiesler1996; Pincus, Reference Pincus, Lenzenweger and Clarkin2005; Pincus & Gurtman, Reference Pincus, Gurtman and Strack2006).
Returning now to evolutionary perspectives of adaptation, the interpersonal circumplex represents a translational platform from which to conceptualize Korte et al.’s (Reference Korte, Koolhaas, Wingfield and McEwen2005) hawks and doves analogy as well as animal work on dominance hierarchies. This model represents stereotypically extreme and inflexible variants of disassociated and hostile-dominant (hawks) versus communal and warm-submissive (doves) interpersonal styles (Figure 8). Evolutionary perspectives in combination with the interpersonal circumplex are used here to highlight individual differences in biobehavioral responses to stress and perceived threat.
A study by Davies et al. (Reference Davies, Sturge-Apple and Cicchetti2011) tested the hawks and doves evolutionary model to delineate the HPA axis profiles of 2-year-old toddlers exposed to interparental aggression. Children who exhibited inhibited and vigilant temperment (doves) exhibited high HPA axis reactivity, while children who manifested aggressive temperament (hawks) exhibited slightly lower HPA axis reactivity. Over the course of 1 year, children with increasing cortisol concentrations experienced increases in internalizing symptoms and decreases in attention and hyperactivity difficulties. These findings are therefore in accord with the hawks and doves evolutionary model of AL (Korte et al., Reference Korte, Koolhaas, Wingfield and McEwen2005) and shed light on the development of diverse biobehavioral responses to interpersonal adversity. In sum, normative responses to stress involve temperament patterns and eventual personality dispositions that are essential to our understanding of personality disorders and how these are linked to comorbidities.
As the hawks–doves analogy exemplifies, the evolution of particular traits can have survival benefits under circumscribed circumstances. From a dimensional perspective, however, maladaptation occurs when extreme variations on these traits are mismatched to the demands of the psychosocial environment. The interpersonal circumplex describes a continuum from adaptive to maladaptive personality processes. For example, the tendency to respond with a restricted range of behaviors to a variety of interpersonal situations is maladaptive (Leary, Reference Leary1957). However, recent work suggests that high levels of behavioral variability, as seen in borderline personality disorder, are also associated with interpersonal dysfunction (Russell, Moskowitz, Zuroff, Sookman, & Paris, Reference Russell, Moskowitz, Zuroff, Sookman and Paris2007). For example, covert internal processes such as parataxic distortions (discrepancies between the proximal situation and covert experience) represent both a consequence and a predictor of maladaptive interpersonal experience. In the following section, we will discuss how personality traits are associated with interpersonal processes that can lead the development, maintenance, and comorbid manifestation of physical and psychological problems (see Andersen & Bienvenu, Reference Andersen and Bienvenu2011; Bienvenu et al., Reference Bienvenu, Nestadt, Samuels, Costa, Howard and Eaton2001; Krueger, McGue, & Iacono, Reference Krueger, McGue and Iacono2001; Shiner, Masten, & Roberts, Reference Shiner, Masten and Roberts2003).
Personality Traits and AL
Personality traits and associated interpersonal processes are linked with psychopathology and comorbidity in accordance with the principles of equifinality and multifinality. A single vulnerability factor (e.g., impulsivity or insecure attachment) may be implicated in the development of multiple disorders, and a single psychiatric disorder may result from a multitude of distinct vulnerabilities and developmental pathways (Beauchaine et al., Reference Beauchaine, Klein, Crowell, Derbidge and Gatzke-Kopp2009). Much research has converged on the notion that psychopathology and comorbidity are best understood as manifestations of dimensional liability factors in complex interaction with biologically and environmentally based developmental variables.
The following are examples of personality traits that have been linked to studies using multisystemic AL algorithms or informed by allostatic theory. This provides a multidimensional perspective whereby evolutionarily preserved biobehavioral patterns can become biologically taxing and lead to psychiatric symptomatologies.
Attachment insecurity
Attachment insecurity is thought to emerge via repeated interactions with unpredictable, inconsistent, or unresponsive attachment figures that interfere with the development of coherent self-representations, capacity to mentalize, effective emotional regulation, and healthy interpersonal functioning (Bowlby, Reference Bowlby1988; Fonagy, Gergely, & Jurist, Reference Fonagy, Gergely and Jurist2002; Mikulincer & Shaver, Reference Mikulincer and Shaver2007). Over time, such as in the case of CM and early adversities, individuals with insecure attachment styles fail to experience the coregulatory benefits of secure attachment patterns, which can lead to impaired coping in the face of stressful life events. Using the interpersonal circumplex, the dimension of attachment avoidance, described as “discomfort depending on others” (Mikulincer & Shaver, Reference Mikulincer and Shaver2007, p. 87), may be viewed as reflecting agentic concerns, while the dimension of attachment anxiety, described as “fear of rejection and abandonment” (Mikulincer & Shaver, Reference Mikulincer and Shaver2007, p. 91), may be viewed as reflecting communal concerns (see also Luyten & Blatt, Reference Luyten and Blatt2013; Pincus, Reference Pincus, Lenzenweger and Clarkin2005).
Attachment insecurity is thought to interact with genetic, neurobiological, environmental, and developmental factors to confer broad vulnerability to mental health problems (Mikulincer & Shaver, Reference Mikulincer and Shaver2012). Evidence suggests that attachment insecurity is associated with a range of psychiatric disorders, including depression, anxiety disorders, personality disorders, PTSD, eating disorders, and schizophrenia, as well as with elements of psychological distress such as emotional dysregulation and behavioral inhibition (e.g., Cantazaro & Wei, Reference Cantazaro and Wei2010; Crawford et al., Reference Crawford, Livesley, Jang, Shaver, Cohen and Ganiban2007; Doron, Moulding, Kyrios, Nedeljkovic, & Mikulincer, Reference Doron, Moulding, Kyrios, Nedeljkovic and Mikulincer2009; Ein-Dor, Doron, Solomon, Mikulincer, & Shaver, Reference Ein-Dor, Doron, Solomon, Mikulincer and Shaver2010; Gormley & McNiel, Reference Gormley and McNiel2010; Illing, Tasca, Balfour, & Bissada, Reference Illing, Tasca, Balfour and Bissada2010; Mikulincer & Shaver, Reference Mikulincer and Shaver2007).
Attachment insecurity has also been viewed as a core feature of personality disorders (Crawford et al., Reference Crawford, Livesley, Jang, Shaver, Cohen and Ganiban2007; Meyer & Pilkonis, Reference Meyer, Pilkonis, Lenzenweger and Clarkin2005) and linked to a variety of developmental, environmental, and neurobiological factors in this clinical population (Fonagy, Luyten, & Strathearn, Reference Fonagy, Luyten and Strathearn2011; Herpertz & Bertsch, Reference Herpertz and Bertsch2015; Stanley & Siever, Reference Stanley and Siever2010). Insecure–anxious attachment has been linked to Livesley's (Reference Livesley1991) concept of emotional dysregulation and associated with histrionic, dependent, and borderline personality disorder, while insecure–avoidant attachment has been linked to Livesley's concept of inhibition and associated with avoidant and schizoid personality disorders.
Hyperreactivity of the attachment system, as seen in the insecure–anxious attachment style associated with emotional dysregulation, has been theoretically linked to dysregulation and/or alterations in neuropeptide functioning, including oxytocin, vasopressin, and endogenous opioids (Fonagy et al., Reference Fonagy, Luyten and Strathearn2011; Herpertz & Bertsch, Reference Herpertz and Bertsch2015; Stanley & Siever, Reference Stanley and Siever2010). This work is supported by broader evidence for the role of oxytocin in social bonding (e.g., Meyer-Lindenberg, Domes, Kirsch, & Heinrichs, Reference Meyer-Lindenberg, Domes, Kirsch and Heinrichs2011; Olff et al., Reference Olff, Frijling, Kubzansky, Bradley, Ellenbogen and Cardoso2013), and with literature suggesting that disturbed parent–child attachment and early maltreatment may be associated with neurobiological consequences such as a decreased threshold for stimulation and activation of stress responses (Hassel, McKinnon, Cusi, & MacQueen, Reference Hassel, McKinnon, Cusi and MacQueen2011; Mayes, Reference Mayes2000, Reference Mayes2006). Attachment processes can be further disrupted in the context of adverse environments and disengagement of caregiving.
Several studies by the group of Evans have elegantly demonstrated that AL is related to attachment processes such as maternal responsiveness within the context of early adversity. This work has used various factors related to crowding, noise, housing problems, family separation/turmoil, violence, income to needs ratio, single parent status, and maternal high school dropout to index cumulative risk factors. The authors have shown that AL is associated to cumulative risk factors at age 9 (Evans, Reference Evans2003), to the interaction between such adversities and low maternal responsiveness at age 13 (Evans, Kim, Ting, Tesher, & Shannia, Reference Evans, Kim, Ting, Tesher and Shannis2007), and that a longer duration of time in such adversities is linked to working-memory impairments at age 17 (Evans & Schamberg, Reference Evans and Schamberg2009). In line with differential susceptibility theory, emotionality was associated with higher AL if maternal responsiveness was low, but with lower AL when maternal responsiveness was high (Dich, Doan, & Evans, Reference Dich, Doan and Evans2015).
At an even earlier age, cortisol reactivity moderates the effect of parenting on change in temperament from age 3 to 6 years, such that highly reactive kids have increases in negative emotionality in the context of a poor-quality mother–child relationship, whereas less reactive children experienced increases in positive emotionality in the context of a high-quality mother–child relationship (Kopala-Sibley et al., Reference Kopala-Sibley, Dougherty, Dyson, Laptook, Olino and Bufferd2015). Shaped by early attachment processes, emotionality is therefore a potential risk factor for AL due in part to self-regulatory skills (Evans & Fuller-Rowell, Reference Evans and Fuller-Rowell2013). Throughout life span development, the experience of adversities effects emotional adjustment to these threatening environments that may cause stress pathophysiology and exacerbate maladaptive personality trajectories (Stephan, Sutin, Luchetti, & Terracciano, Reference Stephan, Sutin, Luchetti and Terracciano2015).
Hostility
Hostility refers to a general tendency to be aggressive, distrusting, and devaluing the worth of others (Cook & Medley, Reference Cook and Medley1954). Hostility has historically been linked to cardiovascular disease risk (Barefoot, Dahlstrom, & Williams, Reference Barefoot, Dahlstrom and Williams1983) as the central construct comprising the infamous Type A personality pattern (Sapolsky, Reference Sapolsky2004). A study by Kubzansky, Kawachi, and Sparrow (Reference Kubzansky, Kawachi and Sparrow1999) was the first to link hostility to AL. Using data from the Normative Aging Study, the authors found that all dimensions of hostility (cognitive, affective, and behavioral) were higher among less educated individuals, and high hostility was in turn associated with high AL measured with blood pressure, glucose, lipids, waist to hip ratio, and catecholamines. Hostility mediated the association between socioeconomic status and AL in multivariate analysis; however, the main effect of education was attenuated (Kubzansky et al., Reference Kubzansky, Kawachi and Sparrow1999).
In a separate study using data from the Chicago Health, Aging, and Social Relations Study, race/ethnically diverse men and women between ages 21 to 80 also showed similar patterns. Specifically, hostility as well as poor sleep quality mediated the association between socioeconomic strata, and AL indexed with blood pressure, lipids, catecholamines, cortisol glucose, and waist to hip ratio (Hawkley, Lavelle, Bernston, & Cacioppo, Reference Hawkley, Lavelle, Berntson and Cacioppo2011). Future research would do well to further explore how personality traits such as hostility mediate or moderate associations between demographic factors such as socioeconomics and AL.
Impulsivity
Impulsivity is defined as the tendency to engage in behavior without reflection or consideration of consequences. Impulsivity subsumes a number of interrelated constructs including difficulty with response inhibition, risk taking, and hypersensitivity to immediate rewards (de Wit, Reference de Wit2009). While a certain degree of impulsivity may be adaptive in situations requiring quick decision making (de Wit, Reference de Wit2009), elevated levels are generally maladaptive and may lead to inappropriate or high-risk behaviors. Trait impulsivity has also been linked to externalizing disorders such as attention-deficit/hyperactivity disorder, oppositional defiant disorder, and conduct disorder as well as externalizing behaviors such as substance abuse and aggression (e.g., de Wit, Reference de Wit2009; Eisenberg et al., Reference Eisenberg, Valiente, Spinrad, Liew, Zhou and Losoya2009; Krueger et al., Reference Krueger, Hicks, Patrick, Carlson, Iacono and McGue2002; Krueger, Markon, Patrick, Bennin, & Kramer, Reference Krueger, Markon, Patrick, Benning and Kramer2007; Olson, Schilling, & Bates, Reference Olson, Schilling and Bates1999).
From a developmental psychopathology perspective, Beauchaine and McNulty (Reference Beauchaine and McNulty2013) argue that trait impulsivity confers risk for externalizing problems via dysfunction of the mesolimbic dopamine (DA) system (see also Beauchaine & Gatzke-Kopp, Reference Beauchaine and Gatzke-Kopp2012; Beauchaine et al., Reference Beauchaine, Klein, Crowell, Derbidge and Gatzke-Kopp2009). In essence, this transactional model proposes that mesolimbic DA dysregulation generates an aversive mood state that individuals are motived to avoid via reward- and novelty-seeking behaviors that produce immediate, albeit short-lived, relief. Over time, the individual seeks greater and more enduring reward that can be further exacerbated by high-risk environments and preexisting vulnerabilities. This may then culminate in a progression from less destructive (e.g., hyperactivity or impulsivity) to more destructive (e.g., substance use or antisocial behavior) externalizing problems (Beauchaine & McNulty, Reference Beauchaine and McNulty2013). Beauchaine and McNulty's (Reference Beauchaine and McNulty2013) model suggests that observed links between impulsivity and externalizing problems, as well as comorbidity among externalizing disorders, is best understood in terms of complex, bidirectional, self-reinforcing transactions between individuals with high trait impulsivity/mesolimbic DA dysregulation and their environments over time. This highlights the link between impulsivity and externalizing problems as an example of multifinality.
To the best of our knowledge, impulsivity has not been directly studied using multisystemic AL algorithms. Instead, allostatic states for specific biomarkers have been discussed. For example, abnormally low mesolimbic DA due in part to the deleterious effects of maturational perturbations early in life may be linked to impulsivity that is in turn related to antisocial personality development, alcoholism, and substance abuse (Beauchaine, Neuhas, Zalewski, Crowell, & Potapova, Reference Beauchaine, Neuhaus, Zalewski, Crowell and Potapova2011). In the context of drug addiction, impulsivity is central to the cycle of abuse revolving around emotions and behaviors, from binge/intoxication and withdrawal/negative affect, to preoccupation/anticipation each related to oscillations in HPA axis, SAM axis, opiods, and NPY functioning to name a few (George, Le Moal, & Koob, Reference George, Le Moal and Koob2012; Koob, Reference Koob2015). Future developmental research using multilevel analyses of emotion dysregulation (for an excellent review, see Beauchaine, Reference Beauchaine2015) would be well complemented by AL algorithms.
Further investigation using multisystemic approaches that summarize dysfunction could be helpful in identifying comorbid trajectories related to these allostatic mechanisms (Bizik et al., Reference Bizik, Picard, Nijjar, Tourjman, McEwen and Lupien2013). This may be especially pertinent in the study of substance abuse secondary to underlying psychopathology or somatic disease (e.g., pain or impairments). Similarly, stress is a common risk factor for obesity and addiction (Sinha & Jastreboff, Reference Sinha and Jastreboff2013), consistent with our view that biological comorbidities linked to AL factors may underlie overlapping disease processes related to stress processes. Collectively, trait impulsivity together with sensation seeking, antisocial tendencies, and externalizing relate to the broader construct of behavioral disinhibition (see Bogg & Finn, Reference Bogg and Finn2010).
Behavioral inhibition
Behavioral inhibition is associated with externalizing disorders linked to anxiety disorders (Norrholm & Ressler, Reference Norrholm and Ressler2009; Rapee & Coplan, Reference Rapee and Coplan2010; Smoller et al., Reference Smoller, Yamaki, Fagerness, Biederman, Racette and Laird2005). This broad construct is characterized by shyness, withdrawal, submissiveness, distress in response to novel events, and a tendency to remain close to caregivers (Chorpita & Barlow, Reference Chorpita and Barlow1998; Hirshfeld et al., Reference Hirshfeld, Rosenbaum, Biederman, Bolduc, Faraone and Snidman1992; Hirshfeld-Becker et al., Reference Hirshfeld-Becker, Micco, Henin, Bloomfield, Biederman and Rosenbaum2008). For example, socially anxious individuals tend to maintain a passive interpersonal stance characterized by submissive, inhibited behavior, and decreased assertion (e.g., Creed & Funder, Reference Creed and Funder1998; Leary, Knight, & Johnson, Reference Leary, Knight and Johnson1987; Oakman, Gifford, & Chlebowsky, Reference Oakman, Gifford and Chlebowsky2003; Russell et al., Reference Russell, Moskowitz, Zuroff, Bleau, Pinard and Young2011).
Behavioral inhibition among anxious individuals is generally conceptualized as part of a broader fear-based self-protective response to perceived threat (Fox, Henderson, Marshall, Nichols, & Ghera, Reference Fox, Henderson, Marshall, Nichols and Ghera2005; Gilbert & Trower, Reference Gilbert, Trower, Crozier and Alden2001; Russell et al., Reference Russell, Moskowitz, Zuroff, Bleau, Pinard and Young2011) that is linked with an insecure–anxious attachment style (Vaughn & Bost, Reference Vaughn, Bost, Cassidy and Shaver1999; Vaughn, Bost, & van Ijzendoorn, Reference Vaughn, Bost, van IJzendoorn, Cassidy and Shaver2008). In a recent paper, Nolte, Guiney, Fonagy, Mayes, and Luyten (Reference Nolte, Guiney, Fonagy, Mayes and Luyten2011) proposed that diverse vulnerability factors like behavioral inhibition, HPA axis dysfunction, and maladaptive fear appraisal strategies associated with attentional bias to threat interact with pre- and postnatal environmental factors and contribute to the development of an insecure attachment style characterized by hyperactivating strategies such as frantic proximity seeking and persistent fear of abandonment.
While these hyperactivating strategies may be rewarded in the short term, when repeated over time, they ultimately interfere with the individual's ability to develop supportive social relationships (Campbell, Simpson, Boldry, & Kashy, Reference Campbell, Simpson, Boldry and Kashy2005) and adaptive stress regulation strategies (Luijk et al., Reference Luijk, Saridjan, Tharner, van IJzendoorn, Bakermans-Kranenburg and Jadow2010; Lupien et al., Reference Lupien, McEwen, Gunnar and Heim2009; Powers, Pietromonco, Gunlicks, & Sayer, Reference Powers, Pietromonaco, Gunlicks and Sayer2006). Over the long term, it is presumed that these strategies both contribute to and are maintained by deficits in social–cognitive (e.g., abilty to mentalize or comprehend the mental states of self and other; Fonagy, Reference Fonagy1998; Fonagy et al., Reference Fonagy, Gergely and Jurist2002) and stress regulation capacities. Over the course of a lifetime, this could interfere with adaptive interpersonal functioning, leading to chronic anxiety conditions, and ultimately to AL and psychiatric diagnoses. To date, we know of no AL study related to behavioral inhibition and propose that this may be an interesting avenue to explore in relation to Hawks and Doves.
Neuroticism
One of the most widely studied traits in the area of psychopathology is neuroticism. Neuroticism is characterized by increased vulnerability to experience negative emotional states such as sadness, anger, frustration, fear, anxiety, worry, and self-consciousness in the face of stress or perceived threat (Costa & McCrae, Reference Costa and McCrae1992). High neuroticism may place the individual at explicit risk for psychiatric disorders, particularly mood and anxiety disorders, by directly increasing the intensity and frequency of negative affective states.
Numerous studies have documented links between neuroticism and psychiatric disorders (e.g., Bienvenu et al., Reference Bienvenu, Nestadt, Samuels, Costa, Howard and Eaton2001; Malouff, Thorsteinsson, & Schutte, 2005; Weinstock & Whisman, Reference Weinstock and Whisman2006), physical health problems (e.g., Goodwin, Cox, & Clara, Reference Goodwin, Cox and Clara2006; Lahey, Reference Lahey2009), and comorbidity (e.g., Jylhä, Melartin, & Isometsä, Reference Jylhä, Melartin and Isometsä2009; Khan, Jacobson, Gardner, Prescott, & Kedler, Reference Khan, Jacobson, Gardner, Prescott and Kendler2005). The association between neuroticism and comorbidity is particularly striking. For example, Khan et al. (Reference Khan, Jacobson, Gardner, Prescott and Kendler2005) reported that variability in trait neuroticism accounted for 20%–45% of comorbidity among internalizing disorders (depression and anxiety disorders) and 19%–88% of the comorbidity between internalizing and externalizing disorders (alcohol and substance dependence as well as antisocial personality and conduct disorder).
Strained emotional regulation among neurotic individuals may lead to increased AL over time by further sensitizing stress reactivity. It has been shown that neuroticism is related to exaggerated HPA axis responsivity to stressors (Eysenck & Eysenck, Reference Eysenck and Eysenck1985) as well as higher resting cortisol throughout the day (Miller, Cohen, Rabin, Skoner, & Doyle, Reference Miller, Cohen, Rabin, Skoner and Doyle1999). Notwithstanding, it has been suggested that neuroticism may be more associated with symptom complaints than with biological components of disease processes (Chapman et al., Reference Chapman, Khan, Harper, Stockman, Fiscella and Walton2009; Miller et al., Reference Miller, Cohen, Rabin, Skoner and Doyle1999).
A recent study by Stephan et al. (Reference Stephan, Sutin, Luchetti and Terracciano2015) examined personality traits and changes over 4 years in relation to AL using the Health and Retirement Study of over 5,200 Americans between 50 and 99 years of age. While neuroticism was associated with AL at baseline, higher AL was not associated with increases in neuroticism over time (Stephan et al., Reference Stephan, Sutin, Luchetti and Terracciano2015). Instead, higher AL was associated with declines in conscientiousness, agreeableness, and extraversion over time and quadratic decline in openness to experience.
Likewise, in a separate study, the activity facet of extraversion that reflects dispositional vigor (as opposed to sociability and positive emotions) was protective against the inflammatory cytokine interleukin-6 (Chapman et al., Reference Chapman, Khan, Harper, Stockman, Fiscella and Walton2009). Extraversion activity (e.g., being full of vital energy) may explain individual variation in biologically based reserves of energy (e.g., mitochondria) that is a basic dimension of temperament that develops early in life and pervades into adulthood (Caspi, Reference Caspi2000).
As we age, a constellation of personality changes may be related to behavioral, emotional, and cognitive functioning that are intertwined with AL (Stephan et al., Reference Stephan, Sutin, Luchetti and Terracciano2015). Despite the lack of association with neuroticism by the Stephan et al. (Reference Stephan, Sutin, Luchetti and Terracciano2015) study, the authors contend that lifestyle limitations associated with AL (e.g., physical decline, cognitive impairment, and chronic diseases) may restrict prosocial behaviors, leading in turn to irritability, hostility, and various aversive personality traits that are symptomatic of biological deterioration. This is an essential point with regard to our discussion of biological comorbidities as contributors of psychopathology that can occur as the result of multiple interconnected and mutually reinforcing factors at the interface of biological and psychosocial interactions.
Conclusions
The marriage of homeostatic and allostatic theory provides a powerful way to assess stress-disease pathways (Goldstein & Kopin, Reference Goldstein and Kopin2007). Under conditions of cumulative stress, multisystemic activities “wax and wane” with the “wear and tear” exacted by AL (McEwen & Wingfield, Reference McEwen and Wingfield2003). This multisystemic strain is at the core of biological comorbidity that can be assessed using multisystemic AL algorithms designed for research purposes and hopefully clinical practice. Our goal in defining allostasis, allostatic states, AL, MAL, and allostatic overload in turn has been to explicate how adaptive processes and distinct, evolutionarily preserved biobehavioral responses can become maladaptive.
The causes and consequences of AL are legion. In summarizing the AL literature in Figure 9, key associations thus far identified are holistically represented to exemplify the importance of comprehensive measurement approaches that collectively assess interconnected domains using multiple disciplinary tools. This triangulation of methodologies is at the heart of transdisciplinary perspectives of chronic stress (Juster, Bizik, et al., Reference Juster, Bizik, Picard, Arsenault-Lapierre, Sindi and Trepanier2011). Taken together, the risk and protective factors that drive AL are multidimensional and transcend any simple categorizations. This complexity renders it difficult to predict specific stress-related disease(s) and comorbidities using traditional disciplinary approaches in isolation. We propose that mitochondrial biology, epigenetic approaches, and evolutionary thinking of personality development can help us refine our repertoire of measurement approaches and conceptualizations of stress (patho)physiology.
Transdisciplinary summary of the allostatic load literature (Juster et al., Reference Juster, Seeman, McEwen, Picard, Mahar, Mechawar and Cicchetti2016). In accordance with review articles (Beckie, Reference Beckie2012; Juster, Bizik, et al., Reference Juster, Bizik, Picard, Arsenault-Lapierre, Sindi and Trepanier2011; Juster et al., Reference Juster, McEwen and Lupien2010), black triangles represent the identified antecedents of allostatic load, white triangles represent the biological systems that have traditionally been used to index allostatic load, and the gray circles represent health outcomes correlated or predicted by allostatic load.

Our distinction regarding biological comorbidities inherently overlaps with psychiatric comorbidities. This mind–body differentiation is arbitrary and done here in the interests of avoiding confusion with traditional definitions of comorbidities as etiologically distinct disease processes. Moreover, the presence or absence of a disease as a binary classification is also deceptive. Numerous authors have likewise called for revision of the psychiatric nomenclature to better reflect the dimensional nature of mental disorders (Clark, Reference Clark2005; Krueger, Reference Krueger2005; Luyten & Blatt, Reference Luyten and Blatt2011) and for a new definition of comorbidity in terms of a liability spectrum rather than in terms of associations between discrete categorical entities (Krueger & Markon, Reference Krueger and Markon2006). Such perspectives are more harmonious with the principles of equifinality (different beginnings leading to the same outcome) and multifinality (different outcomes resulting from the same beginning) that exist along numerous dimensions that affect multimorbidity and comorbidity.



