


Nomenclature
- FSW
-
Friction Stir Welding
- TWI
-
The Welding Institute
- WNZ
-
Weld Nugget Zone
- HAZ
-
Heat Affected Zone
- GTAW
-
Gas Tungsten Arc Welding
- GC
-
Galvanic Corrosion
- UIT
-
Ultrasonic Impact Treatment
- OCP
-
Open Circuit Potential
- SEM
-
Scanning Electron Microscope
- ANOVA
-
Analysis of Variance
- SN ratio
-
Signal to Noise ratio
1.0 Introduction
Friction stir welding (FSW) is a solid-state welding method developed in the United Kingdom by TWI. It is used to generate similar and dissimilar junctions of aluminum, magnesium and their alloys, as well as other materials, such as steel. The joints produced by FSW of these alloys are better than those produced by the conventional fusion weld because the base metal is not subjected to melting and solidification. Due to its high strength-to-weight ratio, the aerospace, naval and defence industries make extensive use of AA2014 aluminum alloy. Due to the metal’s susceptibility to heated fracture and porosity, it is challenging to weld these alloys using conventional fusion welding techniques. Consequently, FSW is used to join these alloys. The aluminum alloy 2014 reacts to thermal treatment. Copper, manganese, magnesium and silicon are the primary alloying components.
Jariyaboon et al. [Reference Jariyaboon, Davenport, Ambat, Connolly, William and Price8] examined the influence of welding parameters upon the pitting of friction stir-welded AA2024-T351 aluminium alloy. Maggiolino and Schmid [Reference Maggiolino and Schmid13] have investigated the corrosion resistance of FSW and MIG aluminium alloy six series welded connections. Xu and Liu [Reference Xu and Liu25] studied the pitting corrosion of various positions (top, middle, and bottom) of the weld nugget zone (WNZ) in the FSW joints of 2219-O aluminium alloy in alkaline chloride solution. It is observed that the material at the top has the highest corrosion potential compared to the material at the bottom and the base. Kang et al. [Reference Kang, Fu, Luan, Dong and He9] studied the pitting corrosion behaviour of friction stir welded AA2024-T3 aluminium alloy joints. The regions between the S phase (Al2CuMg) particles and the adjacent aluminium base have been identified as the origins of pitting corrosion.
Bousquet et al. [Reference Bousquet, Poulon-Quintin, Puiggali, Devos and Touzet3] studied the corrosion susceptibility of friction stir-welded AA2024-T3 joints. The heat affected zone (HAZ) region is observed to be more susceptible to intergranular corrosion and pitting corrosion [Reference Sato, Kokawa and Kurihara20]. Fahimpour et al. [Reference Fahimpour, Sadrnezhaad and Karimzadeh6] studied the corrosion behaviour of the aluminium alloy AA6061 in joints welded with friction stir welding and gas tungsten arc welding (GTAW). FSW grains are documented to be more resistant to corrosion than GTAW grains. Mosleh et al. [Reference Mosleh, Mahmoud, Mahmoud and Khalifa14] also found that the T6 treatment enhanced the corrosion resistance of both welds. D’Urso et al. [Reference D’Urso, Giardini, Lorenzi, Cabrini and Pastore4] analysed the mechanical properties and corrosion behaviour of friction stir welded AA2024 and AA7075 aluminium alloys. They have reported that the spontaneous corrosion potential is more anodic in low hardness regions. Due to the potential difference, galvanic corrosion occurred in the less noble area.
Shyamlal et al. [Reference Shyamlal, Shanmugavel, Jappes, Nair, Ravichandran, Abuthakeer, Prakash, Dixit and Vatin21] have examined the corrosion behaviour of friction stir welded aluminum alloy AA8090-T87. They have reported that the joint with higher weld speed (110 mm/min) had a larger density of pits than the joint with lower weld speed (90 mm/min). This is because the joint with higher weld speed (110 mm/min) has a higher weight percentage of Cu and hydroxides that occur during the corrosion mechanism. Gupta et al. [Reference Gupta, Haridas, Agrawal, Mishra and Doherty7] examined the effects of welding settings on the microstructure, mechanical properties and corrosion resistance of that was friction stir welded Al 7017 alloy. As per their findings, joints with a greater traverse speed exhibit superior corrosion resistance and higher yield strength, while joints with a slower traverse speed display poorer corrosion resistance and lower yield strength. Lu et al. [Reference Lu, Xu, Wang and Wang12] investigated the impact of microstructural heterogeneity on galvanic corrosion (GC) in the weld nugget zone (WNZ) of the dissimilar AA7050-AA2024 friction stir welding joint. According to their study, local AA7050-WNZ’s corrosion resistance was significantly deteriorated by a rise in the amount of solid-solutioned Zn and the number of intergranular MgZn2. In contrast, local AA2024-WNZ’s corrosion resistance was marginally enhanced by grain refining and fragmented Al2Cu. The effects of traverse speed and rotary tool speed on the microstructure, mechanical characteristics, and corrosion behaviour of the dissimilar friction stir welds of Mg alloy AZ31B and Al alloy AA6061 were investigated by Arya et al. [Reference Arya, Sathiaraj, Jain, Jayaprakash and Saxena1] According to their reports, the weld zone of the magnesium alloy area was more corroded and had more gaps and cracks than the aluminum alloy side. The microstructure and corrosion behaviour of a FSWjoint made of aluminum-lithium alloy, 2195-T8, were examined by Deng et al. [Reference Deng, Wang, Wang, Song and Zhang5] using microscopy and salt spray corrosion experiments. Tests using salt spray corrosion in a 3.5% NaCl solution at various pH levels and spraying times were used to determine the rate of corrosion of the FSW joints. The average depth of corrosion is positively connected with the corrosion rate, and the rate of corrosion decreased as pH values increased. Also, it was shown that while the average corrosion depth tended to rise with increased spraying duration, the corrosion rate dropped.
The impact of microstructure on the mechanical and corrosion behaviour of AA2219 and AA2519 FS welds was investigated by Prasad et al. [Reference Prasad, Rao and Reddy16] Based on the results, it was noted that AA2519 welds had better mechanical qualities and corrosion resistance than AA2219 welds. They have also reported that the enhanced corrosion resistance of AA2519 Al-alloys and their welds may be due to the strengthening precipitates Al2CuMg, Al3Zr and Al3Ti, which offer an insulating channel for galvanic cell formation between the Al2Cu and Al matrix. Qian et al. [Reference Qian, Zhang, Chen, Xie, Chen, Lin and Li18] examined how friction stir welding joints made of 2219 aluminum alloy behaved in terms of corrosion and microstructure after undergoing ultrasonic impact treatment (UIT). The study revealed that under a salt spray corrosion atmosphere, the UIT enhanced the intergranular corrosion resistance of FSW joints made of 2219 aluminum alloy.
There were researches carried out in the recent past on the corrosion characteristics of friction stir welded aluminum alloy joints. However, there are very few works which analyses the effect of process parameters on the corrosion characteristics of aluminum alloy AA2014. However, the results lack statistical analysis for the corrosion rate. This work focuses on the corrosion characteristics of friction stir welded AA2014 aluminum alloy joints and attempts to figure out the impact of various friction stir welding parameters on the corrosion characteristics through statistical analysis.
2.0 Materials and methods
2.1 Process parameters
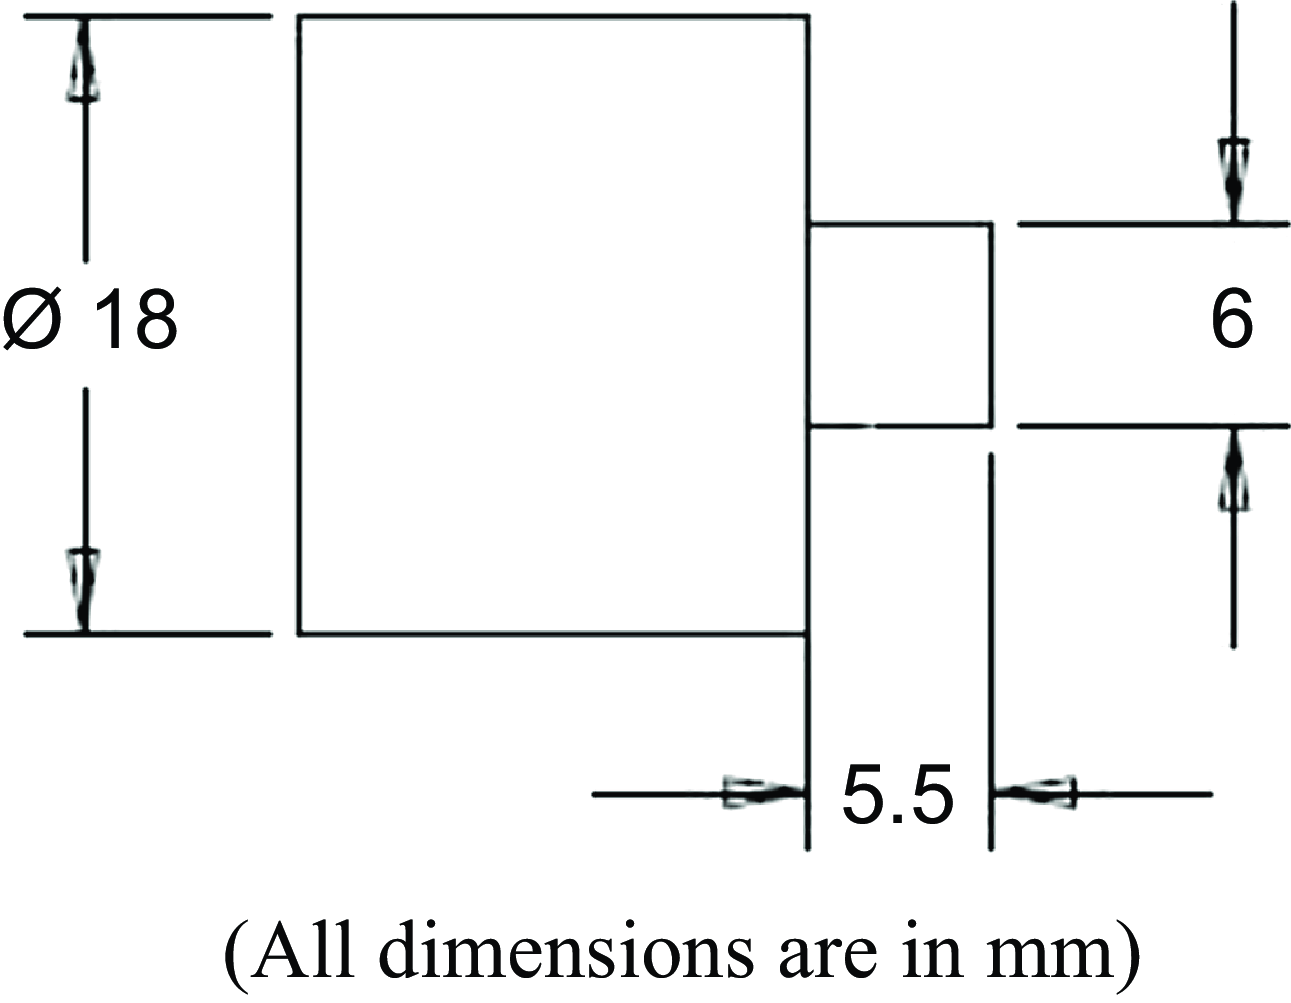
The plates of 6mm thick are cut to dimensions of 100 × 50 mm. The friction stir welding tool is made of H13 tool steel, with a square profiled pin. The length of the pin is 5.5 mm and the tool shoulder diameter is 18 mm. The tool is tilted to an angle of 2° during welding to produce an optimal heat input, material flow and pressure balance. The plates are welded in the direction perpendicular to the direction of rolling of the plate to make butt joints.
The fixture used in friction stir welding should satisfy several requirements to maintain the work-piece stability. In FSW number of forces like downward force, transverse force, lateral force is applied on tool hence heavy clamping is necessary to keep the plates together. Fixture must be able to hold the plates to be welded rigidly to get desired quality of welds. Holding plates provide locking forces to hold the plates in place. The friction stir welding fixture and tool used in the process is shown in Fig. 1. The tool must be made from a material that can withstand the process and offer enough frictional heat generation. The tool material must be sufficiently stronger and more wear resistant than the material to be welded and must also have a higher melting temperature. The tool used in this investigation is made of H13 tool steel [Reference Kannusamy and Ramasamy10]. The shoulder is made flat and the pin is made into a straight square profile. The dimensions of the tool are shown in Fig. 2.
Friction stir welding fixture and tool.

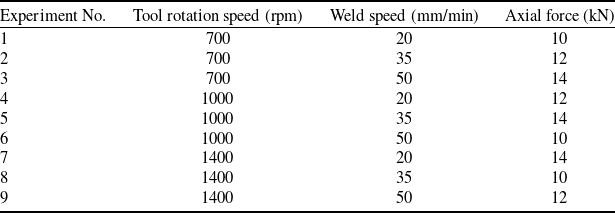
Around 50 trial welds have been conducted with varying process parameters to determine the effective range of process parameters. The welds were subjected to ultrasonic testing and radiography to qualify them. Welds generated at velocities greater than 50 mm/min contain tunnel defects and fractures; therefore, the weld speed is restricted to 50 mm/min. In a similar fashion, the greatest rotational speed of the tool is 1400 rpm. Table 1 shows the process parameter values.
Friction stir welding process parameters

During the welding process, the tool is inclined at an angle of 2 degrees, while other tool parameters such as tool shape, pin length and shoulder diameter remain constant throughout the experiment. Taguchi L9 orthogonal array is chosen for the study with three factors at three levels [Reference Ashok and Ponni Alias Sathya2]. The Taguchi experimental design matrix is shown in the Table 2.
Taguchi design matrix for FSW process parameters

Dimensions of the FSW tool.

2.2 Corrosion characteristics
Specimens for electrochemical test have been cut along the weld zone. Different zones (advancing, retreating and nugget) are exposed to the electrolyte in all the experiments. The remaining unaffected areas of the specimen are painted in black to protect it from the corrosion environment. Electrochemical experiments are performed using CHI660C electrochemical work station controlled through a personal computer. The electrochemical workstation used in the experiments is shown in Fig. 3. The electrochemical cell is shown in Fig. 4.
Electrochemical work station.

Electrochemical cell.

Surfaces of the specimens are mechanically polished using silicon carbide sheets (grade starting from 100 to 1200 μm) and then they are rinsed in distilled water before being used for each electrochemical experiment. Corrosion test is carried out in 3.5% of NaCl solution. The reference electrode employed in this experiment is Ag/AgCl electrode. All the potential data taken are referred to this Ag/AgCl reference electrode potential. The counter electrode used here is platinum wire loop and work piece is made as working electrode.
The corrosion rates of welded specimens can be determined using electrochemical measurement techniques. The polarisation test is frequently used to evaluate the corrosion rate of FSW joints by measuring the corrosion current density, which can be related to the material’s corrosion rate. The polarisation curve helps to identify specific corrosion mechanisms such as pitting, uniform corrosion, or galvanic corrosion, which are critical in understanding the corrosion behaviour of different microstructural zones in FSW joints [Reference Soto-Diaz, Sandoval-Amador, Escorcia-Gutierrez and Unfried-Silgado23]. In polarisation resistance, specimens are polarised a few millivolts above and below the open-circuit potential, then the current response is measured. The open circuit potential (OCP) is the potential of the working electrode relative to the reference electrode when no current or voltage is applied to the cell [Reference Qin, Zhang, Sun and Zhuang19].
Li et al. [Reference Li, Li, Yang and Alexopoulos11] conducted the corrosion tests on friction stir welded AA2024-T3 joints using two different corrosion solutions: a 3.5% NaCl solution (to simulate a marine environment) and an EXCO solution (to simulate more aggressive corrosion conditions, commonly used to assess exfoliation corrosion in aluminum alloys). Electrochemical polarisation tests were conducted to evaluate the corrosion rates in various regions of the weld: the weld nugget (stir zone), HAZ and base material. The polarisation curves provided insights into how each zone responded to the corrosive environment in terms of corrosion potential and current density, both key indicators of corrosion resistance [Reference Oladele, Betiku and Fakoya15].
The corrosion rates of the welded samples are determined by conducting accelerated corrosion testing in the 3.5% NaCl solution. The OCP of the samples are obtained by immersing the samples in the solution until the potential become stable. The specimens are subjected to polarisation and Tafel plots are obtained. From the Tafel plots the corrosion rate of the sample are calculated using the software in the electrochemical workstation. The tests were repeated thrice and the average values are taken for consideration.
A Tafel plot is a graphical representation that illustrates the connection between an electrochemical cell’s current production and a particular metal’s electrode potential. The kinetics of an electrochemical reaction can be studied using a Tafel plot, especially when figuring out how quickly the reaction happens in relation to the overpotential. According to the Tafel equation, the graph shows the relationship between the overpotential (η) and current density (i) in an electrode response.
The Tafel equation is written as:
 \begin{align}\eta {\rm{\;}} = {\rm{\;}}a + b{\rm{\;log}}(j)\; \end{align}
where:
-
 $\eta$
is the overpotential (in volts).
-
j is the current density (in A/m2).
-
a is the intercept, which is related to the exchange current density (io).
-
b is the Tafel slope, indicating the sensitivity of the reaction rate to changes in overpotential.

The Tafel slope aids in determining the mechanism of the reaction. A small Tafel slope denotes fast kinetics, which means that the reaction rate increases quickly with a slight increase in overpotential. A large Tafel slope indicates slow kinetics, meaning that significant current densities require bigger overpotentials.
The welded samples are sliced in to two halves along the mid plane parallel to the top surface of the samples, so as to expose the top, middle and bottom layers of the samples to corrosion environment. Figure 5 indicates the different layers of welded plate. Experimental procedure for polarisation test is shown in Fig. 6.
Different layers of the welded specimen.

Flow chart for polarisation test procedure.

Conversion of i corr to corrosion rate is done as explained below
From Faraday’s law,
 \begin{align}Q = \frac{{nFm}}{A} = it \end{align}
where
-
Q = coulombs,
-
n = number of electrons,
-
F = the Faraday (96,487 coulombs/equivalent),
-
m = mass (g), A = atomic weight, i = current (A), t = time (s)
Since equivalent weight (EW) = A/n, from (Eq. 1)
 \begin{align}m = \frac{{{\rm{it}}\!\left( {{\rm{EW}}} \right)}}{F} \end{align}
Corrosion rate, CR in (g/s) is given by
 \begin{align}{\rm{CR\;}} = \frac{m}{t} = \frac{{{\rm{i}}\!\left( {{\rm{EW}}} \right)}}{F} \end{align}
Dividing both sides of the equation by electrode area (A) and density (d), corrosion rate, CR in (cm/s) is given by
 \begin{align}{\rm{CR\;}} = \frac{{{\rm{i}}\!\left( {{\rm{EW}}} \right)}}{{{\rm{FdA}}}} \end{align}
Corrosion rate, CR in (mpy) is given by
 \begin{align}{\rm{CR\;}} = 0.13\frac{{{\rm{i}}\!\left( {{\rm{EW}}} \right)}}{d} \end{align}
The corrosion rate of the samples in the top, bottom and middle layers of the sample are measured by preparing weld coupons. The weld coupons are prepared by cutting 1 cm width of the specimen. To expose 1 cm2 area to corrosion media the rest of the specimen are painted in black [Reference Proton, Alexis, Andrieu, Delfosse, Lafont and Blanc17]. The corrosion coupons prepared are shown in Fig. 7. The corrosion rates of the samples are determined by conducting the polarisation test.
Corrosion test samples. (a) Top layer specimens (b) Middle layer specimens (c) Bottom layer specimens.

2.3 Microstructural examination
The samples for microstructural examination are initially polished using silicon carbide sheets (grade starting from 100 to 1200 μm) fitted in the rotating discs of the disc polishing machine and then to a mirror finish with a diamond paste. The samples are then etched in Keller’s reagent (1.5 ml hydrochloric acid, 2.5 ml nitric acid, 1ml hydrofluoric acid and 95 ml water). Then the specimens are rinsed in distilled water and dried. The specimens obtained have been examined for microstructural changes using SEM.
3.0 Results and discussion
From the electrochemical polarisation test the corrosion potential for the base metal is found to be −0.522V and the corresponding corrosion current value is −5.173A. The anodic and cathodic polarisations are smoother. The Tafel plot of the parent metal is shown in Fig. 8 (a). The Tafel plots obtained for various welded samples are shown in Fig. 8 (b) to (j).
Tafel plots. (a) base metal; (b) sample S1; (c) sample S2; (d) sample S3; (e) sample S4; (f) sample S5; (g) sample S6; (h) sample S7; (i) sample S8; (j) sample S9.

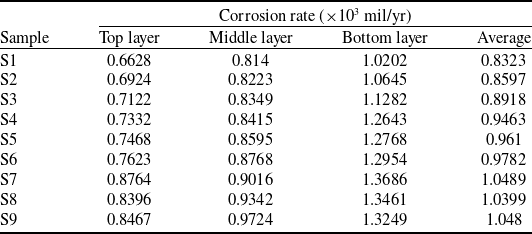
The Tafel slope, exchange current density, and the mechanism of the electrochemical reaction can be ascertained by plotting the logarithm of the current density against the overpotential in a Tafel plot. The curves exhibit a sharp increase in log (current) at a potential of around −0.6V for all the samples. The corrosion rates of the samples are obtained employing equations given in section 2.2 (Eq. 2-6). The corrosion rate of the top, middle and bottom layers are shown in Table 3.
It is observed from the table that the top layers are more passive with respect to the specimen’s bottom and middle layers. During the welding process, the top layer is immediately exposed to the tool shoulder. Here, heat generation is greatest because of the friction between the tool shoulder and the work piece surface, which causes mechanical and thermal changes. This region’s material is subjected to extreme heat and plastic deformation, which can refine the grain and change how precipitates or oxides are distributed. Because of the grain refinement, this region exhibits superior corrosion resistance.
The bottom layer experiences less mechanical stirring compared to the top and middle layers. The tool’s pin may not reach this region as intensely, leading to reduced deformation and heat input. This region retains some of the original grain structure from the base material because it is not as thoroughly stirred or recrystallised. Since the bottom layer having a coarser grain structure and less uniform distribution of alloying elements or precipitates, it is more susceptible to corrosion. The lack of significant grain refinement and uneven distribution of phases results in localised corrosion.
The Taguchi analysis is done using MINITAB software to investigate the effect of process parameters on the corrosion rate. The signal-to-noise ratio and the means are calculated. The smaller the better rule is selected since the corrosion rate values of the joint should be smaller. The main effects plots for SN ratio and for the means are shown in Figs 9 and 10, respectively, for the bottom layer specimens.
Corrosion rate of top, middle and bottom layers

Main effects plot for SN ratio of corrosion rates of bottom layer.

Main effects plot for means of corrosion rates of bottom layer.

It can be observed from the main effects plot for SN ratio (Fig. 9), the SN ratio decreases as the tool rotation speed increases. At 700 RPM, the SN ratio is around −60.5. It drops further at 1000 RPM and even more at 1400 RPM, where it reaches approximately −62.5. Higher tool rotation speeds result in lower SN ratios, implying a better corrosion rate. The SN ratio slightly decreases as the welding speed increases from 20 mm/min to 50 mm/min. The SN ratio is around −61.5 at 20 mm/min and drops slightly to −61.7 at 50 mm/min. Increasing welding speed marginally decreases the SN ratio, implying better corrosion resistance. The SN ratio remains mostly stable between 10 and 12 kN, but shows a slight decrease at 14 kN. At 10 kN and 12 kN, the SN ratio hovers around −61.5, but at 14 kN, it drops to about −62.1. Increasing axial force seems to slightly improve the SN ratio beyond 12 kN. It can be observed that the higher values of tool rotation speed and axial force contribute to improved corrosion resistance, whereas the effect of welding speed is more subtle, with marginal improvements as speed increases.
It can be observed from the main effects plot for data means (Fig. 10), the mean value increases significantly with the rise in tool rotation speed. At 700 RPM, the mean is close to 1100. It rises to around 1250 at 1000 RPM and further increases to approximately 1350 at 1400 RPM. Higher tool rotation speeds lead to an increase in the mean, indicating that TRS has a strong effect on the mean value. The mean value shows a slight increase as the welding speed increases. At 20 mm/min, the mean is just below 1250, and it increases marginally as welding speed reaches 50 mm/min, nearing 1300. Welding speed has a minor effect on the mean, with slightly higher speeds leading to a small increase. The mean is relatively stable at 10 kN and 12 kN, staying around 1250. However, there is a noticeable increase at 14 kN, where the mean reaches close to 1300. Axial force slightly impacts the mean, with a more pronounced increase at the higher force level.
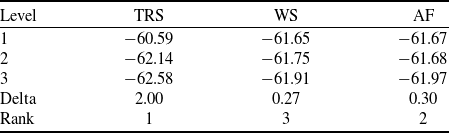
Table 4 shows the response table for S/N ratio for corrosion rate of bottom layer. Delta refers to the difference between the highest and lowest SN ratios for each factor, indicating the relative influence of each factor. Tool rotation speed has the highest Delta, showing it has the most significant impact on SN ratio. Tool rotation speed is the most influential factor in improving corrosion rate based on SN ratio.
Response table for signal-to-noise ratios for corrosion rate of bottom layer

It is observed from the response table that the tool rotation speed is the most influencing factor in controlling the corrosion rate, followed by the axial force and then the weld speed.
3.1 ANOVA for corrosion rate
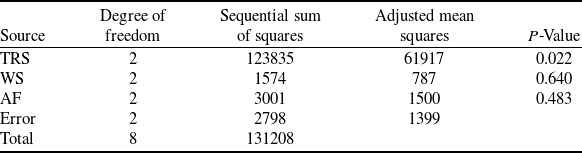
Analysis of variance for corrosion rate of bottom layers, using sequential sum of squares is shown in Table 5. The analysis is conducted at 95% confidence level.
ANOVA results for corrosion rate of bottom layers

R-Sq = 97.87% R-Sq(adj) = 91.47%.
The P-value of tool ration speed is 0.022, which is less than 0.05; hence the tool rotation speed has a statistically significant impact on the corrosion rate. Since the P-value of weld speed and axial force are greater than 0.05, these factors does not significantly affect the corrosion rate. R-squared (R-Sq) value is found to be 97.87%, means 97.87% of the variation in the response is explained by the model. This is a very high R-squared value, indicating the model fits the data well. In contrast D’Urso et al. [Reference D’Urso, Giardini, Lorenzi, Cabrini and Pastore4] have reported that the corrosion behaviour is affected by both tool rotation speed and weld speed.
3.2 Microstructural examination
SEM images of the corroded specimens are taken to observe the corrosion characteristics. It is observed from the Taguchi analysis that the weld speed and axial force are not significant in controlling the corrosion rate. The SEM images of three samples (S1, S4 and S7) are chosen such that the weld speed is kept constant at 20 mm/min and the three samples are selected to have three different tool rotation speeds and axial forces.
The SEM images of the corroded bottom layer of the specimen S1 are shown in Fig. 11. It could be observed from the image that the pitting corrosion has occurred in regions surrounding the second phase particles [Reference D’Urso, Giardini, Lorenzi, Cabrini and Pastore4]. Cracks have formed in the pit region in the particles. It can be correlated with the corrosion rate of 1.0202 × 10³ mil/yr for the bottom layer of the specimen S1, which is higher than the top and middle layers [Reference Sinhmar and Dwivedi22].
The SEM images of the corroded top layer of the specimen S4 is shown in Fig. 12. It is evident from the figure that there are pitting regions surrounding the precipitate particles formed during the corrosion testing [Reference Wadeson, Zhou, Thompson, Skeldon, Oosterkamp and Scamans24]. The corrosion rate of the sample is observed to be 0.7332 × 10³ mil/yr, which is the least value compared to the corrosion rate of the middle and bottom layers.
SEM images of welded sample (S1) after corrosion test.

SEM images of welded sample (S4) after corrosion test.

The SEM images of the corroded middle layer of the specimen S7 is shown in Fig. 13. It could be observed from the figure that there are pitting spots and the density of these spots is higher compared to those observed for the top layer of the specimen S4. The corrosion rate of the sample is observed to be 0.9016 × 10³ mil/yr, which is higher than the top layer but smaller than the bottom layer.
SEM images of welded sample (S7) after corrosion test.

4.0 Conclusion
The aluminum alloy AA2014-T6 is friction stir welded with three levels of process parameters and the welds are subjected to electrochemical tests and the corroded samples are subjected to SEM analysis. The electrochemical tests are conducted using the electrochemical workstation CHI660C. The corrosion test is carried out in a 3.5% NaCl solution with a three electrode electrochemical cell.
Tafel polarisation tests are conducted and the corrosion rates are determined for the top, middle and bottom layers of the welded specimen. It is observed from corrosion rate, that the top layers of the specimen are more passive compared to the bottom and middle layers, as the material in top region is subjected to extreme heat and plastic deformation, resulting in refined grain.
From the Taguchi analysis of the corrosion rate of the bottom layer specimens, it is observed that the SN ratio decreases as the tool rotation speed increases. From the main effects plot it observed that lower SN ratios are obtained with faster tool rotation speeds, suggesting a higher corrosion resistance. It is also evident from the main effects plot that the weld speed and axial force have very little effect on the corrosion rate. The very high delta value obtained from the response table for signal to noise ratio for the parameter tool rotation speed confirms the significance of it in controlling the corrosion rate.
It is noted from the ANOVA results for corrosion rate that the tool rotation speed is the most influencing factor in controlling the corrosion rate. It is observed from the SEM image of the corroded samples that the pitting corrosion has occurred in regions surrounding the second phase particles. Cracks have formed in the pit region in the particles.
Competing interests
The authors declare none.