Milk fat is an important component in milk, providing nutrients and energy for humans. In dairy cows, milk fat produced by the mammary gland is based on two mechanisms: absorption of fatty acids from the circulating blood (Cherepanov et al., Reference Cherepanov, Danfaer and Cant2000) and de novo synthesis via the fatty acid synthesis pathway in mammary epithelial cells (Lee and Ridgway, Reference Lee and Ridgway2020). This milk fat synthesis is strictly regulated by lactation-related hormones and cytokines (Akers, Reference Akers2017; Geiger, Reference Geiger2019). Leptin is a versatile peptide hormone, which is mainly synthesized by white adipose tissue (Zhang et al., Reference Zhang, Proenca, Maffei, Barone, Leopold and Friedman1994). It has also been reported to be expressed in heart (Purdham et al., Reference Purdham, Zou, Rajapurohitam and Karmazyn2004), skeletal muscle (Wolsk et al., Reference Wolsk, Mygind, Grøndahl, Pedersen and van Hall2012) and placenta (Masuzaki et al., Reference Masuzaki, Ogawa, Sagawa, Hosoda, Matsumoto, Mise, Nishimura, Yoshimasa, Tanaka, Mori and Nakao1997). Leptin biological activities are involved in the regulation of body mass (Yao et al., Reference Yao, Fan, Fan, Lu, Wang, Wang, Tang and Qi2020), energy intake (Saladin et al., Reference Saladin, De Vos, Guerre-Millo, Leturque, Girard, Staels and Auwerx1995), immunity (Chan et al., Reference Chan, Matarese, Shetty, Raciti, Kelesidis, Aufiero, De Rosa, Perna, Fontana and Mantzoros2006) and cardiovascular function (Kim et al., Reference Kim, Lee and Jeong2020), as well as some important metabolic pathways. Leptin plays its regulatory role by combining with its receptor to activate different signaling pathways in vivo (Li and Friedman, Reference Li and Friedman1999; Bates et al., Reference Bates, Dundon, Seifert, Carlson, Maratos-Flier and Myers2004; Uotani et al., Reference Uotani, Abe and Yamaguchi2006). There are six leptin receptor isoforms (OB-Ra to OB-Rf) that have sequence homology and functional similarities with class I cytokine receptors (Tartaglia et al., Reference Tartaglia, Dembski, Weng, Deng, Culpepper, Devos, Richards, Campfield, Clark, Deeds, Muir, Sanker, Moriarty, Moore, Smutko, Mays, Wool, Monroe and Tepper1995). The six leptin receptors exhibit identical extracellular and transmembrane domains but differ in their intracellular domain. Among them, the full-length isoform, OB-Rb, is considered to be the functional receptor, linking leptin signaling with different biological functions (Zabeau et al., Reference Zabeau, Defeau, Iserentant, Vandekerckhove, Peelman and Tavernier2005; Patterson et al., Reference Patterson, Villanueva, Greenwald-Yarnell, Rajala, Gonzalez, Saini, Jones and Myers2012; Fan et al., Reference Fan, Qin, Yuan, Fan, Huang and Lin2024). Leptin plays a central role in balancing energy in the process of nutrient distribution and energy metabolism during pregnancy and lactation (Liefers et al., Reference Liefers, Veerkamp, te Pas, Delavaud, Chilliard, Platje and van der Lende2005; Trujillo-Güiza and Señarís, Reference Trujillo-Güiza and Señarís2018). In addition to being expressed in adipocytes, leptin and its receptors are present in mammary tissues, even in milk (Parola et al., Reference Parola, Macchi, Fracchia, Sabbioni, Avanzi, Motta, Accornero and Baratta2007; Pereira et al., Reference Pereira, Cline, Glavas, Covey and Kieffer2021). Wang et al. (Reference Wang, Wang, Li, Zhu, Jiang, Zhang, Wang, Han, Zhong, Guo, Lu, Li and Yang2011) studied the mRNA expression of leptin in rat mammary gland at different physiological stages, suggesting that leptin has a regulatory role in mammary gland activation (Wang et al., Reference Wang, Wang, Li, Zhu, Jiang, Zhang, Wang, Han, Zhong, Guo, Lu, Li and Yang2011). In mouse and human, leptin can affect the development of mammary ducts during puberty and stimulate mammary epithelial cell proliferation (Thorn et al., Reference Thorn, Giesy, Myers and Boisclair2010; Esper et al., Reference Esper, Dame, McClintock, Holt, Dannenberg, Wicha and Brenner2015). Clempson et al. (Reference Clempson, Pollott, Brickell, Bourne, Munce and Wathes2011) found that single nucleotide polymorphisms (SNPs) in the leptin and OB-R genes affect growth, milk production and fertility in Holstein dairy cows. There was a positive correlation between OB-Rb and leptin expression during mammary gland development, and it appears that leptin can control mammary gland development and lactation by binding to OB-R specifically. However, relationships between leptin and milk fat synthesis in dairy cows through OB-Rb have not been reported, and that was our objective. We first evaluated the expression of leptin and its receptor OB-Rb in the mammary gland tissue of dairy cows at different stages. Then, we explored the effect of leptin on milk fat synthesis in bovine mammary epithelial cells. The differentially expressed genes between leptin-treated cells and control cells were identified through transcriptomic analysis, followed by GO and KEGG pathways enrichment. Finally, the effect of leptin on milk fat synthesis-related signaling pathways and gene expression were analyzed by western blot. This study provided a theoretical basis for improving the regulatory network of milk fat synthesis in lactating cows and an experimental basis for artificial regulation of milk fat synthesis.
Materials and methods
Animals and tissue collection
This study was approved by Northeast Agricultural University (Harbin, China) for all animal experiments. All animals were clinically healthy. Six Holstein dairy cows (in the third parity, calving at 52–54 months of age) with similar genetic backgrounds were used to obtain mammary tissues. Three lactating cows were slaughtered at 90 DIM. The other three cows were pregnant and dried off at 310 DIM and slaughtered at 30 d after dry off. After slaughtering the mammary parenchyma tissues were immediately removed from the mid-region of the mammary glands. Adipose and connective tissues were removed from tissue samples. Then, the mammary tissues were cut into small pieces and fixed for immunofluorescence study or stored at −80°C for RNA and protein extraction.
Cell culture and treatment
Mammary epithelial cells were isolated from lactating mammary tissues of dairy cows as described previously (Yang et al., Reference Yang, Lin, Duan, Lv, Xing, Li, Gao and Hou2017). Cells were cultured at 37°C in a humidified atmosphere containing 5% CO2 in Dulbecco's modified Eagle's medium/nutrient mixture F-12 (DMEM/F-12, 12400024, Gibco™, Life Technologies, Carlsbad, CA) supplemented with 10% fetal bovine serum (04-001-1ACS, Biological Industries, Israel), penicillin (100 U/ml), streptomycin (100 μg/ml) and galactopoietic hormones (5 μg/ml insulin, 1 μg/ml prolactin, and 1 μg/ml hydrocortisone; Sigma-Aldrich Inc, St. Louis, MO). About 80% confluent primary cells were digested with trypsin-EDTA (0.25%; 25200072, Gibco™) and passaged to obtain pure mammary epithelial cells. Identification of purified mammary epithelial cells was done by immunofluorescence detection of cytokeratin 18 (A1022, ABclonal, Wuhan, China) (Fig. S1). All experiments were conducted using cells within 10 passages. For leptin treatment, the cells were plated in six-well plates at 1 × 10⁶ cells/well and treated with different concentrations of leptin (0, 25, 50, 100, 200, 400 ng/ml) for 24 h. To examine the effect of AKT/mTOR signaling pathway on leptin-induced milk fat synthesis, ~80% confluent cells were incubated with 50 μM LY294002 (S1737, Beyotime, Beijing, China) or 100 nM Rapamycin (RAPA, S1842, Beyotime), vehicle [0.02% (vol/vol) dimethyl sulfoxide] for 24 h. To detect the effects of acetate (S2889, Sigma-Aldrich) and BHB (06367, Sigma-Aldrich) on leptin expression and milk fat synthesis, mammary epithelial cells were grown in six-well plates (2 × 10⁵ cells/well) to ~60% confluence. Cells were then changed to serum-free medium with 1% FA-free bovine serum albumin (BSA, A8806, Sigma-Aldrich) overnight and treated with 8 mM acetate and 1 mM BHB for 48 h. All experiments were performed in triplicate. The cells were harvested for western blot analysis and TAG content assays.
Immunofluorescence and BODIPY staining
The tissues or cells were fixed in 4% paraformaldehyde (PFA) for 30 min at room temperature and blocked with 3% BSA at 37°C for 1 h. Then, the samples were incubated with primary antibody of leptin (1:100 dilution, A1300, ABclonal, China) or OB-Rb (1:100 dilution, A19076, ABclonal, China) at 4°C overnight. The samples were washed three times with phosphate-buffered saline (PBS) and incubated with goat anti-rabbit IgG (H + L) secondary antibody, Alexa Fluor 647 (1:200 dilution) for 1 h at 37°C. After washing three times with PBST, nuclei were stained with 10 μg/ml 4′,6-diamidino-2-phenylindole (DAPI) for 10 min. After extensive washing, sections were mounted in 1,4-diazabicyclooctane triethylenediamine. Confocal microscopy (TCS SP8; Leica Microsystems GmbH, Wetzlar, Germany) was used to obtain the images. For BODIPY staining, mammary epithelial cells plated on coverslips were washed twice with PBS, then fixed in 4% PFA for 20 min at 37 ℃. After washes with PBS, the cells were stained with BODIPY 493/503 (1:1000 dilution; D3922, Invitrogen, Carlsbad, CA) for 20 min at 37 ℃. Nuclei were stained with 10 μg/ml DAPI for 10 min. Cells were washed three times with PBS and mounted in 1,4-diazabicyclooctane triethylenediamine. The images were obtained using confocal microscopy (TCS SP8; Leica Microsystems GmbH, Wetzlar, Germany).
RNA isolation and sequencing
Total RNA was isolated with TRIzol reagent (15596, Life Technologies) according to the manufacturer's instructions. All samples used in this study were quantified for concentration and quality by NanoDrop 2000c spectrophotometer (Life Technologies). A total amount of 5 μg RNA was used for the sample preparations. mRNA was isolated according to poly(A) selection methods, which was purified using Dynabeads™ Oligo(dT). The RNA was fragmented using TIANSeq RNA Frag (TIANGEN, Beijing, China) at 94°C for 10 min. SuperScript™ II cDNA synthesis kit (Invitrogen, United States) was used to reverse transcribe RNA to cDNA. PCR amplification and size selection were then performed. The mean insert size in the final cDNA library was 200–300 bp. All the libraries were sequenced on an Illumina NovaSeq 6000 platform (LC Bio Technology Co., Ltd. China).
Differential expression and functional enrichment analyses
The RNA sequencing data were analyzed by Majorbio (http://www.majorbio.com/) online platform. Fragments per kilobase of exon per million mapped reads (FPKM) were calculated to represent the expression level of each transcript, thereby eliminating the influences of different transcript lengths and sequencing differences. DESeq2 was used for differential expression analysis of leptin-treated groups and control groups, with the following settings: fold change (FC) >2 or<−2, and P < 0.05. P-values were corrected by the method of Benjamini and Hochberg. Gene Ontology (GO, http://geneontology.org/) and Kyoto Encyclopedia of Genes and Genomes (KEGG, http://www.kegg.jp/) were used to analyze the biological functions and reaction networks of DEGs, respectively.
Measurement of TAG content
The triacylglycerol levels were detected by a TAG assay kit (E1013, Applygen Technologies Inc., Beijing, China). The cells were washed with PBS before lysis and after adding the appropriate amount of lysate, were incubated at 70°C for 10 min. Cell lysates were collected, centrifuged at 2000 rpm for 5 min, and the supernatant could then be used for enzymatic determination. Data were normalized with protein concentrations assayed with a BCA protein assay kit (T9300A, TaKaRa, Dalian, China) and corrected for TAG content per mg protein concentration. Experiments were performed in triplicate.
Statistical analysis
The data are presented as the mean ± standard deviation (sd), and statistical analyses were performed with GraphPad Prism 6. Statistical significance of difference was determined using a two-tailed unpaired t-test when comparing two groups or a one-way ANOVA with post-Bonferroni's multiple comparisons when comparing more than three groups. Statistical significance was declared at P < 0.05.
Results
The expression of leptin and OB-Rb in mammary gland of dairy cow
To compare the tissue-specific expression of leptin and its receptor OB-Rb in mammary glands of lactating cows vs. dry period cows, we performed qRT-PCR. The results showed that the mRNA level of leptin and OB-Rb was significantly higher in mammary tissues of lactating cows than that in dry cows (Fig. 1A). Western blot analysis showed the similar results (P < 0.001; Fig. 1B, 1C). Immunofluorescence staining of sections of mammary tissues showed strong staining of leptin and OB-Rb in the acinar epithelial cells of lactating cows. In dry cows, the acinar structures shrank and collapsed, and the expression of leptin and OB-Rb was reduced (Fig. 1D, 1E).
The expression of leptin and its receptor in mammary tissues of dairy cows. (A) mRNA levels of leptin and OB-Rb were evaluated by qRT-PCR. (B and C) Representative western blot images and quantification of leptin and OB-Rb in dairy cow mammary tissues. Values are expressed as the mean ± sd (n = 3); **P < 0.01; ***P < 0.001. (D and E) Immunofluorescence analyzed leptin and OB-Rb expression in mammary tissues of dairy cows. Scale bar = 75 μm.

Effect of leptin and OB-Rb on milk fat synthesis in mammary epithelial cells of dairy cows
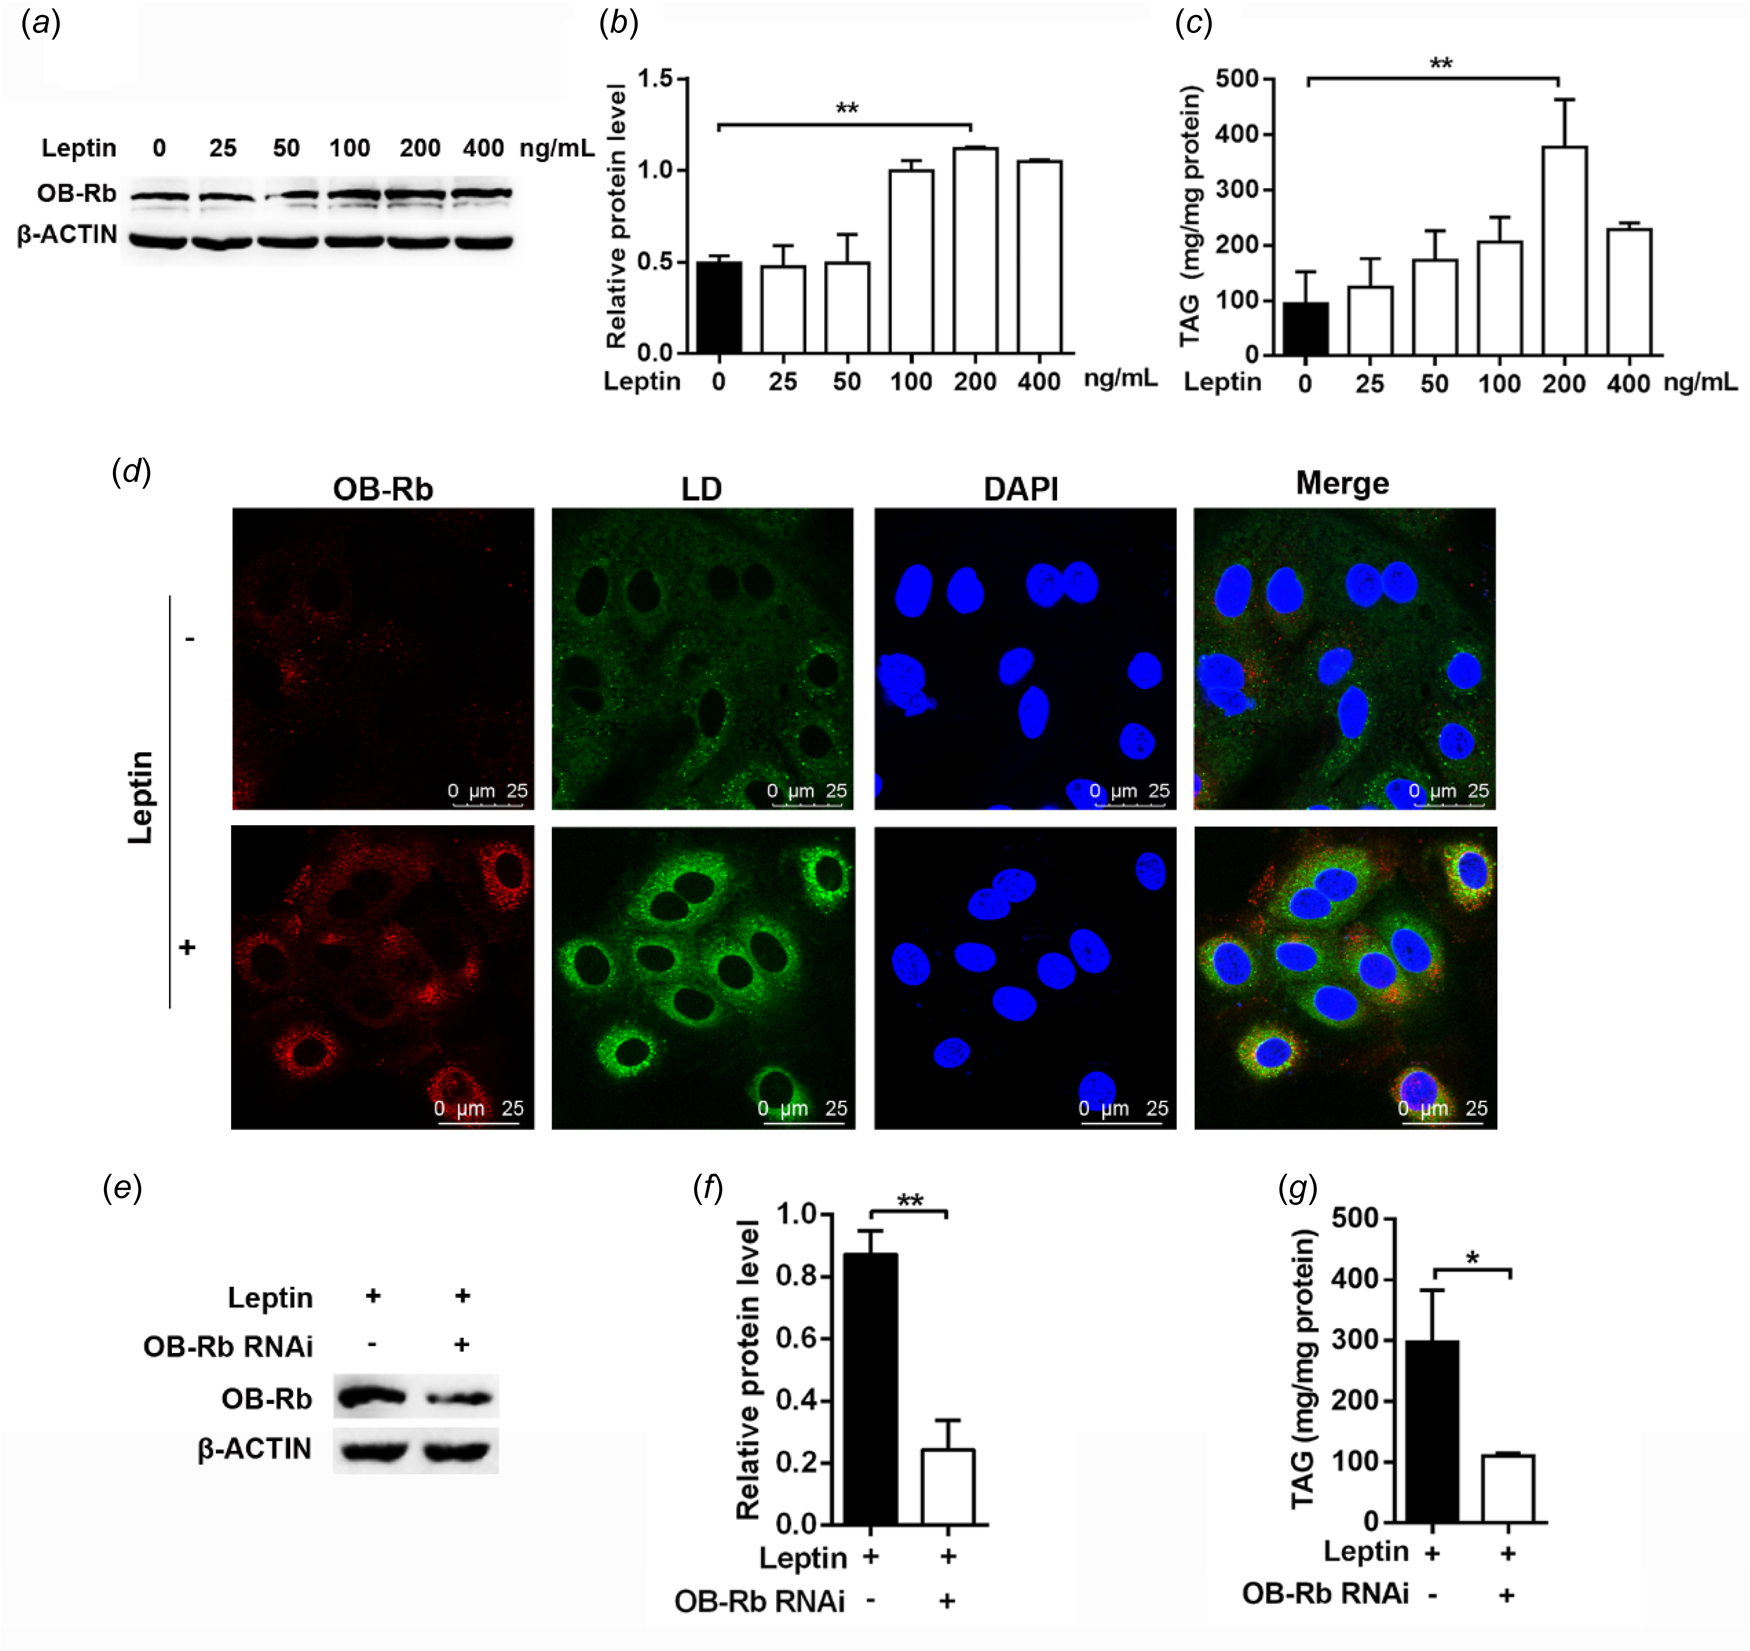
Mammary epithelial cells were treated with increasing concentrations of leptin (25, 50, 100, 200, 400 ng/ml) for 24 h, and the effect of leptin on OB-Rb expression was detected by western blot. There was no obvious cytotoxicity for cells treated with leptin for 24 h (online Supplementary Fig. S2). As shown in Fig. 2A and 2B, the expression of OB-Rb gradually increased and peaked at 200 ng/ml of leptin treatment (P < 0.01). Leptin treatment dose-dependently increased the intracellular content of TAG (Fig. 2C). Treatment of cells with 200 ng/ml of leptin increased intracellular TAG content by 75% (P < 0.01). However, the TAG content decreased when cells were treated with 400 ng/ml leptin. Immunofluorescence and BODIPY staining showed that compared with control, 200 ng/ml leptin led to a marked increase in the fluorescent intensity of OB-Rb and lipid droplets in mammary epithelial cells of dairy cows (P < 0.01, Fig. 2D). Therefore, 200 ng/ml leptin was used for the subsequent experiments.
Effect of leptin on mammary epithelial cell milk fat synthesis. (A) The bovine mammary epithelial cells (1 × 10⁶ cells/6 cm dish) were treated with leptin (0–400 ng/ml) for 24 h and protein levels were determined by western blot. (B) Quantification of OB-Rb expression from the western blot in panel A. (C) TAG content. (D) The cells were treated with leptin (200 ng/ml) for 24 h, OB-Rb and lipid droplets were visualized. Scale bar = 25 μm. (E and F) Representative western blot images and quantification of OB-Rb after OB-Rb interference in bovine mammary epithelial cells. (G) TAG content. Values are expressed as the mean ± sd (n = 3); *P < 0.05; **P < 0.01.

Next, we investigated whether the effect of leptin on TAG synthesis depends on OB-Rb expression. We designed siRNA sequences for OB-Rb gene (online Supplementary Table S1). The transfection efficiency of RNAi is shown in online Supplementary Fig. S3. Western blot showed that OB-Rb siRNA treatment resulted in a marked decrease in OB-Rb expression (P < 0.01, Fig. 2E, 2F). Meanwhile, OB-Rb knockdown decreased intracellular TAG by ~57% (P < 0.05, Fig. 2G).
Transcriptomic analysis of leptin-treated mammary epithelial cells of dairy cows
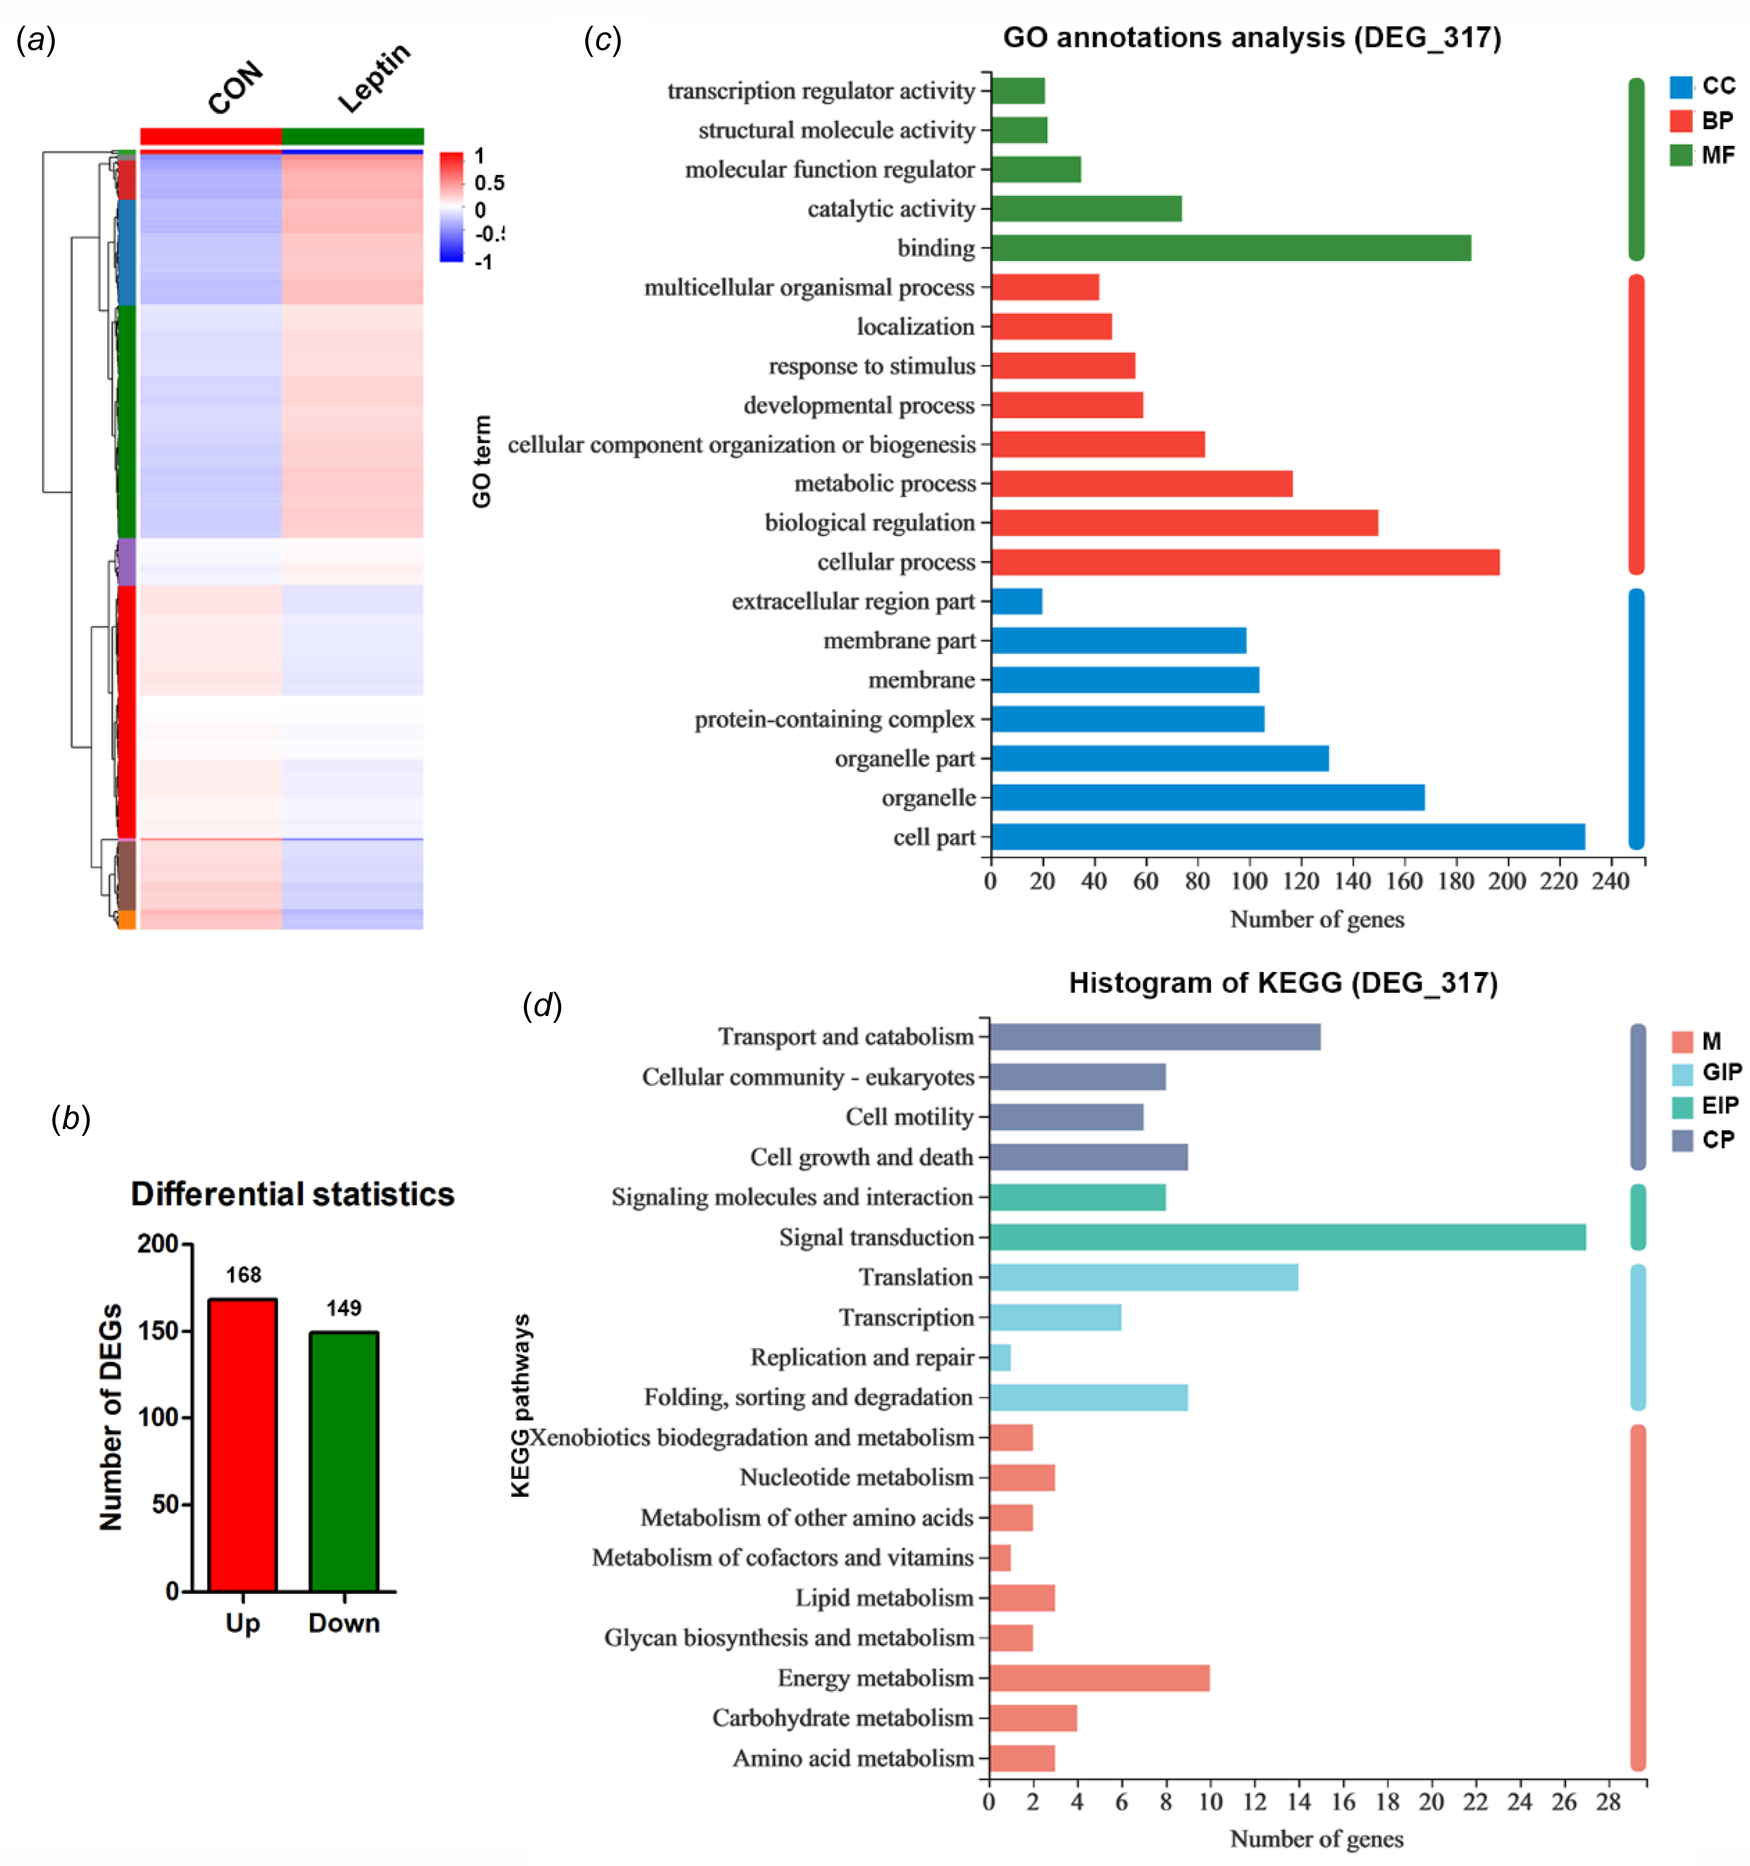
We investigated the transcriptome profile in leptin-treated mammary epithelial cells of dairy cows to determine gene expression changes. Using a cutoff of >0.01 FPKM to define potentially significant gene expression, we obtained 317 DEGs, including 168 up-regulated genes and 149 down-regulated genes (Fig. 3A, 3B and Table S3). We randomly selected 4 up-regulated genes and 4 down-regulated genes to verify the accuracy of RNA-seq by qRT-PCR. The results showed that the mRNA expression patterns of these genes in leptin-treated groups and control groups were consistent with the results of RNA-seq, and had a strong correlation (P < 0.0001, R 2 = 0.9461, online Supplementary Fig. S4). GO enrichment analysis was performed for the 317 DEGs identified by RNA-seq, and the DEGs were divided into three groups, namely the cellular components (CC), biological processes (BP) and molecular functions (MF). The top 20 GO terms are listed in Fig. 3C (P < 0.05). Among them, ‘cell part’ (GO:0044464) was mainly enriched in the functional cellular components. There were 20 GO terms described in ‘biological processes’, including ‘cellular process’ (GO:0009987), ‘biological regulation’ (GO:0065007) and ‘metabolic process’ (GO:0008152). The ‘molecular functions’ analysis showed that the DEGs affected by leptin were mainly involved in ‘binding’ (GO:0005488), ‘catalytic activity’ (GO:0003824) and ‘molecular function regulation’ (GO:0098772). The DEGs were then divided into four groups by KEGG pathway analysis, namely metabolism (M), genetic information processing (GIP), environmental information processing (EIP) and cellular processes (CP). The results showed that the DEGs were mainly assigned in the 19 pathways (P < 0.05, Fig. 3D). The ‘energy metabolism’ was mainly enriched in ‘metabolism’ terms. The ‘transport and catabolism’ was mainly enriched in ‘cellular processes’ terms. The ‘signal transduction’ and ‘translation’ were mainly enriched in ‘environmental information processing’ and ‘genetic information processing’ terms, respectively.
Transcriptomic analysis of DEGs in leptin-treated cells. (A) The heatmap of 317 DEGs alteration. (B) The gene number of up-regulation and down-regulation in leptin-treated mammary epithelia cells of dairy cows. (C) GO terms. (D) KEGG pathways. Enrichment of GO and pathways based on DEGs between leptin-treated groups and control groups.

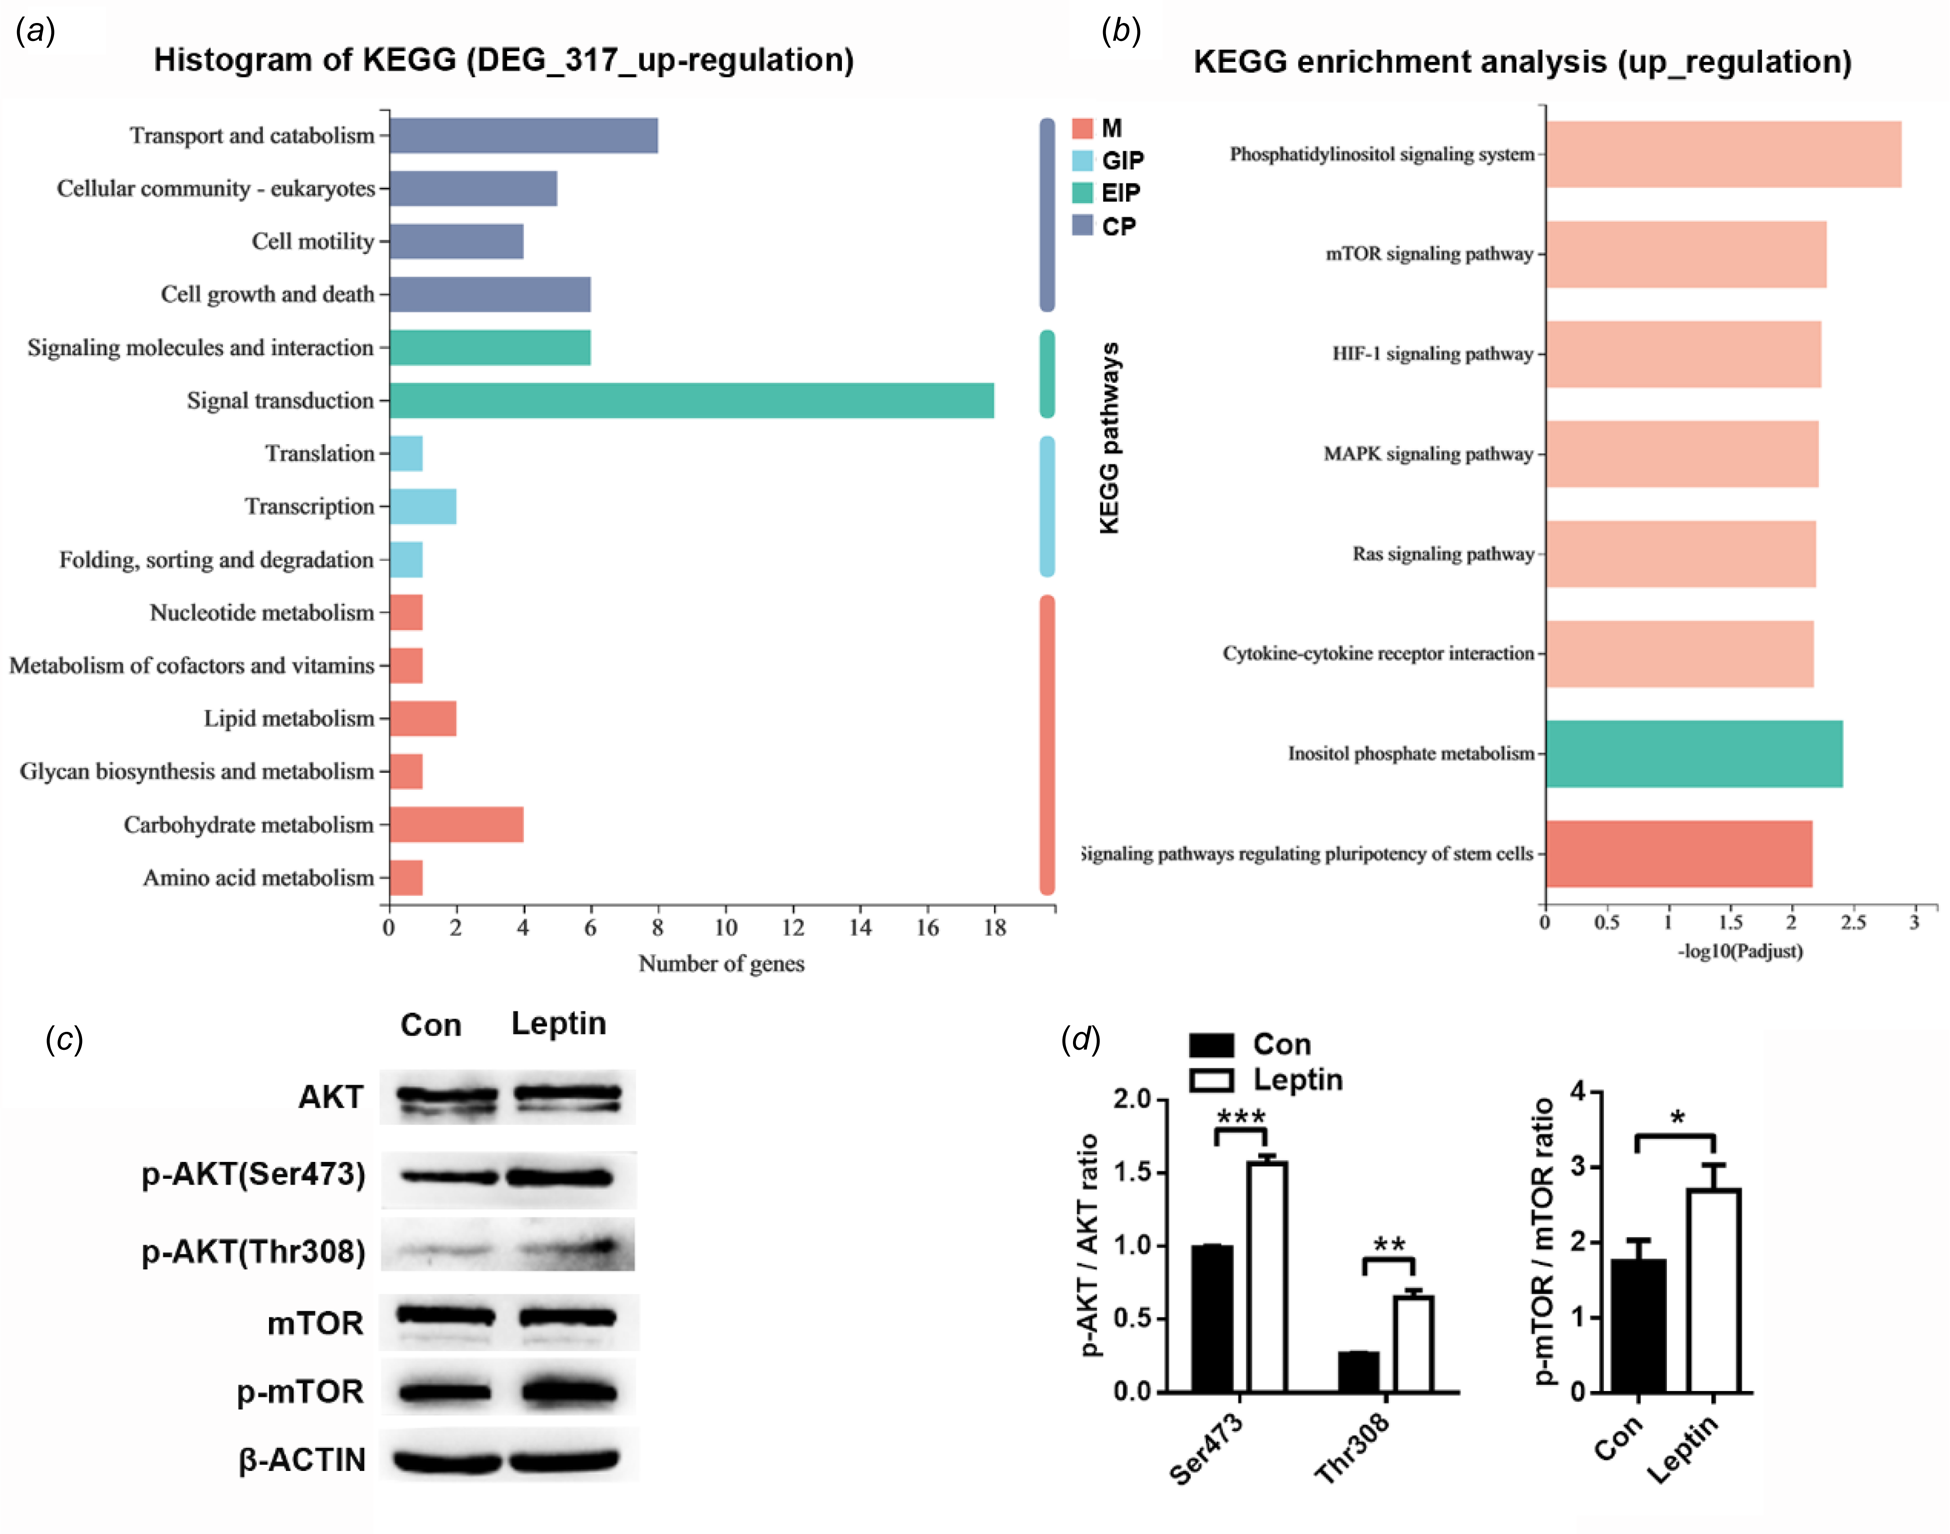
Among the KEGG terms involved in the up-regulated DEGs, 15 ‘second categories’ were listed, in which ‘signal transduction’ pathways were heavily enriched (P < 0.05, Fig. 4A). There were 8 pathways identified in ‘signal transduction’, including ‘phosphatidylinositol signaling system’, ‘MAPK signaling pathway’ and ‘mTOR signaling pathway’ (P < 0.05, Fig. 4B). The AKT/mTOR signaling pathway is involved in hormone- and cytokine-induced β-casein synthesis, lipid metabolism and other metabolic processes (Pauloin and Chanat, Reference Pauloin and Chanat2012; Che et al., Reference Che, Xu, Gao, Zhu, Wang, Yang, Wen, Xiao, Jiang and Wu2019). In dairy cow mammary epithelial cells, activation of PI3K-mTOR pathway can up-regulate cell proliferation, casein and milk fat synthesis (Wang et al., Reference Wang, Wang, Yang, Liu and Jiang2018). We then verified the expression of these signaling molecules in leptin-treated mammary epithelial cells by western blot. The results showed that the ratio of phosphorylated AKT (P < 0.01, Fig. 4C) and mTOR (P < 0.05, Fig. 4D) to total AKT and mTOR were significantly elevated after leptin treatment.
Signaling pathway analysis of leptin-induced milk fat synthesis. (A) KEGG pathways. Enrichment of pathways based on up-regulated DEGs between leptin-treated groups and control groups. (B) KEGG enrichment analysis of up-regulated DEGs in the category of ‘Signal transduction’. (C) Western blot analyses show the levels of AKT and mTOR signal molecules in leptin-treated mammary epithelial cells of dairy cows. (D) Quantification of protein levels from the western blots in panel C. Values are expressed as the mean ± sd (n = 3); *P < 0.05; **P < 0.01; ***P < 0.001.

Leptin-OB-Rb induces milk fat synthesis via activating PI3K/AKT/mTOR signaling
Mammary epithelial cells were treated with 200 ng/ml leptin for 24 h. The expression of OB-Rb significantly increased in leptin-treated group (P < 0.001). Meanwhile, the protein level of sterol regulatory element binding transcription factor 1 (SREBP1, P < 0.001), acetyl-CoA carboxylase (ACC, P < 0.05), fatty acid synthase (FASN, P < 0.01), and diacylglycerol acyltransferase 1 (DGAT1, P < 0.001) also markedly increased in leptin-treated group as compared with control group (Fig. 5A, 5B). However, the expression of p-ACC did not change. Next, we treated mammary epithelial cells with OB-Rb siRNA in the presence of 200 ng/ml leptin. Western blot showed that the expression of p-AKT (P < 0.05) and its downstream molecule, p-mTOR (P < 0.05), significantly decreased in OB-Rb siRNA treated cells as compared with control cells (Fig. 5C, 5D). Meanwhile, the protein level of SREBP1, ACC, FASN, and DGAT1 reduced by 75%, 25%, 80%, and 60%, respectively (Fig. 5E, 5F).
Leptin regulated milk fat synthesis in dairy cow mammary epithelial cells by AKT/mTOR signaling pathway. (A) Western blot analyses show the levels of key proteins involved in milk fat synthesis in 200 ng/ml leptin-treated bovine mammary epithelial cells. (B) Quantification of protein levels from the western blot in panel A. (C) Western blot analyses show the levels of AKT and mTOR signal molecules in OB-Rb-knockdown bovine mammary epithelial cells. (D) Quantification of protein levels from the western blots in panel C. (E) Western blot analyses show the levels of key proteins involved in milk fat synthesis in OB-Rb-knockdown bovine mammary epithelial cells. (F) Quantification of protein levels from the western blots in panel E. Values are expressed as the mean ± sd (n = 3); *P < 0.05; **P < 0.01; ***P < 0.001.

When we treated mammary epithelial cells with PI3K inhibitor LY294002 or mTOR inhibitor RAPA, the ratio of phosphorylated AKT and mTOR to total AKT and mTOR were significantly decreased (P < 0.001) and the expression of SREBP1 reduced by 90 and 65% respectively. Moreover, LY294002 or RAPA treatment significantly decreased leptin-induced TAG synthesis (P < 0.01, Fig. 6A–6F). Then we treated mammary epithelial cells with SREBP1 siRNA. Western blot showed that the expression of ACC (P < 0.001), FASN (P < 0.001), and DGAT1 (P < 0.01) significantly decreased in SREBP1 siRNA treated cells as compared with control cells. However, leptin treatment partially reversed the inhibition of SREBP1 siRNA on genes related to milk fat synthesis (Fig. 6G, 6H). TAG content was also recovered (P < 0.05, Fig. 6I).
Leptin activate SREBP1 to induce milk fat synthesis via AKT/mTOR signaling pathway. (A and B) Representative western blot images and quantification of AKT, pAKT and SREBP1 in bovine mammary epithelial cells treated with or without 50 μM LY294002 for 24 h. (C) TAG content. (D and E) Representative western blot images and quantification of mTOR, p-mTOR and SREBP1 in bovine mammary epithelial cells treated with or without 100 nM RAPA for 24 h. (F) TAG content. (G and H) Representative western blot images and quantification of key proteins involved in milk fat synthesis after adding leptin to SREBP1-deficient cells. (I) Effect of leptin on TAG content in SREBP1-deficient cells. Values are expressed as the mean ± sd (n = 3); *P < 0.05; **P < 0.01; ***P < 0.001.

Short-chain fatty acids (SCFA) induce TAG synthesis via Leptin/OB-Rb signaling
Mammary epithelial cells were treated with 8 mM acetate and 1 mM BHB for 48 h. Western blot showed that acetate and BHB treatment led to a significant increase in leptin (~4-fold) and OB-Rb (~30%) expression (Fig. 7A, 7B). The intracellular TAG content also increased by 50% (Fig. 7C). Then we designed the siRNA sequences of leptin gene to knockdown leptin expression in mammary epithelial cells of dairy cows (online Supplementary Table S1, Fig. S5). Western blot showed that in the presence of acetate and BHB, leptin knockdown resulted in a significant decrease in leptin (~8-fold) and OB-Rb (~50%) expression (Fig. 7D, 7E). Meanwhile, the intracellular TAG decreased by ~30% (Fig. 7F).
Short-chain FA induce leptin expression and milk fat synthesis in mammary epithelial cells of dairy cows. (A) The bovine mammary epithelial cells (2 × 10⁵ cells/6 cm dish) were treated with 8 mM aetate and 1 mM BHB for 48 h and protein levels were determined by western blot. (B) Quantification of leptin and OB-Rb expression from the western blot in panel A. (C) TAG content. (D and E) Representative western blot images and quantification of leptin and OB-Rb after leptin interference in bovine mammary epithelial cells. (F) TAG content. Values are expressed as the mean ± sd (n = 3); *P < 0.05; **P < 0.01.

Discussion
Leptin is a protein hormone which has been reported to be produced in mammary tissues (Smith and Sheffield, Reference Smith and Sheffield2002). We demonstrated that leptin and its receptor OB-Rb are highly expressed in lactating mammary tissues of dairy cows and function on milk fat production. Leptin-OB-Rb signal could activate PI3K/AKT/mTOR pathway and regulate the expression of lipogenesis genes through SREBP1, thereby promoting milk fat synthesis.
Leptin in the systemic circulation of ruminants is mainly produced and secreted by adipose tissue and plays a central role in the regulation and coordination of energy homeostasis (Ehrhardt et al., Reference Ehrhardt, Slepetis, Siegal-Willott, Van Amburgh, Bell and Boisclair2000). During the perinatal period, high yielding dairy cows experience major changes in energy metabolism (Bell, Reference Bell1995; Barber et al., Reference Barber, Clegg, Travers and Vernon1997). With the onset of lactation, the increased metabolic activities of the mammary gland increase the total energy requirements. The energy deficit of periparturient cows causes a sustained reduction in plasma leptin. Study on the dynamics of plasma leptin of dairy cows showed that the plasma concentration of leptin was reduced by ~50% after parturition and remained depressed during lactation (Leury et al., Reference Leury, Baumgard, Block, Segoale, Ehrhardt, Rhoads, Bauman, Bell and Boisclair2003). Decreased concentration of plasma leptin occurs concomitantly with changes in neuroendocrine signals that promote fasting metabolism and the attenuation of dispensable, energy-dependent functions such as reproduction and immune response (Flier, Reference Flier1998; Grover et al., Reference Grover, Quaye, Brychta, Christensen, Startzell, Meehan, Valencia, Marshall, Chen and Brown2021). This benefits early lactation cows by promoting a faster increase in feed intake and by diverting energy from non-vital functions (Block et al., Reference Block, Butler, Ehrhardt, Bell, Van Amburgh and Boisclair2001). Study in dairy cow mammary tissues showed that leptin is also expressed by mammary glands and its expression is regulated during the pregnancy–lactation cycle. In 2003, Sayed-Ahmed et al. reported that the epithelial leptin mRNA expression of the lactating mammary gland was higher than that of the dry gland, but there was no difference in leptin mRNA expression for the whole mammary tissue between dry quiescent and lactating mammary tissues of the non-pregnant cows (Sayed-Ahmed et al., Reference Sayed-Ahmed, Kulcsár, Rudas and Bartha2004). Our data showed that the mRNA and protein levels of leptin and its receptor OB-Rb were markedly higher in mammary tissues of lactating cows than those in dry cows. Our findings are inconsistent with the report by Sayed-Ahmed et al. in dry cows, which could be due to the different physiological status of the animals. The dry cows in the present study were pregnant, but non-pregnant in Sayed-Ahmed's assay. The cellular location of leptin and OB-Rb protein in these two studies both indicated that mammary leptin and OB-Rb expression were mainly in epithelial cells, suggesting some possible regulation and maintenance of mammary epithelial cell activity. Our study with immunofluorescence staining sections of dry cows also showed that leptin could be produced by mammary adipocytes, suggesting that leptin may act as a paracrine factor on mammary epithelial cell turnover via adipose–epithelial cellular interaction. In addition, studies in human (Smith-Kirwin et al., Reference Smith-Kirwin, O'Connor, De Johnston, Lancey, Hassink and Funanage1998), mouse (Aoki et al., Reference Aoki, Kawamura and Matsuda1999) and bovine (Liefers et al., Reference Liefers, Veerkamp, te Pas, Delavaud, Chilliard and van der Lende2003) has reported that leptin is also detected in milk. Milk is believed to be a major source of leptin for offspring early in life, with the endogenous leptin-synthesizing mechanisms being still immature (Kugananthan et al., Reference Kugananthan, Lai, Gridneva, Mark, Geddes and Kakulas2016). A study in dairy cows indicated that leptin plasma levels decreased by about 18% over the transition from colostrum to mature milk, however, the leptin level was always higher in milk than plasma, and the concentration of leptin in colostrum was higher than the highest level in milk, suggesting that blood-derived leptin combines with locally synthesized leptin by the mammary epithelial cells to yield the total leptin content of milk (Pinotti and Rosi, Reference Pinotti and Rosi2006).
It has been reported that in normal mammary epithelial cell line, the biological activity of leptin depends on its receptors, which activates its downstream signaling molecules to regulate specific gene expression (Hu et al., Reference Hu, Juneja, Maihle and Cleary2002). Therefore, the increase in the number of leptin receptors could increase the mammary gland's responsiveness to leptin. We observed a high expression of OB-Rb in mammary tissues of lactating cows, suggesting that mammary- and serum-derived leptins were both related to milk production. Using cultured mammary epithelial cells of dairy cows, we found 200 ng/ml leptin significantly induced intracellular TAG content. However, leptin-induced TAG synthesis decreased when OB-Rb was knocked down. These data demonstrated that leptin-OB-Rb signal participates in the regulation of milk fat production. In the dose-dependent experiment, we observed a marked decrease in TAG content when leptin concentration reached 400 ng/ml. A possible reason could be that high concentration of leptin led to cell dysfunction and disease (Lamas et al., Reference Lamas, Goncalves-Mendes, Nachat-Kappes, Rossary, Caldefie-Chezet, Vasson and Farges2013).
Our KEGG analysis of DEGs showed that ‘signal transduction’ genes were heavily enriched in leptin-treated dairy cow mammary epithelial cells. The up-regulated DEGs were enriched in phosphatidylinositol signaling system, mTOR signal pathway, MAPK signal pathway and other. Several studies have reported that the PI3K pathway is required for the acute effects of leptin, such as a leptin-induced decrease in food intake (Boyle et al., Reference Boyle, Kola, Oraegbuna and Lei2024). PI3K/AKT/mTOR signaling pathway participates in diverse physiological functions such as proliferation, protein and lipid synthesis (Hu et al., Reference Hu, Chen, Deng, Chang, Luo, Dong, Lu, Zhang, Chen and Zhou2022). Our study in dairy cow mammary epithelial cells showed that leptin treatment increased the phosphorylation of PI3K downstream signal molecules AKT and mTOR significantly. Meanwhile, the expression of genes related to milk fat synthesis, including SREBP1, ACC, FASN and DGAT1, were markedly increased in cells upon leptin stimulation. OB-Rb knockdown, PI3K inhibitor or mTOR inhibitor all decreased leptin-induced activation of PI3K/ATK/mTOR signaling, as well as the expression of milk fat synthesis related genes. These results suggested that leptin signaling positively regulated milk fat synthesis in mammary epithelial cells of dairy cows via PI3K/AKT/mTOR, which is in agreement with our KEGG analysis that DEGs were enriched in ‘lipid metabolism’.
A regulatory network model with mTOR acting as a central hub has been proposed, including interactions between milk fat, protein and lactose regulation-related proteins to control milk synthesis (Osorio et al., Reference Osorio, Lohakare and Bionaz2016). SREBP1, an important nuclear transcription factor, is located downstream of mTOR and is involved in the regulation of cholesterol and fatty acid synthesis and metabolism. In dairy goats, de novo FA synthesis in mammary epithelial cells has been reported to be regulated through the mTOR/SREBP1 axis (Zhang et al., Reference Zhang, Huang, Yi, Zhang, Loor, Cao, Shi and Luo2018). Here, we observed that leptin positively promoted SREBP1 expression in mammary epithelial cells of dairy cows, whereas the expression of SREBP1 decreased after the addition of PI3K and mTOR inhibitors. These results indicated that leptin regulates the expression of lipogenesis genes through AKT/mTOR/SREBP1 in dairy cow mammary gland, thereby promoting milk fat synthesis.
The main precursors of de novo FA synthesis in ruminant mammary gland are acetate and BHB, which come from rumen microbial fermentation (Jacobs et al., Reference Jacobs, Dijkstra, Liesman, Vandehaar, Lock, van Vuuren, Hendriks and van Baal2013). FAs with different chain lengths and saturability could alter primary bovine mammary epithelial cell morphology and influence protein profiles involved in milk fat synthesis pathways (Yan et al., Reference Yan, Tang, Zhou, Han and Tan2019). Sun et al. studied the effect of different proportions of FAs on milk fat production. The results showed that the milk fat percentage and total short- and medium-chain fatty acids (SMCFA) concentration in milk fat tended to increase linearly with increasing ratios of SMCFA in the supplements (Sun et al., Reference Sun, Bu, Wang, Cui, Zhao, Xu, Sun and Zhou2013). In the present study, we observed that the addition of acetate and BHB could increase leptin and OB-Rb expression in mammary epithelial cells of dairy cows. When leptin was knocked down, acetate and BHB-induced OB-Rb expression and TAG synthesis did not occur. A previous study in buffalo has reported that leptin promoted angiogenesis and steroidogenesis through autocrine and paracrine effects (Kumar et al., Reference Kumar, Panda, Hyder, Yadav, Sastry, Sharma, Mahapatra, Bag, Bhure, Das, Mitra and Sarkar2012). Our results suggested that leptin could be synthesized in mammary epithelial cells upon short-chain FA stimulation, where leptin regulated milk fat synthesis via OB-Rb by autocrine and paracrine pathways.
In conclusion, we showed that the expression of leptin and OB-Rb were significantly higher in the mammary tissues of lactating cows as compared with dry cows, suggesting that they are related to milk component synthesis. In cultured mammary epithelial cells, leptin treatment significantly increased OB-Rb expression and intracellular triacylglycerol content. Transcriptome analysis identified differences in gene expression between leptin-treated cells and control cells, and gene ontology and pathway mapping showed that lipid metabolism-related gene expression increased and signal transduction pathway-related genes were the most significantly enriched. Mechanistic studies showed that leptin stimulation enhanced sterol regulatory element-binding protein 1 expression via activating the phosphatidylinositol 3-kinase/protein kinase B/mammalian target of rapamycin (PI3K/AKT/mTOR) signaling pathway, which in turn up-regulated the expression of genes related to milk fat synthesis. Moreover, we found that fatty acid synthesis precursors, acetate and β-hydroxybutyrate, could positively regulate the expression of leptin and OB-Rb in bovine mammary epithelial cells, thereby potentially increasing milk fat synthesis.
Supplementary material
The supplementary material for this article can be found at https://doi.org/10.1017/S002202992500010X
Acknowledgments
This work was supported by the National Natural Science Foundation of China (31671285 to Xiaoming Hou and 32402707 to Yang Yang), Postdoctoral fund of the Northeast Agricultural University (88657500 to Yang Yang) and the project supported by the Natural Science Foundation of Heilongjiang Province (China, LH2024C014 to Yang Yang).