


Introduction
The production of key metals, such as silver and lead, has long been studied by historians of the European Middle Ages (c. AD 400–1500) but textual sources on the origins of these industries are partial and fragmented, providing only hints as to when specialist production may have begun. Over the past two decades, high-resolution palaeoenvironmental studies from lake-, peat- and ice-cores have identified when lead aerosol pollution began to contaminate the environment of northern, western and Mediterranean Europe yet most of these environmental records are derived from areas far from medieval lead- and silver-producing centres (Loveluck et al. Reference Loveluck2020). Studies of the impact of pollution in the regions that housed the largest of these medieval metal industries are extremely rare (e.g. Kempter & Frenzel Reference Kempter and Frenzel2000), and analyses of the impact of lead pollution on the communities that mined and smelted the metal are all but absent.
Lead (Pb) is a toxic metal that can affect the nervous, renal and reproductive systems when ingested (Farmer et al. Reference Farmer2024). Those working with lead during the medieval period would have been exposed to harm at different stages of the mining and smelting processes; for example, through inhalation/ingestion of gases or dust. Once in the body, lead is preferentially deposited in the hard tissues—bone, dentine and enamel. Thus, analysis of lead concentrations (in parts per million (ppm)) in tooth enamel may provide a means to differentiate between individuals who were actively involved with lead mining and processing and those exposed to background levels of pollution from the broader landscape.
This article presents the first analysis of levels of lead contamination among communities living in one of western Europe’s largest lead-producing regions during the Middle Ages: the Derbyshire Peak District, at the southernmost extent of the Pennine hills in central England. It provides the first absolute dates for post-Roman lead production in the region, from the mid-seventh century; with large-scale production contaminating the local environment around certain centres, such as Castleton, by the mid-eighth century (Figure 1). The results further shed light on the age and gender dynamics of seventh- to fifteenth-century lead production, reflecting childhood exposure (between the ages of four and 12 years) and suggesting an association between high lead burden and premature death, especially among women. Comparison with Neolithic to Industrial Revolution populations provides a benchmark of expected lead levels among silver-lead-producer communities in medieval Europe and other periods.
Locations of places discussed in the text: a) Britain and north-west Europe; b) detail of places in the English East Midlands (figure by A. Bloxam & C.P. Loveluck).

Peak District lead production to AD 1500
Despite evidence for copper mining at Ecton Hill in the Peak District from c. 1880–1640 BC (Timberlake Reference Timberlake2017: 714), the first evidence for intentional lead extraction, indicated by a lead casting-model for a socketed axe from Mam Tor (Guilbert Reference Guilbert1996) and a lead object from Gardom’s Edge (Barnatt & Smith Reference Barnatt and Smith2004: 49), dates from a millennium later. Following Roman annexation of the Peak, lead ingots indicate that large-scale production ensued at c. AD 80–200 (Branigan Reference Branigan, Hodges and Smith1991: 60), under a franchise known as the sociorum Lutud(arensium) (Dool & Hughes Reference Dool and Hughes1976: 16). Lead production continued among rural communities through the third and fourth centuries, reflected at Carsington, Bradwell, Rainster Rocks and Chee Tor (Branigan Reference Branigan, Hodges and Smith1991: 60). Southern Pennines lead, probably from the Peak District, was still arriving in middle Rhine centres such as Cologne and Trier in AD 300–400, formed into coffins and other artefacts (Durali-Mueller et al. Reference Durali-Mueller2007: 1566), after which it has been assumed that production largely collapsed, serving only sporadic local needs.
The sudden wealth of mid-seventh-century cemeteries in the Peak District might reflect renewed lead production to resource Christian church building (Loveluck Reference Loveluck, Bintliff and Hamerow1995: 90; Figure 2). Smelting of fresh metal has previously been dated only to sometime between c. AD 760 and 860, based on lead isotope analysis of weights from Birka, Sweden (Ambrosiani Reference Ambrosiani2013; Kershaw & Merkel Reference Kershaw and Merkel2023: 275). However, a charter summary attributed to AD 835 also records a nobleman, Humberht, paying rent for an estate in Wirksworth (Low/White Peak; see Figure 1b) to the monastery at Repton (Derbyshire) in the medium of lead. He was obliged to organise transport of the lead to Canterbury, presumably via the River Humber and the North Sea coast (Kelly & Brooks Reference Kelly and Brooks2013: 636–38). This route is mirrored in lead objects and working debris found at eighth-to-ninth-century settlements from Flixborough, Beverley, Riby and Fishtoft (Loveluck Reference Loveluck2007: 102–103; Taylor Reference Taylor and Cope-Faulkner2012: 70–72; Figure 1). Pewter fittings on the Gokstad ship, Norway (Figure 1a), alloyed using metal from the Peak District/Pennines and Melle (Deux-Sèvres), France, also suggest continued production or recycling of lead from the Peak District into the tenth century (Pedersen et al. Reference Pedersen2016: 158–59). Radiocarbon dating of the individuals included in our study provides the first absolute dates for lead production in these centuries through in-vivo contamination concentrations in the region.
Wigber Low cemetery, c. AD 625–685: a) & b) plan and photograph of burial 4 (WIG 03) with sword (copyright University of Sheffield; plan redrawn from Collis Reference Collis1983 by A. Bloxam); c) crystal ball amulet (diameter 36mm), burial 9 (WIG 06); d) gold and beaver-tooth pendant (length 37mm) found close to burial 9 (copyright Sheffield Museums Trust).

By the mid-eleventh century, the Domesday survey (Db) (undertaken to record the use and taxable value of land across Norman England) suggests that large-scale lead production occurred in the Peak District during the reign of Edward the Confessor (1042–1066). Mines/smelting centres (plu(m)baria) were recorded at royal manors in the Low Peak, at Matlock (one mine), Wirksworth (three mines), Bakewell (one mine) and Ashford (one mine) (Db (Domesday Book), F. (Folio) 272b–d; Morgan Reference Morgan1978). The manors of Ashford, Bakewell and Hope each owed annually five ‘cart-loads’ of lead (with one cart-load equalling approximately 2100lbs) in Geld-tax in 1066, with 50 sheets of lead per cart-load (Db, F. 272d-273a; Morgan Reference Morgan1978). In 1086, the manors of Darley, Matlock, Wirksworth, Ashbourne and Parwich owed annually 40 pounds in ‘pure silver’ (argenti puri) in Geld, the only use of this specific term in Domesday Book (Db, F. 272c; Morgan Reference Morgan1978), possibly reflecting some extraction of the small amounts of silver in galena-lead ore. These silver payments were made at the start of the European ‘silver shortage’ of c. 1050–1150 (Spufford Reference Spufford1988: 95–99). However, use of British silver is difficult to identify in a recent, small-scale lead-isotope analysis of twelfth-century British coinage (Savage et al. Reference Savage2024).
A castle was constructed by William Peverel (Peveril Castle) in the High Peak before 1086, at the berewick (linked secondary settlement) of the royal estate centre at Hope, called Pechesers, likely named after a lead mine adjacent to the castle (Db, F. 276b; Morgan Reference Morgan1978; Figure 1b). The settlement around the mine and castle later became known as Castleton and was the administrative centre and key focus of lead mining in the medieval High Peak region (Loveluck et al. Reference Loveluck2020: OSM 5: 39). Excavations from 2009–2026 (currently unpublished) led jointly by the University of Sheffield and Castleton Historical Society have uncovered unfurnished graves within Castleton at two locations: Joule Yard, dating between the seventh and eleventh centuries AD; and Spital Field, on the eastern outskirts of the village associated with a medieval hospital building, dating from the twelfth–late fifteenth centuries AD (Figure 3). Individuals from these Castleton cemeteries provide the principal Peak District population sample in this study.
The Castleton cemeteries: a) Joule Yard; b) Spital Field (figure by C. Merrony & A. Darlington).

The date range of the cemetery populations also covers a period when more comprehensive documentary evidence for the scale of Peak District lead production is available. For example, the Pipe Rolls (recording taxation owed and paid to the royal Treasury) show that Peak District lead production reached its medieval zenith from c. 1180–1215 (Loveluck et al. Reference Loveluck2020: 476, OSM5: 37–52). A decline in production followed, with renewed cycles of ‘boom and bust’ from the late thirteenth–fifteenth centuries (Blanchard Reference Blanchard2005: 1400). An ice-core drilled from the north-west-facing slope at Colle Gnifetti (Swiss-Italian Alps) reveals lead-pollution trends identical to Peak District production cycles, with high points from c. 1180–1215 and decline in the mid-thirteenth century (More et al. Reference More2017: 213; Loveluck et al. Reference Loveluck2020: 476). Here, we investigate levels of lead pollution within a Peak District population against these historical production and environmental pollution records.
Methodological approach
This study has the following objectives:
-
1) to provide radiocarbon dates for the establishment and changing scales of lead production in the medieval Peak District;
-
2) to use lead contaminant concentrations in the teeth of a regional population sample to establish involvement in lead production by comparison with period-based societal norms;
-
3) to assess any evidence of population movement into the region, possibly linked to mining;
-
4) to analyse evidence for differentiation by social rank, role, gender and age from lead pollution levels among the population sample; and
-
5) to begin to evaluate the impact of lead pollution on human health and the environment in this period.
The population sample
The early- to late-medieval population sample analysed here focuses primarily on Castleton (53°20′35.52″N, 1°46′31.08″W). Initial radiocarbon dating of unfurnished inhumation graves at Joule Yard showed that people had been buried in this location, presumably associated with a settlement, since the seventh–eighth centuries AD; when it may already have been linked to the estate centre at Hope. Graves associated with the medieval hospital in Spital Field provide radiocarbon determinations that post-date the Norman Conquest (AD 1066), when Castleton became the administrative centre of the High Peak. To identify whether any of the individuals had been exposed to lead production during childhood, a sample of 10 individuals was selected on the basis of tooth-enamel preservation, with five each coming from the Joule Yard and Spital Field cemeteries. All sampled individuals were radiocarbon dated (Figure 4). The individuals from Joule Yard have date ranges that cluster from the early seventh–early eleventh centuries, while those from Spital Field cluster from the mid-eleventh–early sixteenth centuries. The teeth of two later Iron Age (c. 400 BC–AD 43) individuals from the nearby site of Eldon Hole were also sampled to provide a pre-large-scale mining comparison for lead levels (online supplementary material (OSM) 1). No sufficiently preserved teeth from the Romano–British period (c. AD 43–400) were available for analysis due to the tradition of disarticulated burial, often in caves (Brownlee & Klevnäs Reference Brownlee and Klevnäs2024: 1617).
Radiocarbon dates from the population sample (figure by A. Bloxam).

To obtain regional comparative data, we also selected teeth from five inhumation graves at Wigber Low (Figure 1b). Four graves, found in 1975–76 (Chesterman Reference Chesterman and Collis1983; Collis Reference Collis1983), were dated through artefact seriations of ‘Anglo-Saxon’ grave-goods, linked to over 100 radiocarbon dates: two females from phase ASF-E, AD 625–685 and two males from phases ASM-D to F, AD 565–685 (Bayliss et al. Reference Bayliss2013: 485). One of the males (Burial 4 south, sample WIG 03, Figure 2a) was buried with a mid-late sixth-century sword, probably an heirloom, when interred in the seventh century (Ager Reference Ager and Collis1983: 77). A new radiocarbon date obtained from burial 9 (WIG-06), a female buried with a crystal ball amulet, iron-bound wooden box and knife (Figure 2b; Foster & Collis Reference Foster and Collis1988: 235–37), produced a date of AD 610–665 (Figure 4), indicating that the seriation dating is generally reliable. The only unfurnished grave sampled from the otherwise seventh-century furnished cemetery at Wigber Low (male burial 7; sample WIG-05) was assigned a date range of AD 625–685, using the more reliable female seriation.
Analytical methods
Assessment of the extent to which the population sample was involved in lead production or exposed to environmental lead pollution was achieved through measurement of lead concentrations in the dental enamel. A sample of enamel was taken from each individual, from a second molar, premolar or third molar (OSM1). Enamel does not remodel after its initial formation, so these samples provide a closed record of lead concentrations during childhood, between the ages of approximately four and 12 years. Excavated evidence from the seventh–tenth-century lead-silver mines and processing zones in Melle, western France, suggests that children could have been contaminated while washing and dressing ore before these were smelted, or as bystanders to these activities (Téreygeol Reference Téreygeol1999: 23–25).
The enamel samples were prepared and analysed using inductively coupled plasma mass spectrometry at the British Geological Survey (BGS) (see OSM2). The resulting lead concentrations were then compared across the regional population sample, against median averages for lead concentration from Neolithic to post-medieval population data across Britain (Montgomery et al. Reference Montgomery2010: tab. 11.4; Millard et al. Reference Millard and Zuckermann2014; Moore et al. Reference Moore2021: fig. 1; see OSM2) and with a sixteenth-century silver- and lead-mining population from Sala, Sweden (Price et al. Reference Price2017).
To address the extent to which the sampled Peak District individuals were native to the region, we analysed strontium (Sr), oxygen (O) and lead (Pb) isotopes in the enamel (see OSM1 & OSM2). These analyses help infer whether individuals were likely to have spent their childhood (the period of enamel formation) in the local area. The assessment of geographic origins outlined below is based primarily on strontium (87Sr/86Sr) and oxygen (δ18O) isotope values with reference to the updated BGS Biosphere Map (Evans et al. Reference Evans2023), using 90% confidence intervals for strontium. Lead isotope (207Pb/206Pb and 208Pb/204Pb) analyses are hindered by the overlap in ratios between some of the largest British and continental European lead-producing regions and the long-distance movement of lead-based objects from the Roman period onwards, which exposed populations to lead contamination from different regions (see OSM2). However, some limited observations can be made.
Results and discussion
Geographic origins of the population sample
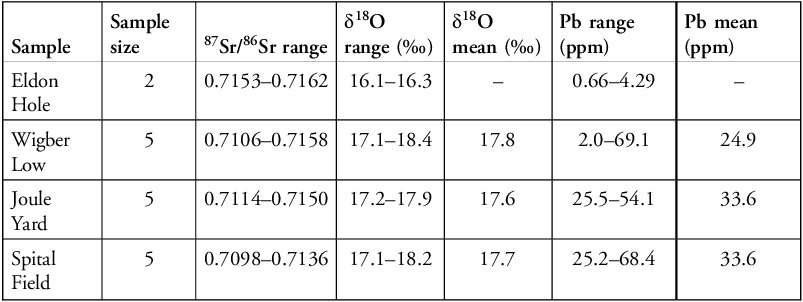
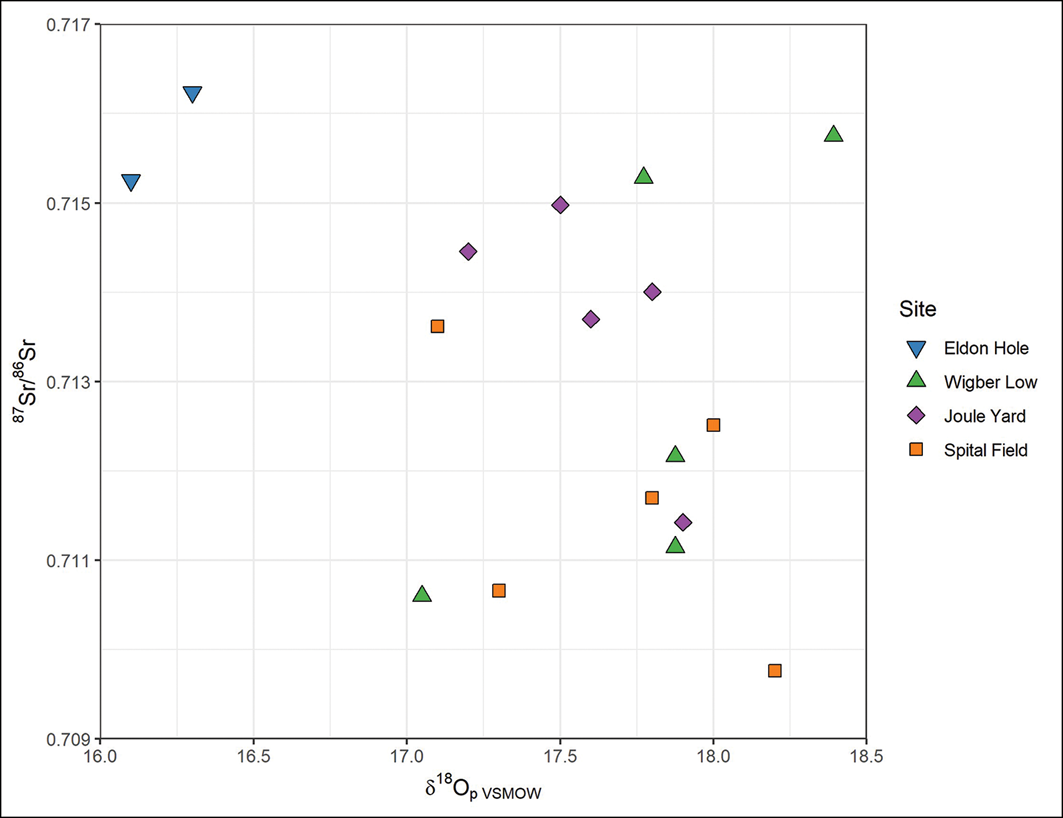
Isotope data are summarised in Table 1 (for more detailed results, see OSM1) and strontium and oxygen isotope values are plotted against each other in Figure 5. A strontium ratio of 0.714 or higher was originally thought to reflect individuals who spent their childhood outside the Peak District (Evans et al. Reference Evans2023) but as this accounted for an unusually high proportion of the population sample (seven of 17), additional analysis of regional minerogenic soils was undertaken (see O’Regan et al. Reference O’Regan2023). This demonstrated that 87Sr/86Sr values of 0.714 and above are more widely present within the Peak District biosphere than hitherto suspected (O’Regan et al. Reference O’Regan2023: 2). It therefore seems most parsimonious to conclude that these high 87Sr/86Sr values are consistent with a childhood in the Peak District, while strontium values alone do not indicate any in-migration.
Summary results of isotopic analyses (for detailed results see OSM1). Sites are presented in chronological order.

Table 1 Long description
A table summarizing isotopic analyses across different samples. The table has six rows and seven columns. The columns are labeled Sample, Sample size, 87Sr/86Sr range, δ18O range (‰), δ18O mean (‰), Pb range (ppm), and Pb mean (ppm). The row labels are Eldon, Hole, Wigber Low, Joule Yard, and Spital Field. Each row provides specific values for each column. For example, the Eldon sample has a sample size of 2, an 87Sr/86Sr range of 0.7153–0.7162, a δ18O range of 16.1–16.3, a Pb range of 0.66–4.29, and no values for δ18O mean and Pb mean. The Wigber Low sample has a sample size of 5, an 87Sr/86Sr range of 0.7106–0.7158, a δ18O range of 17.1–18.4, a δ18O mean of 17.8, a Pb range of 2.0–69.1, and a Pb mean of 24.9. The Joule Yard sample has a sample size of 5, an 87Sr/86Sr range of 0.7114–0.7150, a δ18O range of 17.2–17.9, a δ18O mean of 17.6, a Pb range of 25.5–54.1, and a Pb mean of 33.6. The Spital Field sample has a sample size of 5, an 87Sr/86Sr range of 0.7098–0.7136, a δ18O range of 17.1–18.2, a δ18O mean of 17.7, a Pb range of 25.2–68.4, and a Pb mean of 33.6.
Strontium and oxygen isotope values among the population sample (figure by H. O’Regan, J. Evans & A. Bloxam).

Two individuals possessed both elevated 87Sr/86Sr and depleted δ18O values, which may indicate that they spent their childhood in a different region. These are the two Iron Age individuals from Eldon Hole (ELD-01: 87Sr/86Sr, 0.715; δ18O, 16.1‰; ELD-02: 87Sr/86Sr, 0.716; δ18O, 16.3‰; Figure 5). Outside the Peak District biosphere, the high 87Sr/86Sr values of these individuals are found in south-west England or northern Scotland (Evans et al. Reference Evans2023), though the low δ18O values suggest a potential origin in a colder climate. A Scandinavian origin is possible, as the values are similar to a small group of individuals buried in the Weymouth Viking-age mass grave (Evans et al. Reference Evans2018; Figure 5 & OSM1).
Among the early medieval sample (seventh–eleventh centuries; Wigber Low and Joule Yard; n = 10), one individual has isotope values consistent with a childhood outside the Peak District. Burial 7 at Wigber Low (sample WIG-05) contained the remains of a male, aged approximately 45 years, interred without grave goods. The elevated 87Sr/86Sr and δ18O values of this individual (0.715 and 18.4, respectively) indicate a potential origin from western Britain (Figure 5, OSM1). The movement of people from west to east has been noted in northern Britain from the fifth–seventh centuries (Morez et al. Reference Morez2023: 10); and western British origins have also been identified for females buried in poorly furnished or unfurnished graves in seventh-century central-eastern England (Hamerow et al. Reference Hamerow2024: 499). In the later medieval sample (late eleventh–early sixteenth centuries; Spital Field; n = 5), all individuals have 87Sr/86Sr values below 0.714, consistent with regularly encountered Peak District levels, although two individuals have δ18O values that could potentially indicate a more westerly origin (SPF-SK009, 18.2‰; SPF-SK011, 18.0‰; Figure 5 & OSM1).
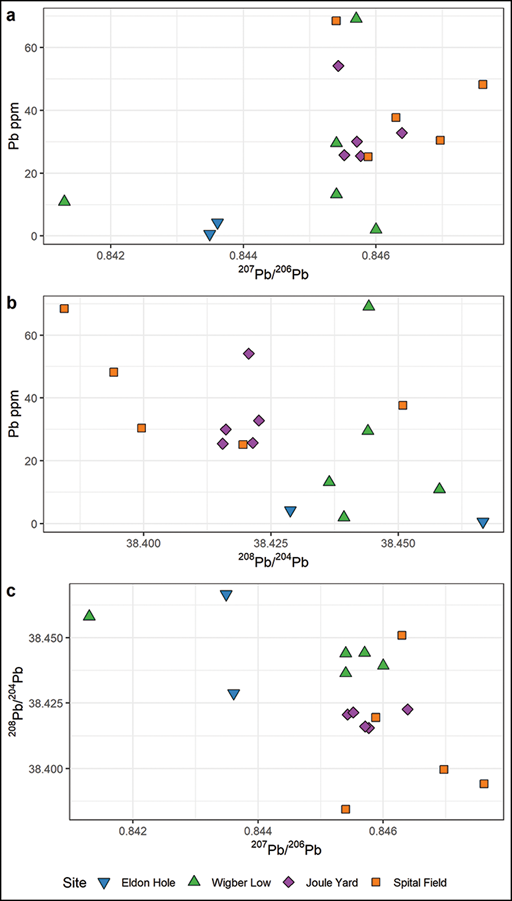
Lead isotope values for the sample population are presented in Figure 6, using ratios of 207Pb/206Pb and 208Pb/204Pb. With one exception, the individuals plot within the Peak District range. The young male from burial 1 at Wigber Low (sample WIG-01) has lead isotope values that fall more within the Yorkshire Pennines range but there is some isotopic overlap with the Peak District (OSM2, Figure S1) and his strontium and oxygen levels are typical of childhood in the Peak District (Figure 5). The Iron Age individuals from Eldon Hole possessed lead isotope values indicative of local Peak District contamination, despite likely originating from outside the region (Figure 6).
Lead isotope and concentration values among the population sample (figure by A. Bloxam, J. Evans & H. O’Regan).

Social dynamics of lead production
Current literature suggests that lead concentrations in human teeth above 0.6–0.7ppm are indicative of anthropogenic activities; while values below 0.5ppm reflect natural ‘background’ levels (Moore et al. Reference Moore2021: 847). Only the Iron Age adult from Eldon Hole had a value that accords with the notional natural background (ELD-01; 0.66ppm). The other individual from this site, a child (ELD-02), had a value of 4.29ppm, showing exposure to anthropogenic lead pollution from ore or lead-working (Figures 7 & 8). This could indicate the movement of a family into the area to exploit mineral resources, or into a community where some lead extraction took place. All but one of the medieval individuals had lead concentrations of more than 10ppm (Figure 7), indicating substantial anthropogenic lead exposure in childhood. Four individuals (27%) had levels over 40ppm; 10 (66%) ranged between 15 and 40ppm; and one (7%) measured 2ppm (Figure 7). Examination of the three cemetery populations chronologically, in comparison with cemetery populations across Britain, provides different perspectives on the social and environmental dynamics of lead production.
Radiocarbon date-ranges and lead concentrations (ppm) among the population sample. Median lead concentrations in studied medieval populations are shown by the dashed lines: fifth–seventh centuries (green); eighth–eleventh centuries (purple); twelfth–fifteenth centuries (orange) (data from Montgomery et al. Reference Montgomery2010; Millard et al. Reference Millard and Zuckermann2014; Moore et al. Reference Moore2021) (figure by H. O’Regan, C. Fear & A. Bloxam).

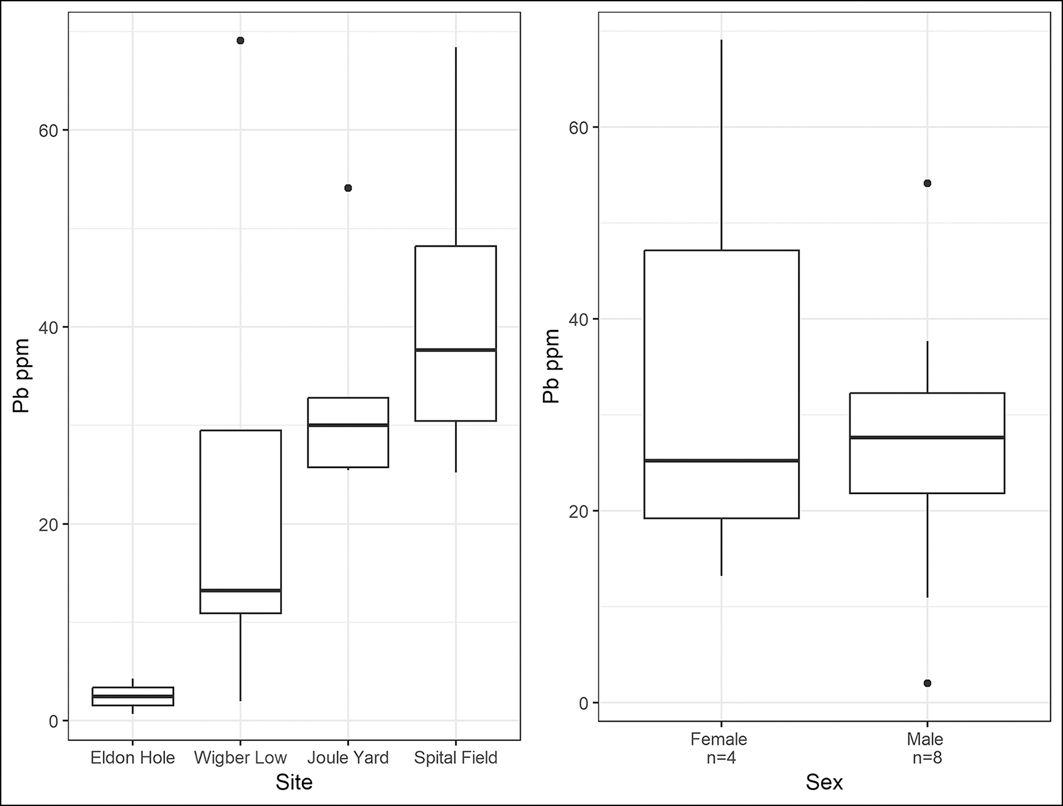
Comparison of lead concentrations (ppm) in human tooth enamel between cemetery samples (left) and between males and females in the population sample (right) (figure by H. O’Regan, C. Fear & A. Bloxam).

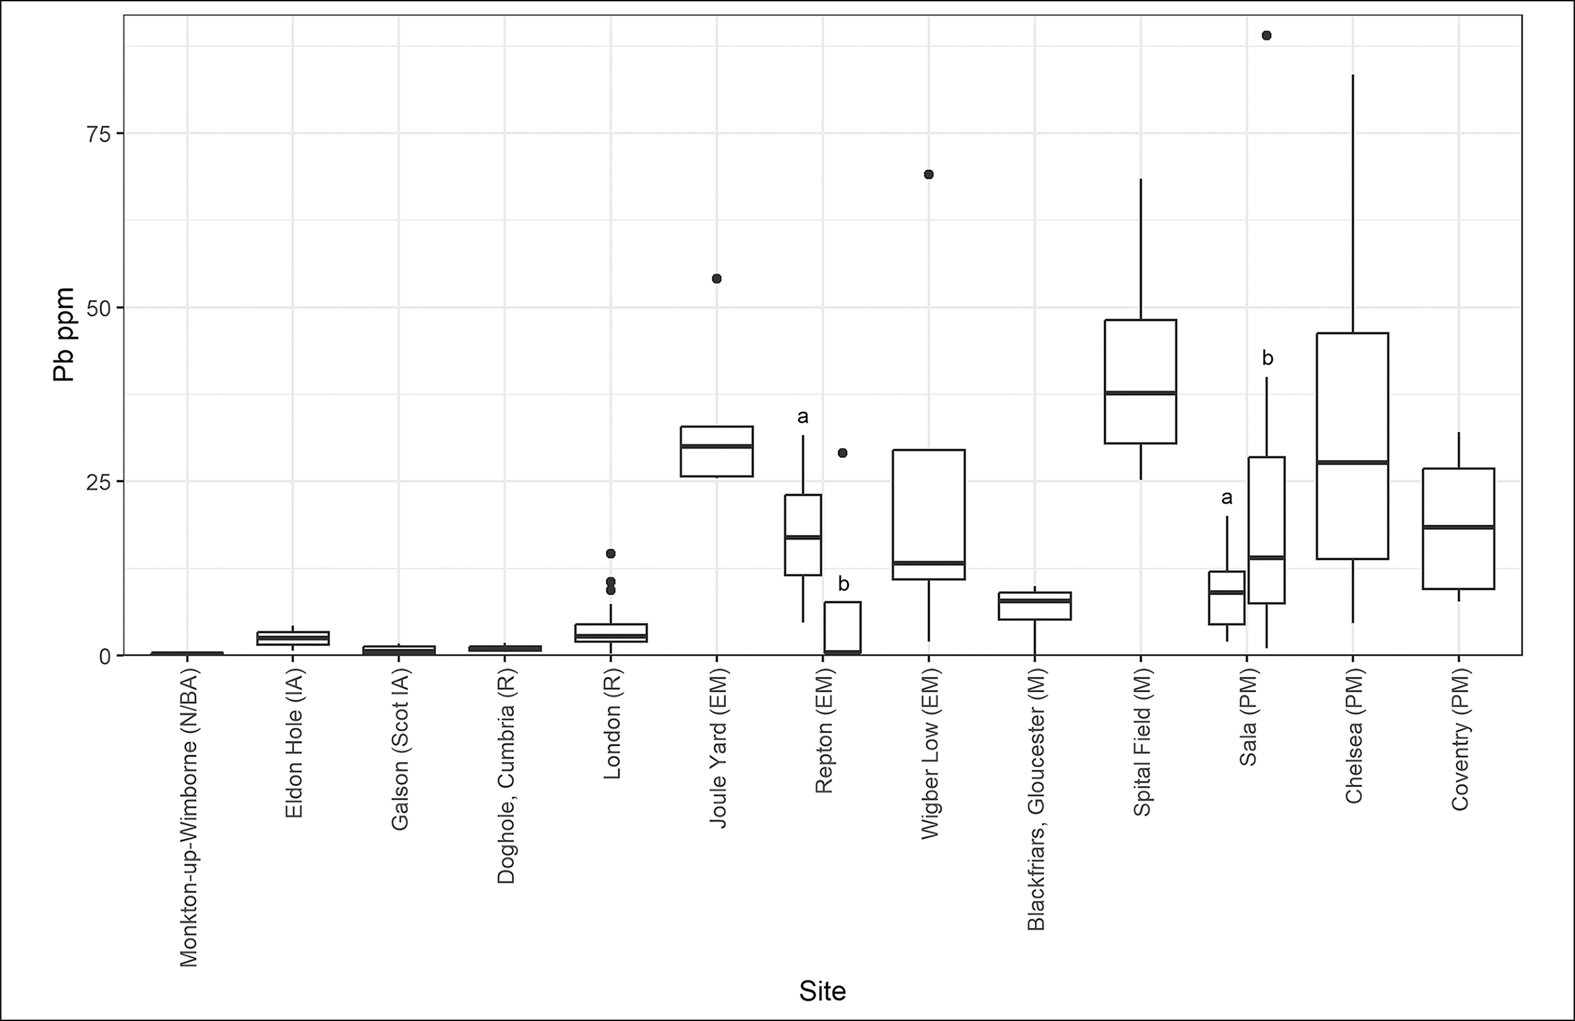
The Wigber Low sample shows distinct variations in lead concentrations, possibly linked to gendered roles and social status (Figures 7 & 8, OSM1). The local males had the lowest exposure (WIG-01, 10.9ppm; WIG-03, 2ppm), and may not have been personally involved in lead production but may have benefited from its control. The male from the unfurnished grave (WIG-05), possibly an immigrant to the area, had a lead level of 29.5ppm. The two females both had lead levels higher than the local males (WIG-04, 69.1ppm; WIG-06, 13.2ppm), possibly reflecting ore processing when children, although the female (WIG-06), furnished with more grave-goods, has a much lower concentration. The male, WIG-03, buried with a sword, possessed a level of lead exposure similar to those from Iron Age and Roman cemeteries in non-lead-producing regions of Britain (Figure 9). The lead concentrations of individuals WIG-04 and WIG-05, however, have been found only in the lead-producing centre at Castleton and in populations from Industrial Revolution-era (post-1750s) Coventry and Chelsea, London (Figure 9, OSM3; Millard et al. Reference Millard and Zuckermann2014).
Lead concentrations (ppm) from individuals included in this study compared with individuals from other sites in Britain. N: Neolithic; BA: Bronze Age; IA: Iron Age; R: Roman; EM: early medieval; M: medieval; PM: post-medieval (figure by H. O’Regan, C. Fear & A. Bloxam).

Demonstration of a direct relationship between high lead levels in childhood tooth enamel and high lead levels in the blood, resulting in lead poisoning, has proven complex (Moore et al. Reference Moore2021: 853). A recent study shows an association between high levels of lead in tooth cementum (formed in adolescence to adulthood) and earlier age at death in modern individuals, suggesting that “Pb over even just a few years in childhood trended towards a negative association with age at death”, but this is not a direct correlation, only a “direction of association” (Farmer et al. Reference Farmer2024: 7). Tentatively, therefore, the deaths of the females from Wigber Low (WIG-04 at 17 years and WIG-06 at 17–25 years) could reflect this ‘direction of association’. Both were seemingly co-located with children aged around two (WIG-04) and five years old (WIG-06).
The comparatively lower lead levels (below 13.5ppm) in the local males, both furnished with weapons (WIG-01, WIG-03), and the female buried with a crystal ball (WIG-06), could reflect legacy landscape lead pollution from Roman production in the region, while the high levels of lead in the male from the unfurnished grave (WIG-05) and the younger female (WIG-04) may identify lower-status households, producing lead for estate owners. The involvement of the Wigber Low community in smelting lead during the mid-seventh century seems to corroborate the hypothesis that increased wealth for local elites coincided with renewed demand for the metal in Christian monumental building (Loveluck Reference Loveluck, Bintliff and Hamerow1995: 90; contra Brown Reference Brown2024).
The slightly later Joule Yard population from Castleton demonstrates an increase in levels of production and consequent lead exposure. All five sampled individuals had lead concentrations above 25ppm, three between 30 and 54ppm (Figure 7). One individual was aged 17–23 years at death, the others were 30–55. These high lead concentrations, mostly during the 680s to 880s (Figures 4 & 7), may indicate a specialist community of lead-mining and smelting families at Castleton. The levels of lead ingested as children suggest a living environment that was highly contaminated by the mid-eighth century. At Wigber Low, from c. 625–685, only those likely undertaking ore processing or smelting were heavily contaminated but by 680–750 the whole population sample at Joule Yard in Castleton, 48km to the north, showed high lead levels. The beginning of a rise in lead pollution in the mid-eighth century is evident in the peat-core from Lindow Moss (Cheshire), approximately 50km west of Castleton; this may also reflect the onset of larger-scale Peak District production, although the spacing of radiocarbon dates along this core gives wide error margins post AD 500, and the predominant wind directions would take Peak District pollution south/south-east, away from Lindow Moss (Le Roux et al. Reference Le Roux2004: figs. 2 & 5; Loveluck et al. Reference Loveluck2020: 478–81).
The lead concentrations in eight individuals from Repton in the Trent Valley (Derbyshire) provide a comparison for Joule Yard, deriving from a population believed to be contemporaneous with a Viking over-wintering camp in 873–874 (Jarman et al. Reference Jarman2018). Four teeth were sampled from inhumation graves and another four from a collection of disarticulated charnel. The lead levels among the individuals from the charnel (two males, two females) range from 4.7ppm to 31.64ppm, with the females having the highest values (females: 20.19 & 31.64ppm; males: 4.7 & 13.76ppm; Figure 10: Repton a; Budd et al. Reference Budd2004: 51, tab. 2). Concentrations in samples from the individual graves were much lower, with a range of 0.4–0.51ppm for three males and a value of 29.5ppm for one juvenile (Figure 10: Repton b). These levels overlap with the lower concentrations observed at Wigber Low but reach their peak at the base of the range of values obtained for Joule Yard (Figure 10). Both females, one male and the unsexed juvenile at Repton had significant exposure to lead in childhood, yet the level of exposure was less than that seen in WIG-04 and almost all the Joule Yard population. One of the lowest values in the Repton sample (0.51ppm) derives from a double burial that included a Thor’s hammer and sword (G 511), echoing the findings from Wigber Low, where the lowest lead concentration comes from the male buried with a sword (WIG-03).
Lead concentration (ppm) ranges from this study and other British sites, alongside the population from Sala, Sweden. N: Neolithic; BA: Bronze Age; IA: Iron Age; R: Roman; EM: early medieval; M: medieval; PM: post-medieval (figure by H. O’Regan, C. Fear & A. Bloxam).

Among the later medieval population at Castleton, all the sampled individuals from Spital Field had lead concentrations between 25 and 68ppm. This, again, reflects childhood in a heavily lead-contaminated environment, and probably membership of lead-mining/smelting households. The only female within the sample has the lowest lead level of the group (although this was still high at 25.2ppm) and she died aged 18–21 years, while the males have higher lead levels but appear to have lived longer. The three females included in this analysis (WIG-04, WIG-06, SPF-SK009) all died between the ages of 17 and 25 and both females from Wigber Low were buried close to young children. Pregnancy remobilises lead that has been deposited within bone (World Health Organization 2010: 27), which may make both mother and fetus more vulnerable to lead poisoning. The high proportion of grave memorials for children at the silver-lead mine/smelting settlement and mint at Melle, dating from the eighth–ninth centuries, may also hint at the impact of lead working but skeletal remains have yet to be analysed (Bourgeois et al. Reference Bourgeois2009: 28).
The two individuals with the highest concentrations of lead at Spital Field have near-identical radiocarbon dates, calibrated to the late twelfth–thirteenth centuries (R-combined: 1175–1270) (Figure 7). Perhaps not coincidentally, the highest levels of Peak District lead production recorded in the Pipe Rolls occurred between the mid-1180s and 1215 (Loveluck et al. Reference Loveluck2020: 486, OSM5: 42). The highest lead-pollution levels in the north-west-facing Colle Gnifetti ice-core (Swiss-Italian Alps) and varved lake-sediment cores from Sweden were also reached at c. 1200 and are attributed to predominantly British pollution sources in both records (Brännvall et al. Reference Brännvall1999: 4392–94; Loveluck et al. Reference Loveluck2020: 476). Levels of lead pollution also reached a medieval zenith by c. 1150 within the wider medieval error margins of the Lindow Moss peat core (Le Roux et al. Reference Le Roux2004: 509).
The 87Sr/86Sr and δ18O isotope results presented here indicate little immigration among the early- to late-medieval populations in the Peak District, where lead production was seemingly a long-term, inherited tradition. In other silver-lead-producing regions, greater levels of inward migration by adolescents and adults resulted in a different pollution profile. For example, lead concentrations among workers buried in two cemeteries (Sala a and b) at the sixteenth-century lead-silver mines at Sala, Sweden, show much lower lead levels in one of the cemeteries (Sala a in Figure 10), compared with the population of the Peak District (OSM3). The Sala mines received significant prisoner-forced labour, bringing in individuals who had spent their childhoods outside landscapes contaminated by lead pollution, and this is probably reflected in the cemetery population with lower enamel lead concentrations (Price et al. Reference Price2017: 5, 11, tab. 1).
Conclusion
Lead levels measured within the tooth enamel of individuals from Wigber Low and Castleton demonstrate that post-Roman lead production in the Peak District was established by the mid-seventh century AD. At this time, lead exposure in childhood varied from minimal to exceptionally high among lead-producing communities, linked to status and gendered roles. By c. AD 750–850, the polluted landscape at the mining/smelting centre at Castleton resulted in very high lead uptake between four and 12 years of age across the entire sample. Pollution levels remained at these elevated levels at Castleton between the twelfth and sixteenth centuries, reaching their highest in the late twelfth–early thirteenth centuries, matching records of pollution laid down in varved lake sediments in Sweden and the Colle Gnifetti Alpine ice core. These lead levels in the medieval population of the Peak District provide a benchmark for the identification of silver/lead-producing communities in other regions and periods, where local production had a deep history. Fortunately, today, the legacy of this historic pollution is carefully managed in the Peak District (Barnatt et al. Reference Barnatt2013; Stubberfield et al. Reference Stubberfield2022).
Funding statement
We gratefully thank the following for funding/enabling this research: University of Nottingham ‘Life in changing environments’ Interdisciplinary-Research-Cluster (award: A2RVZP); University of Nottingham and Peak District National Park Authority (radiocarbon dates); Castleton Historical Society/University of Sheffield (samples, radiocarbon dates); Sheffield Museums Trust/University of Sheffield (images; samples); Tim Allen (Historic England).
Data availability statement
All data available in the OSM.
Online supplementary material (OSM)
To view supplementary material for this article, please visit https://doi.org/10.15184/aqy.2026.10416 and select the supplementary materials tab.






 Open access

