





Introduction
According to the neurodevelopmental model of schizophrenia (Murray, Lewis, & Lecturer, Reference Murray, Lewis and Lecturer1987), subtle deviations in brain development should be already apparent in childhood, years before overt clinical symptoms of the adult disorder manifest. Volumetric brain abnormalities in schizophrenia are well documented in systematic reviews and meta-analyses (Haijma et al., Reference Haijma, Haren, Cahn, Cédric, Koolschijn, Hulshoff Pol and Kahn2013). These abnormalities include reduced intracranial and total brain volumes and are present in antipsychotic medication-naïve cases (Haijma et al., Reference Haijma, Haren, Cahn, Cédric, Koolschijn, Hulshoff Pol and Kahn2013), suggesting early neurodevelopmental origins. However, the existing literature does not provide adequate longitudinal evidence for this hypothesis.
Head circumference (HC), a standard measure of head size, is believed to accurately reflect brain volume. It is routinely collected around birth and therefore could offer valuable insights into early brain development (Bartholomeusz, Courchesne, & Karns, Reference Bartholomeusz, Courchesne and Karns2002; Hshieh et al., Reference Hshieh, Fox, Kosar, Cavallari, Guttmann, Alsop, Marcantonio, Schmitt, Jones and Inouye2016). Indeed, supporting the neurodevelopmental origin of schizophrenia, small HC has been associated with increased risk of schizophrenia in several studies (Cantor-Graae, Ismail, & McNeil, Reference Cantor-Graae, Ismail and McNeil1998; Hultman et al., Reference Hultman, Ohman, Cnattingius, Wieselgren and Lindstrom1997; Robinson et al., Reference Robinson, Ploner, Leone, Lichtenstein, Kendler and Bergen2023). Yet other studies found an effect of larger HC, no association, or relationships that were restricted to females (Cannon, Jones, & Murray, Reference Cannon, Jones and Murray2002b; Hultman et al., Reference Hultman, Sparén, Takei, Murray and Cnattingius1999; Kunugi et al., Reference Kunugi, Takei, Murray, Saito and Nanko1996; Nilsson et al., Reference Nilsson, Stålberg, Lichtenstein, Cnattingius, Olausson and Hultman2005; Wahlbeck et al., Reference Wahlbeck, Forsén, Osmond, Barker and Eriksson2001; Welham et al., Reference Welham, Scott, Williams, Najman, O’Callaghan and McGrath2009). A meta-analysis did not find a statistically significant association between small HC (<32 cm) after birth and risk for schizophrenia, but there was evidence for publication bias (Davies et al., Reference Davies, Segre, Estradé, Radua, De Micheli, Provenzani, Oliver, de Pablo, Ramella-Cravaro, Besozzi, Dazzan, Miele, Caputo, Spallarossa, Crossland, Ilyas, Spada, Politi, Murray and Fusar-Poli2020).
It is unclear whether abnormal HC represents a brain-specific process, or a more generalized growth disorder. Results of individual studies examining the association between length at birth and schizophrenia are mixed, some reporting that shorter length is associated with higher risk (Burchard, Reference Burchard1916; Davies et al., Reference Davies, Segre, Estradé, Radua, De Micheli, Provenzani, Oliver, de Pablo, Ramella-Cravaro, Besozzi, Dazzan, Miele, Caputo, Spallarossa, Crossland, Ilyas, Spada, Politi, Murray and Fusar-Poli2020; Gunnell et al., Reference Gunnell, Harrison, Whitley, Lewis, Tynelius and Rasmussen2005; Kemali, Polani, Polani, & Amati, Reference Kemali, Polani, Polani and Amati1976; Perrin et al., Reference Perrin, Chen, Sandberg, Malaspina and Brown2007; Zammit et al., Reference Zammit, Rasmussen, Farahmand, Gunnell, Lewis, Tynelius and Brobert2007), while others find no association (Latham & Kirkpatrick, Reference Latham and Kirkpatrick2018). A meta-analysis suggested that small HC and short length at birth may both be related to later development of a psychotic disorder (Davies et al., Reference Davies, Segre, Estradé, Radua, De Micheli, Provenzani, Oliver, de Pablo, Ramella-Cravaro, Besozzi, Dazzan, Miele, Caputo, Spallarossa, Crossland, Ilyas, Spada, Politi, Murray and Fusar-Poli2020). Determining if abnormal HC represents a brain-specific process has important implications for identifying potential underlying biological mechanisms.
In contrast to recent studies examining the neurodevelopmental hypothesis, which focus on developmental trajectories from birth through adulthood, including behavior and cognition (Cannon et al., Reference Cannon, Caspi, Moffitt, Harrington, Taylor, Murray and Poulton2002a; Mollon et al., Reference Mollon, David, Zammit, Lewis and Reichenberg2018), studies of HC in schizophrenia have predominantly focused on the period surrounding birth and the early years of life. To the best of our knowledge, only two studies examined HC trajectories. One reported evidence of accelerated head growth from birth to 2 months in females but not in males who went on to develop schizophrenia (Brown et al., Reference Brown, Gyllenberg, Hinkka-Yli-Salomäki, Sourander and McKeague2017). Another birth cohort study showed that young female but not male adults with non-affective psychosis had larger head circumferences at birth than controls but no differences at 5 years old (Welham et al., Reference Welham, Scott, Williams, Najman, O’Callaghan and McGrath2009). Longitudinal studies of HC from birth and through adolescence are lacking.
In the present study, we report data from a population-representative longitudinal study (the Avon Longitudinal Study of Parents and Children [ALSPAC]) that has followed children from birth to adulthood. HC was prospectively assessed at multiple time points from birth until age 15. We charted HC growth from birth through mid-adolescence (age 15) in individuals with operationally defined psychotic disorder (at age 18), the much larger group of individuals with psychotic experiences (PE), and controls drawn from the same cohort, and examined if group difference represents a brain-specific process, or a more generalized growth disorder.
Methods
Sample
Participants were drawn from ALSPAC, a UK-based population cohort study from the Southwest of England (Boyd et al., Reference Boyd, Golding, Macleod, Lawlor, Fraser, Henderson, Molloy, Ness, Ring and Smith2013; Fraser et al., Reference Fraser, Macdonald-wallis, Tilling, Boyd, Golding, Davey smith, Henderson, Macleod, Molloy, Ness, Ring, Nelson and Lawlor2013). Pregnant women with expected delivery dates between April 1, 1991 and December 31, 1992 were recruited, resulting in 14,062 live births (see Supplementary Table S1). Please note that the study website contains details of all the data that is available through a fully searchable data dictionary and variable search tool (http://www.bristol.ac.uk/alspac/researchers/our-data/). Ethical approval was granted by the ALSPAC Ethics and Law Committee (ALEC) and the Local Research Ethics Committees. Informed consent for the use of data collected via questionnaires and clinics was obtained from participants following the recommendations of the ALEC.
We used data from all individuals who had undergone diagnostic interviewing at age 18 (N = 4,675, N with PE = 428). From this sample, 4,588 had at least one measurement of HC, and 3,866 also had complete data on all confounders. Therefore, our analytic sample comprised 3,866 individuals (2,177 females). To improve statistical power and minimize the influence of small sample sizes, only timepoints for HC measurements with at least ten participants in both the PE and control groups were included in the analyses.
We also used data from a subset of individuals (N = 347, 207 females) from ALSPAC who have structural MRI scans acquired at age 20 (for details on sample characteristics and image acquisition see Supplementary Material and references; Drakesmith et al., Reference Drakesmith, Dutt, Fonville, Zammit, Reichenberg, Evans, Lewis, Jones and David2016a, Reference Drakesmith, Dutt, Fonville, Zammit, Reichenberg, Evans, McGuire, Lewis, Jones and David2016b).
Head circumference
HC was measured in all ALSPAC cohort members at birth to 1 year, and at years 7 and 15. Additional measurements between the ages of 4 and 61 months (22 time points overall) were also collected from a subsample of this cohort (see Supplementary Table S1 and Supplementary Figure S1 for available sample size at each measurement time point). HC was collected at 22 time points; the maximum measurement time was 19 (n = 1) and the minimum 1 (n = 26). All 22 time points were included in the longitudinal modeling. For visualization purposes, plots display simplified integer labels.
HC measurements were collected by the ALSPAC team and supplemented by routine measurements by local health services. Outliers at each measurement point were identified using cut-offs from the World Health Organization (WHO) Child Growth Standards and removed (De Onis, Reference De Onis2006; Shi, Korsiak, & Roth, Reference Shi, Korsiak and Roth2018).
Psychotic experiences and psychotic disorder
PE were assessed using the Psychosis-Like Symptom Interview (PLIKSi) (Niarchou, Zammit, & Lewis, Reference Niarchou, Zammit and Lewis2015; Sullivan et al., Reference Sullivan, Kounali, Cannon, David, Fletcher, Holmans, Jones, Jones, Linden, Lewis, Owen, O’Donovan, Rammos, Thompson, Wolke, Heron and Zammit2020; Zammit et al., Reference Zammit, Kounali, Cannon, David, Gunnell, Heron, Jones, Lewis, Sullivan, Wolke and Lewis2013), a semi-structured interview comprising 12 items relating to hallucinations (visual and auditory), delusions (spied on, persecution, grandiosity, thoughts read, reference, control, and other), and thought interference (broadcasting, insertion, and withdrawal). The interview was delivered by trained psychologists when the participant was aged 17/18 years. Participants were asked if they had ever had that experience since the age of 12, responding with either yes, no, or maybe. The interviewer followed up to determine if the experience met criteria for being psychotic, following definitions and guidelines from the Schedules for Clinical Assessment in Neuropsychiatry (Sullivan et al., Reference Sullivan, Kounali, Cannon, David, Fletcher, Holmans, Jones, Jones, Linden, Lewis, Owen, O’Donovan, Rammos, Thompson, Wolke, Heron and Zammit2020; WHO, 1994). Interviewers rated PE as either ‘absent’, ‘suspected’, or ‘definitely present’. Unclear responses were ‘rated down.’
Psychotic disorder was defined as having a ‘definite psychotic experience’ occurring at least once per month over the previous 6 months, which also causes severe distress, impacts social or occupational functioning, or led to help-seeking (Zammit et al., Reference Zammit, Kounali, Cannon, David, Gunnell, Heron, Jones, Lewis, Sullivan, Wolke and Lewis2013).
Confounders
We included participant age, maternal body mass index (BMI), gestational age, birth weight, and maternal highest-level-of-education as confounders.
Data analysis
HC trajectories were modeled using linear mixed-effects regression, incorporating a random intercept on child and a random slope on time. We began by assessing the trajectory of HC over time by running two unconditional models; the first using mean-centered age in months (unconditional model 1) and the second using mean-centered age and age squared (unconditional model 2). If there was evidence of a non-linear association with age, we retained it in the final model. We also ran model fit parameters, Akaike Information Criterion and Bayesian Information Criterion (see also Supplementary Tables S3, S3A, and S3B).
Next, in the primary analysis, we applied a univariable model (model 1) incorporating our clinical variable of interest (psychotic disorder/control or PE/control), and the two age indicators (mean-centered age and age squared) while progressively adjusting for pre-selected confounders. These included maternal education (model 2), maternal BMI (model 3), and gestational age and birth weight (model 4).
We explored the following interactions with group in three separate models: age, age and age squared, and sex. If there was a statistically significant interaction between group and sex, we presented findings stratified by sex.
Sensitivity analyses
To examine if findings are driven by interpolating across time gaps between measurements, or by participants with insufficient longitudinal data, we compared HC at birth, 7 years, and 15 years – time points with the highest number of participants – between case groups and controls.
Secondary analyses
Associations between HC and MRI-derived total intracranial volume (TIV) were examined using Pearson correlations. To test whether atypical HC trajectories may reflect general growth differences, we added height as a time-varying covariate in model 4. (See Supplementary Material, Methods section).
All analyses were conducted in Stata 17 (StataCorp, 2021).
Results
Of the 3,866 individuals in the analytic sample, 62 (1.6%) had a psychotic disorder (49 females), and 339 (8.8%) had PE (218 females). Demographic characteristics of the analytic sample in this study and the full ALSPAC cohort are presented in Supplementary Table S1.
Using a subsample with volumetric MRI measurements at age 20 we show that across a total of 347 participants (114 PE (78 females), of which 30 (23 female) were classified as psychotic disorder, and 233 controls (129 females)) who had neuroimaging data, there was a moderate correlation between TIV at age 20 years and HC at birth (N = 270; r = 0.45, p < 0.0001), and strong correlations with HC at ages 7 (N = 329; r = 0.77, p < 0.0001) and 15 years (N = 265; r = 0.77, p < 0.0001; Figure 1). Across the same age groups, the correlations between TIV and HC remained positive and statistically significant for both males (r = 0.55–0.79, p < 0.0001) and females (r = 0.41–0.74, p < 0.0001).
Scatterplot showing total intracranial volume (TIV, cm3) data collected at age 20 years and its relationship with head circumference (cm) measured at birth (N = 270), 7 years (N = 329), 15 years (N = 265).

Figure 1. Long description
The figure consists of three panels arranged in two rows. All panels share a common x-axis representing Total intracranial volume T I V in centimeters cubed, ranging from 1000 to 1800.
Top-left panel: Head circumference at birth vs T I V in adulthood. The y-axis represents head circumference in centimeters, ranging from 28 to 38. The data points show a moderate positive linear trend. A legend to the right identifies green dots as Controls, orange dots as Psychotic experiences, and pink dots as Psychotic disorder.
Top-right panel: Head circumference at 7 years vs T I V in adulthood. The y-axis ranges from 48 to 58 centimeters. The data points show a stronger, tighter positive linear correlation compared to the birth plot. The legend remains consistent with the first panel.
Bottom-center panel: Head circumference at 15 years vs T I V in adulthood. The y-axis ranges from 50 to 60 centimeters. The data points exhibit the most pronounced linear increase among the three plots, indicating a very strong correlation between head size at age 15 and adult T I V. The legend remains consistent with the previous panels.
HC trajectories through infancy, childhood and adolescence and psychotic disorder
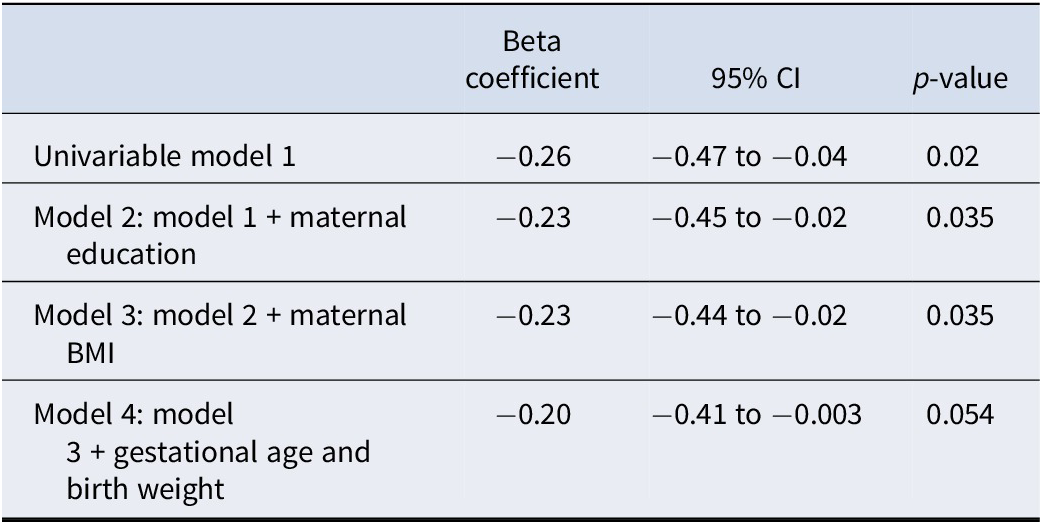
Table 1 shows the demographics and developmental characteristics of the psychotic disorder and PE samples and controls. Figure 2 illustrates measures of HC at birth and at ages 1, 2, 3, 5, 7 and 15 years in cohort members with psychotic disorder and controls, with associated model statistics listed in Table 2 and Supplementary Table S2.
Characteristics of the analytical sample, overall and by case/control status for psychotic experiences (PE) and psychotic disorder in females and males

Table 1. Long description
The table is divided into two main sections: Female analytic sample (N = 2,177) and Male analytic sample (N = 1,689). Each section is further subdivided into Controls, Psychotic experiences (P E s), and Psychotic disorder.
Demographic breakdown:
* Total: Females (1,959 controls, 218 P E s, 49 disorder); Males (1,568 controls, 121 P E s, 13 disorder).
* Ethnicity: Majority are White (2,057 females, 1,596 males). Non-white and missing values are combined.
* Maternal highest educational attainment: Categorized into Compulsory and Non-compulsory.
Biological characteristics (Mean and S D):
* Gestational age: Approximately 39.6 weeks for females and 39.4 weeks for males.
* Birth weight: Approximately 3,393 grams for females and 3,484 grams for males.
* Length at birth: Approximately 50.5 centimeters for females and 51.2 centimeters for males.
* Height at 15.5 years: Approximately 164.7 centimeters for females and 174.4 centimeters for males.
* Maternal pre-pregnancy B M I: Approximately 22.8 for females and 22.9 for males.
* Average number of head circumference measurements: Ranging from 7.4 to 8.9 across groups.
Note: PE, psychotic experiences at age 17/18.
a Non-white ethnicity and missing values were combined to avoid cells with <5 individuals as a requirement from ALSPAC to avoid potential breaches of anonymity. We collapsed maternal highest educational attainment into a binary variable to avoid breaches of anonymity, analyses used the non-collapsed version consisting of five levels of educational attainment (Compulsory i.e. CSE School leaving exam, Vocational, O level – National high school exam age 15/16; Non-compulsory i.e. A level – National high school exam age 17/18, University Degree).
Head circumference trajectories (cm) in participants with and without psychotic disorder by age. The panel charts head circumference data using boxplots, and 95% confidence intervals.

Figure 2. Long description
The x-axis represents Age in years with discrete intervals at 0, 1, 2, 3, 5, 7, and 15. The y-axis represents Head circumference in centimeters, ranging from 30 to 60. A legend on the right identifies green boxplots as Controls and pink boxplots as Psychotic Disorder.
Data trends from left to right:
* At age 0, both groups have a median head circumference of approximately 40 cm with wide vertical whiskers extending from 30 to 50 cm.
* From ages 1 to 7, there is a steady logarithmic increase in head circumference for both groups. The green control boxes consistently sit slightly higher than the pink psychotic disorder boxes, indicating a marginally larger median head circumference in controls.
* At age 15, the gap between groups is most visible. The green control group median is approximately 55 cm, while the pink psychotic disorder group median is approximately 54 cm.
* Outliers, represented by small black diamonds, are present above and below the whiskers for both groups across most age points, with a notable cluster of high outliers for the control group at age 15.
Univariable and multivariable linear mixed regressions assessing head circumference in psychotic disorder versus controls (Analytic sample N = 3,589, Psychotic Disorder N = 62, Controls N = 3,527)

Table 2. Long description
The table consists of four columns: Model description, Beta coefficient, 95% C I, and p-value.
* Univariable model 1: Beta coefficient -0.26, 95% C I -0.47 to -0.04, p-value 0.02.
* Model 2 (model 1 plus maternal education): Beta coefficient -0.23, 95% C I -0.45 to -0.02, p-value 0.035.
* Model 3 (model 2 plus maternal B M I): Beta coefficient -0.23, 95% C I -0.44 to -0.02, p-value 0.035.
* Model 4 (model 3 plus gestational age and birth weight): Beta coefficient -0.20, 95% C I -0.41 to -0.003, p-value 0.054.
The analytic sample size N equals 3,589, consisting of 62 individuals with Psychotic Disorder and 3,527 Controls.
Note: Unconditional Models 1 (mean-centered age) and 2 (model 1 + age squared) are presented in Supplementary Material. For univariable model 1 onwards, we incorporated random effects of participant id and mean-centered age. Univariable model 1 consisted of group status and time variables. Interactions between group with age (p > 0.5) and age squared (p > 0.5) were not statistically significant and therefore the group coefficient was not included in this table.
The psychotic disorders group showed consistently smaller HC starting at birth and throughout infancy, childhood, and up to adolescence (B = −0.26, 95% CI: −0.47 to −0.04, p = 0.02). There was no statistically significant group by age interaction (p > 0.5), and no statistically significant interaction of group by sex (p = 0.2). Group differences were not attenuated in models that included adjustment for maternal education (B = −0.23, 95% CI: −0.45 to −0.02, p = 0.035), BMI (B = −0.23, 95% CI −0.44 to −0.02, p = 0.035), and gestational age and birth weight (B = −0.20, 95% CI: −0.41 to 0.003, p = 0.054).
Sensitivity analyses supported the main analyses. The psychotic disorders group had smaller HC at birth, and at 7 years, and 15 years of age, and the differences were statistically significant at the p < 0.05 level at ages 7 and 15 (Supplementary Table S4).
HC trajectories through infancy, childhood and adolescence and psychotic experiences
Because there was a statistically significant group by HC by sex interaction (p = 0.02), we conducted analyses stratified by sex. Figure 3 illustrate measures of HC at birth and at ages 1, 2, 3, 5, 7 and 15 years in cohort members with PE and controls, for males and females separately. Associated model statistics are listed in Table 3 and Supplementary Tables S3A and S3B. Females with PE had statistically significantly smaller HC compared to female controls across childhood and adolescence (B = −0.27, 95% CI: −0.49 to −0.05, p = 0.016). Group differences were not attenuated in models that included adjustment for maternal education (B = −0.23, 95% CI: −0.45 to −0.006, p = 0.044), BMI (B = −0.22, 95% CI −0.44 to −0.004, p = 0.046), and gestational age and birth weight (B = −0.25, 95% CI: −0.46 to 0.04, p = 0.022).
Head circumference trajectories (cm) in females, N = 2,177 (Top) and males, N = 1,689 (Bottom) with and without psychotic experiences (PE). Head circumference is modeled with 95% confidence intervals. We present age in years using integer values.

Figure 3. Long description
A multi-panel figure containing two vertically stacked box plots.
Top Panel (Females):
The x-axis represents Age in years with discrete markers at 0, 1, 2, 3, 5, 7, and 15. The y-axis represents Head circumference in centimeters ranging from 30 to 60. For each age, two boxes are shown: green for Controls and orange for P E. At age 0, both groups have a median near 39 centimeters with wide whiskers. As age increases, both groups show a logarithmic growth curve, reaching a median of approximately 55 centimeters by age 15. The boxes for Controls and P E remain largely overlapping at all time points, indicating similar trajectories.
Bottom Panel (Males):
The axes and age markers are identical to the top panel. The legend indicates green for Controls and light blue for P E. At age 0, the median is slightly higher than females, around 40 centimeters. The growth follows a similar upward curve to the female panel, plateauing toward age 15 with a median near 56 centimeters. Similar to the top panel, the green and light blue boxes show significant overlap across all age intervals, with outliers represented by individual black dots above and below the whiskers, particularly at ages 1, 2, 7, and 15.
Head circumference trajectories in females and males with psychotic experiences (PE) versus Controls

Table 3. Long description
The table is organized into seven columns. The first column lists the models, while the remaining six are split into two groups: Females and Males. Each group includes columns for Beta coefficient, 95% C I, and p-value.
* Univariable model 1: Females show a Beta of minus 0.27 (C I minus 0.49 to minus 0.05, p equals 0.016). Males show a Beta of 0.35 (C I 0.05 to 0.65, p equals 0.023).
* Model 2 (model 1 plus maternal education): Females show a Beta of minus 0.23 (C I minus 0.4 to minus 0.006, p equals 0.044). Males show a Beta of 0.34 (C I 0.04 to 0.65, p equals 0.025).
* Model 3 (model 2 plus maternal B M I): Females show a Beta of minus 0.22 (C I minus 0.44 to minus 0.004, p equals 0.046). Males show a Beta of 0.33 (C I 0.03 to 0.64, p equals 0.029).
* Model 4 (model 3 plus gestational age and birth weight): Females show a Beta of minus 0.25 (C I minus 0.46 to minus 0.04, p equals 0.022). Males show a Beta of 0.40 (C I 0.12 to 0.69, p equals 0.006).
Females consistently show negative beta coefficients while males show positive beta coefficients across all models.
Note: Unconditional Model 1 (age) and Model 2 (mean-centered age and age squared) are presented in Supplementary Material. For univariable model 1 onwards, we incorporated random effects of participant id and mean-centered age. Univariable model 1 consisted of PE and time variables. Stratified interactions between PE and age were non-significant (all p values >0.5) and therefore the group coefficient was not included in this table. Presented are results of linear mixed regressions assessing head circumference in PE versus controls, stratified by sex (Analytic samples: Females: N = 2,177, PE = 218, Controls = 1,959; Males: N = 1689, PE = 121, Controls = 1,568).
In contrast, males with PE had consistently larger HC across childhood and adolescence compared to male controls (B = 0.35, 95% CI: 0.05 to 0.65, p = 0.023). Group differences were not attenuated in models that included adjustment for maternal education (B = 0.34, 95% CI: 0.04 to 0.65 p = 0.025), BMI (B = 0.33, 95% CI: 0.04 to 0.64 p = 0.029), and gestational age and birth weight (B = 0.40, 95% CI: 0.12 to 0.69 p = 0.006).
In females, results of the sensitivity analyses were consistent with those of the main analyses (Supplementary Table S5). In males, however, there was smaller HC at birth, but larger HC at ages 7 and 15 (Supplementary Table S5).
HC and general growth trajectories
Adjustment for height, as a time-varying covariate, led to attenuation of group differences in HC trajectories between individuals with psychotic disorder and controls (−0.05, 95% CI: −0.21 to 0.11, p = 0.52), and in group differences in HC trajectories between females with and without PE (B = −0.12, 95% CI: −0.29 to 0.05, p = 0.16). In contrast, group differences remained statistically significant in males with PE (B = 0.36, 95% CI: 0.13 to 0.58, p = 0.002).
Discussion
Using a population-based cohort followed prospectively from birth, this study charts the course of HC from birth through to age 15 years in individuals with psychotic disorder and PE, and examines if differences in course represent a brain-specific process, or a more generalized growth disorder. Our findings advance knowledge in three important ways.
Individuals who grew up to have operationally defined psychotic disorder showed smaller HC starting at birth and throughout childhood and adolescence. HC is recorded in populations throughout the world, often from birth, and is generally assumed to be a proxy measure of brain size. Crucially, we show that HC correlates strongly and significantly with MRI measures of brain volume in early adulthood. In adulthood, schizophrenia is associated with reduced total brain volume (Haijma et al., Reference Haijma, Haren, Cahn, Cédric, Koolschijn, Hulshoff Pol and Kahn2013). Thus, we provide evidence for the first time in a population-based longitudinal study that neurodevelopmental brain abnormalities associated with psychotic disorders manifest already around birth and remain static and persistent throughout development.
We also compared trajectories of HC between individuals with the broader phenotype of PE versus controls. In our sample, females and males with PE showed diverging trajectories of HC. Females who had PE had smaller HC compared to female controls starting in childhood and through adolescence. In contrast, compared to male controls, males with PE had larger HC.
HC correlates with height (Martins & Lyons Jones, Reference Martins and Lyons Jones1994; Perrin et al., Reference Perrin, Chen, Sandberg, Malaspina and Brown2007). Importantly, when controlling for height across development, the association between smaller HC and psychotic disorder, and in females, but not males, with PE, was attenuated, suggesting that general growth restriction, rather than brain growth specifically, may be dysregulated in psychosis, with potentially sex-specific modulation. The neurodevelopmental manifestations of the liability to the psychosis spectrum, as reflected in early-life head growth, may be qualitatively different in males and females with psychotic symptoms. Future studies with larger samples should verify this finding.
The mechanism linking growth and schizophrenia remains to be elucidated. However, the pattern of smaller height and general abnormal growth, coupled with evidence for female sex skewness of the association, suggests a possible role for insulin-like growth factor-I (IGF-I). This plays a major role in the regulation of both prenatal and postnatal growth (Le Roith, Scavo, & Butler, Reference Le Roith, Scavo and Butler2001) and shows patterns of sexual dimorphism with higher concentrations in females (Geary et al., Reference Geary, Pringle, Rodeck, Kingdom and Hindmarsh2003). Perinatal insults such as maternal infection, complications during childbirth, and prenatal and postnatal nutritional deficiencies are all linked to increased risk of psychotic disorders and reduced HC and growth, and may contribute to the observed associations (Davies et al., Reference Davies, Segre, Estradé, Radua, De Micheli, Provenzani, Oliver, de Pablo, Ramella-Cravaro, Besozzi, Dazzan, Miele, Caputo, Spallarossa, Crossland, Ilyas, Spada, Politi, Murray and Fusar-Poli2020; Hultman et al., Reference Hultman, Sparén, Takei, Murray and Cnattingius1999).
The study has several limitations. As with most longitudinal studies spanning infancy through adulthood, varying numbers of individuals were available at different ages. Therefore, while our sample was drawn from a well-characterized, population-based birth cohort, the results require replication in independent samples. The number of individuals meeting our operational case definition of psychotic disorder was small and did not entail independent diagnosis by a healthcare provider. There were few males with psychotic disorder in this sample (n = 13), so the findings based on these individuals must be interpreted with caution. In ALSPAC, both PE and psychotic disorder were more prevalent in females. While large epidemiological studies report higher prevalence of PE in males during childhood (Karcher et al., Reference Karcher, Paul, Johnson, Hatoum, Baranger, Agrawal, Thompson, Barch and Bogdan2022), in adolescence and adulthood this shifts, and females have up to 50% higher prevalence of PE (Johns et al., Reference Johns, Cannon, Singleton, Murray, Farrell, Brugha, Bebbington, Jenkins and Meltzer2004; McGrath et al., Reference McGrath, Saha, Al-Hamzawi, Alonso, Bromet, Bruffaerts, Caldas-De-Almeida, Chiu, De Jonge, Fayyad, Florescu, Gureje, Haro, Hu, Kovess-Masfety, Lepine, Lim, Mora, Navarro-Mateu and Kessler2015). We adjusted for birth weight rather than a cumulative measure of obstetric complications in our analyses. This was done because birth weight is an overall robust indicator of intrauterine health, development, and infant survival. It is related to maternal lifestyle factors and cardiometabolic health, as well as captures familial factors related to intrauterine development. In addition, information about birth weight in ALSPAC is almost complete. In contrast, there is a high (~30%) rate of missing data for information on individual obstetric complications (Merritt et al., Reference Merritt, Luque Laguna, Sethi, Drakesmith, Ashley, Bloomfield, Fonville, Perry, Lancaster, Dimitriadis, Zammit, Evans, Lewis, Kempton, Linden, Reichenberg, Jones and David2023).
In sum, this study provides novel evidence of a deviation in HC trajectories that persists from birth to adolescence in young people with psychotic disorders and more broadly, PE. This deviation in HC is potentially part of a more general abnormality in growth across the psychosis spectrum, supporting a neurodevelopmental origin of schizophrenia. Future studies should examine factors regulating growth during early life, including sex, to understand the molecular mechanisms relating to abnormal development and psychosis.
Supplementary material
The supplementary material for this article can be found at http://doi.org/10.1017/S0033291726105418.
Acknowledgments
The United Kingdom Medical Research Council, the Wellcome Trust, and the University of Bristol provide core support for the Avon Longitudinal Study of Parents and Children (ALSPAC). This research was specifically funded by Medical Research Council grant MR/S003436/1. Dr Ashley was supported by the Beatrice and Samuel A Seaver Foundation PhD Studentship.
Author contribution
We are grateful to all the families who took part in this study, the midwives for their help in recruiting them, and the whole ALSPAC team, which includes interviewers, computer and laboratory technicians, clerical workers, research scientists, volunteers, managers, receptionists, and nurses.
Funding statement
The funding sources had no role in the design and conduct of the study; collection, management, analysis, and interpretation of the data; preparation, review, or approval of the manuscript; and decision to submit the manuscript for publication.
Competing interests
The authors report no conflicts of interests.




 Open access

