Implications
A standardized, biopsy-based performance test for boar taint in live breeding candidates has been presented. The method is suitable for large-scale breeding programmes and allows immediate and accurate identification of low-risk boars for selection. Information on fewer progeny is required compared with methods based on carcass fat samples, and discrimination between members of the same litter is possible. Until now, this method has not been formally discussed as a performance test. The biopsy device described can be used to investigate the trend of individual boar taint components over time in live animals and could help clarify the relationships between puberty, age, weight and boar taint compounds.
Introduction
In many European countries, the problem of boar taint has generally been avoided through the long-standing practice of castration. Approximately 80% of the 125 million boars annually slaughtered in Europe are surgically castrated, predominantly without the use of anaesthesia (Fredriksen et al., Reference Fredriksen, Font i Furnols, Lundström, Migdal, Prunier, Tuyttens and Bonneau2009). Because of increasing animal welfare awareness, a general consensus to discontinue surgical castration by 2018 was taken by many European stakeholders. As an intermediary step, signatories agreed to implement analgesia and/or anaesthesia by 2012 (European Declaration on Alternatives to Surgical Castration, 2011). Although the current method of surgical castration using an anaesthetic is generally accepted by retailers and consumers (Fredriksen et al., Reference Fredriksen, Sibeko Johnsen and Skuterud2011; Tuyttens et al., Reference Tuyttens, Vanhonacker, Verhille, De Brabander and Verbeke2011), it is considered a transitional, short-term step towards the long-term goal of completely eliminating surgical castration. Feasible alternatives must be explored and implemented within the next 5 years.
Two promising alternatives to surgical castration of male piglets include immunocastration (vaccination against gonadotrophin-releasing factor, GnRF) and finishing intact boars. Other alternatives, such as sperm sexing methods to produce only female offspring, are not expected to be ready for implementation in the foreseeable future. Excellent reviews on welfare aspects (von Borell et al., Reference von Borell, Baumgartner, Giersing, Jä ggin, Prunier, Tuyttens and Edwards2009), meat quality considerations (Lundström et al., Reference Lundström, Matthews and Haugen2009) and economic implications (de Roest et al., Reference de Roest, Montanari, Fowler and Baltussen2009) of the various alternatives have been published. Although approved for use in over 60 countries worldwide, immunocastration is regarded sceptically by many retailers and consumers because of fear of residues in meat and unknown long-term effects on humans (Fredriksen et al., Reference Fredriksen, Sibeko Johnsen and Skuterud2011). Finishing intact boars, on the other hand, is considered a more natural and economically advantageous approach because of improved animal welfare, lower production costs, leaner carcasses and reduced N excretion (European Food Safety Authority (EFSA), 2004).
Before large-scale production of intact boars can be undertaken, two major challenges must be addressed. Depending on breed and various environmental factors, ∼5% to 50% of intact boars are tainted (Zamaratskaia and Squires, Reference Zamaratskaia and Squires2009); carcasses of such animals must be identified in the abattoir and either discarded or processed in alternative channels. Most research in this area has focused on developing an ‘electronic nose’ to automatically detect tainted carcasses in the slaughtering line; however, most large abattoirs rely on human nose-based methods. The second challenge involves reducing the number of tainted animals. Tainted meat is virtually worthless; the economic advantages of finishing intact boars are lost if many carcasses are deemed unfit for human consumption. In contrast, if the number of tainted animals is reduced, the full economic advantages of finishing intact boars can be realized.
Androstenone, skatole and indole are considered the main biochemical compounds responsible for boar taint (Prelog and Ruzicka, Reference Prelog and Ruzicka1944; Patterson, Reference Patterson1968; Vold, Reference Vold1970), and a substantial portion of the phenotypic variation in these compounds observed in the population is genetically based (Willeke et al., Reference Willeke, Claus, Muller E Pirchner and Karg1987). As a result, breeding can effectively reduce the occurrence of taint. Measuring these compounds in live male breeding candidates will provide a quantitative, objective basis for selecting low-risk breeding animals.
There is currently no standardized method for phenotypically measuring the risk that a breeding candidate will produce tainted offspring based on its own performance. One possibility is to measure boar taint compounds directly in the live breeding candidate (own performance). This allows early identification of low-risk boars, because performance information is immediately available and breeding organizations do not have to wait until data on large numbers of progeny have been collected. Furthermore, direct performance testing of the breeding individual allows discrimination between members of the same litter. Until now, this method has not been formally discussed.
The first aim of this study was to develop, validate and implement a performance test for boar taint on live breeding candidates using tissue samples via biopsy. The second aim of the study was to estimate the heritability of boar taint compounds and the genetic correlations between them using the small tissue samples collected.
Material and methods
Development of a performance test
The methods implemented in this study were carried out in accordance with recommendations of the Swiss Federal Veterinary Office and the Ethical Principles and Guidelines for Experiments on Animals, as formulated by the Swiss Academy of Medical Sciences and the Swiss Academy of Sciences. The development of the performance test was carried out in five steps to reduce the number of animals required and to minimize stress in tested animals.
Step 1a: Development of a biopsy device
A captive bolt device similar to that implemented by Topigs in Beuningen, NL (J. Merks and M. Westerhof, personal communication), was developed using a rabbit stunning device (Klaus-Gritsteinwerk GmbH & Co., Bünde, Germany) and modified by Jossi Orthopedics (Islikon, Switzerland). The compression spring in the original device was substituted with a stronger one (model VD-278D, maximal force 247.88 N, Gutekunst +Co.KG Federnfabriken, Metzingen, Germany), and a dismountable cylindrical grip was added. The reusable chrome biopsy needle (Jossi Orthopedics) measured 65 × 7 mm at the base and 65 × 6 mm at the apex. A window (20 × 6 mm) for removing the tissue core was cut out of the cylindrical rounded needle 20 mm from the sharpened end. A metal wire 0.4 mm in diameter was fixed inside the needle 7 mm from the sharpened end to hold the tissue core in the needle (Supplementary Figure S1). Initial testing was done on carcasses of dam-line boars reared in a central testing station (Sempach, Switzerland) and slaughtered in the in-house abattoir. Tests were conducted to evaluate the strength of the compression spring, the resistance of the biopsy needle and the most effective insertion location and angle for maximum adipose tissue collection.
Step 1b: Chemical extraction methods for small tissue samples
All biopsy core samples throughout this study were packed in ice immediately after collection and sent via express mail to the research lab Agroscope (Posieux, Switzerland) for quantification of androstenone, skatole and indole. Because the extracted core size was small, special chemical extraction methods were established. A number of carcasses were biopsied twice to compare boar taint concentrations of multiple samples and to test repeatability of the method. Biopsy samples contained adipose tissue, skin and muscle tissue, as well as blood and hair. Adipose tissue was separated mechanically from the epithelium and heated using a microwave to obtain liquid fat (LF). LF samples were extracted with methanol containing two internal standards (androstanone and 2-methylindole). Boar taint compounds were determined by HPLC by means of fluorescence detection; an in-situ derivatization step with danzylhydrazine in the presence of BF3 was included for androstenone (Ampuero Kragten et al., Reference Ampuero Kragten, Verkuylen, Dahlman, Hortos, Garcia-Regueiro, Dahl, Andresen, Feitsma, Mathur and Harlizius2011).
Step 2: Biopsy on live boars immediately before slaughter
Following the establishment of chemical extraction methods and testing the mechanical function of the device, behavioural observations (vocalization, movement) and blood loss observations were made on four live dam-line boars biopsied immediately before slaughter. The biopsies were conducted by the project veterinarian and were taken without general or local anaesthesia.
Step 3: Biopsy on live boars 10 days before slaughter
After ensuring that the biopsy technique evoked no or only minor reactions from test animals, 14 further dam-line boars were biopsied 10 days before slaughter using the techniques developed in steps 1 and 2. Both the biopsy needle and the biopsy site were disinfected with 80% ethanol before sampling. The effect of antibiotic spray (tetracycline) after sampling was also investigated (Group 1: eight individually housed boars with tetracycline treatment; Group 2: six control boars in group housing). Behaviour and wound healing were monitored daily until slaughter according to predefined scoring guidelines by the animal caretaker (0: no discharge/no swelling/normal colour; 1: slight discharge/slight swelling/skin slightly discoloured; 2: discharge with blood/moderate swelling/skin reddened; 3: discharge with pus/severe swelling/skin dark red).
Step 4: Initial field testing
Techniques developed in steps 1 to 3 were then implemented on 44 large white sire-line boars in a field setting. The animals were biopsied by the project veterinarian during the routine performance test (100 to 130 kg live weight: performance testing traits include ultrasonic measurement of backfat, weight and exterior). At this stage, methods developed in steps 1 to 4 were evaluated by the public veterinary authorities and the Swiss animal protection association; it was decided that specially trained field technicians can carry out the biopsy procedure, and that no local or general anaesthesia is required.
Step 5: Training of field technicians, routine implementation, data acquisition for parameter estimation
Four field technicians were trained by the project veterinarian to conduct biopsies using the techniques established in steps 1 to 4. The trained field technicians collected biopsy samples of 516 large white sire-line boars on nine herd book farms during the routine performance test (see step 4). Half of the biopsies were conducted under supervision of the project veterinarian.
Calculating genetic parameters
Data collected during own performance testing (step 5) were used to test statistical models and to estimate genetic parameters for androstenone, skatole and indole.
Modelling
Data obtained in step 5 were used for model testing. After data editing, 528 observations remained (96 animals were biopsied twice, six were biopsied three times). Boar taint data were log transformed to achieve a normal distribution. A total of 36 different mixed linear models were tested for each boar taint compound using the nlme package of R-2.13.0 (R Development Core Team, 2008). No permanent environment effect was considered because only a limited number of boars had multiple observations. Example model variations included consideration of age and live weight as covariates or as categorical traits and various combinations thereof. The Akaike information content and Bayesian information content were used to rank the models in terms of their information content. Significance of fixed effects (categorical live weight at biopsy, categorical age at biopsy and farm/season) was tested using the ANOVA procedure of R-2.13.0 (R Development Core Team, 2008); only significant effects were used for further genetic analysis. The models used for further analysis are presented in Table 1.
Selected models for variance component estimation of boar taint compounds

Pedigree information of 2245 ancestors of biopsied animals was available from the SUISAG databank. Variance component estimation using restricted maximum likelihood methods implemented in VCE (Neumaier and Groeneveld, Reference Neumaier and Groeneveld1998; Groeneveld et al., Reference Groeneveld, Kovaˇc and Mielenz2010) was used for estimating variance components using univariate and multivariate models.
Results
Development of a performance test
Biopsy device and chemical extraction methods for small tissue samples
The most effective insertion location was in the neck region in the middle of an imaginary line between the upper ear border and the shoulder blade (Supplementary Figure S2). A needle insertion angle of 35° proved most effective for maximal fat tissue collection.
Because quantification of boar taint compounds is ultimately performed in LF, the utile fraction of LF in adipose tissue was determined (utile fraction = mg LF/mg adipose tissue at 45°C), whereby a minimum of 70 mg LF is required for accurate quantification of boar taint. A preliminary test with 20 biopsy samples (mean ± s.d.: 197.5 ± 42.7 mg of adipose tissue) resulted in 38.0 ± 25.9 mg of LF (utile fraction = 19%). A second test with 16 larger samples (mean ± s.d.: 475.9 ± 116.0 mg of adipose tissue) gave 133.3 ± 47.7 mg of LF (utile fraction = 28%). On the basis of these results, it was observed that in order to obtain 70 mg of LF from a biopsy sample, a minimum of 250 to 300 mg adipose tissue is required (250 mg × 28% utile fraction = 70 mg LF).
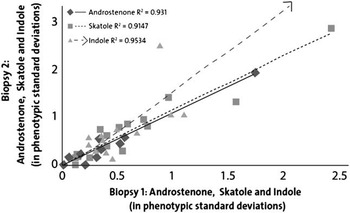
Whenever possible, two replicates from each biopsy core were analysed. Samples were classified in two groups according to the amount of LF available: (a) >70 to 100 mg LF and (b) ⩽70 mg LF; whenever possible, at least one replicate was made with 70 to 100 mg LF. Despite the limited amount of LF, quantification of boar taint components from small samples was generally accurate and repeatable. Correlation of androstenone values obtained from standard-sized samples of neck fat and those obtained using biopsy cores was high (r = 0.938). Repeated sampling showed correlations close to unity for doubled biopsies (two cores; Figure 1).
Relationship between androstenone, skatole and indole values of two separate adipose samples from the same boars (biopsy 1 and biopsy 2, n = 18).

Biopsy on live boars
One of the four boars biopsied immediately before slaughter showed a moderate vocalization; one boar twitched and one boar lost ∼4 ml of blood. The reactions observed were generally slight, indicating a low invasiveness of the procedure. With regard to wound healing in Group 1, one animal showed slight discharge after 1 day, and one animal showed slight swelling. No discharge, redness or swelling was observed after 3 days. In Group 2, slight swelling was still seen in four of six animals 4 days after sampling and in two of six animals 5 days after sampling. By day 6 post biopsy, no difference between Groups 1 and 2 was observed.
Field testing, training of field technicians and routine implementation
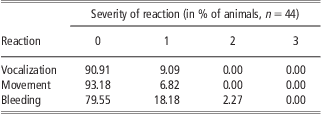
A total of 44 large white sire-line boars were biopsied by the project veterinarian during the routine performance. Over 90% of animals tested showed no behavioural response to the biopsy procedure (Table 2). No severe reactions were observed.
Observed boar reaction to biopsy
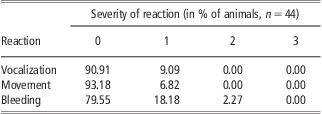
0 = no vocalization/no movement/no blood loss; 1 = slight vocalization/slight twitch/ <3 ml blood loss; 2 = moderate vocalization/ <3 side steps/3 to 5 ml blood loss; 3 = severe vocalization/flight attempt/ >5 ml blood loss.
Estimation of genetic parameters
Characteristics of the data
Mean boar taint compounds were within plausible ranges (in μg/g LF: androstenone mean = 0.578, σ = 0.527; skatole mean = 0.033, σ = 0.002; indole mean = 0.032, σ = 0.002).
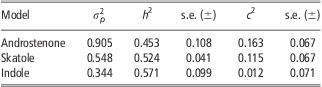
Univariate analysis of the data set resulted in heritability estimates for androstenone comparable to those in the literature (Table 3). Standard errors were generally high. Heritabilities for skatole and indole were higher than that of androstenone but still plausible.
Phenotypic variance ( $$$\sigma _{p}^{{\rm{2}}} $$$), heritability (h 2), litter (c 2) variance as a proportion of phenotypic variance and s.e. from univariate analyses of boar taint compounds
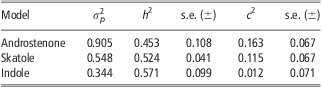
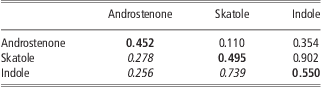
Multivariate analysis provided very similar results (Table 4). A strong genetic correlation between skatole and indole was observed, whereas the genetic correlation between androstenone and skatole was weaker. Interestingly, the genetic correlation between androstenone and indole was higher than that between androstenone and skatole.
Phenotypic (lower diagonal) and genotypic correlations (upper diagonal), and heritabilities (diagonal) from multivariate analysis
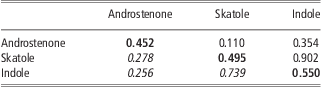
Standard error of heritabilities ranged from 0.066 to 0.079.
Discussion
Finishing intact boars can be an economically advantageous alternative to surgical castration (de Roest et al., Reference de Roest, Montanari, Fowler and Baltussen2009; Lundström et al., Reference Lundström, Matthews and Haugen2009). Because of the high heritability of boar taint compounds, breeding is an excellent tool to reduce the number of tainted carcasses. However, in order to incorporate boar taint into breeding programmes, standardized performance testing must be established. This study presents a repeatable performance test for use in live breeding candidates and is of direct practical relevance to breeding companies. Testing breeding candidates directly for boar taint components allows more accurate and more efficient breeding value estimation than by using information from progeny or slaughtered sibs.
The biopsy device
The use of a biopsy device for measurement of boar taint compounds was introduced by Lundström et al. in (Reference Lundström, Asp-Malmfors and Hansson1973). Since then, a number of research groups have used biopsy methods to measure boar taint compounds for experimental purposes (e.g. Bonneau, Reference Bonneau1987; Keller et al., Reference Keller, Wicke, von Lengerken and Kretzschmar1997; Sellier et al., Reference Sellier, Le Roy, Fouilloux, Gruand and Bonneau2000). Geverink et al. (Reference Geverink, Ruis, Eisen, Lambooij, Blokhuis and Wiegant1999) described behavioural and physiological responses of pigs (n = 10) biopsied (muscle tissue); 70% of the pigs vocalized when the biopsy was taken, and all pigs flinched in response to the biopsy in that study. In contrast, animals in our study showed very little pain response when biopsied. Our biopsy device had a slightly thinner needle than that used in the study by Geverink et al. (Reference Geverink, Ruis, Eisen, Lambooij, Blokhuis and Wiegant1999), which minimized the invasiveness of sampling. A further factor influencing pain is the strength of the compression spring, although this was not discussed. Because boar taint compounds are found in fat, biopsy cores for performance testing purposes should include adipose tissue. Animals tended to bleed slightly when the biopsy core contained muscle, because muscle tissue contains more blood vessels than does fat. Extraction of muscle tissue via biopsy could also be more painful, as the number of nerve endings in muscle tissue is higher than in adipose tissue. In a study on fat characteristics of pigs fed fish oil, Irie and Sakimoto (Reference Irie and Sakimoto1992) adjusted the length of the biopsy needle to the thickness of the backfat based on ultrasonic measurements to avoid reaching muscle tissue. This measure was not taken in our study for practical reasons. Instead, the biopsy device was held at a 35° angle to the body of the pig to ensure maximal fat and minimal muscle sampling.
Correlations with other traits
Androstenone is synthesized in the same pathway as many sex steroids (e.g. estrogens and testosterone), and breeding for decreased androstenone will have an effect on fertility. A single-generation selection experiment resulted in delayed puberty in gilts, but not in boars when animals exhibiting low levels of androstenone were selected (Sellier and Bonneau, Reference Sellier and Bonneau1988). Phenotypic correlations (0.13 to 0.71) between androstenone and the size or weight of various male genital tract measurements have been published (Sellier et al., Reference Sellier, Le Roy, Fouilloux, Gruand and Bonneau2000). Half of the genes in finishing pigs originate from dam lines, which commonly underlie strong selection for fertility. If boar taint is highly correlated with fertility traits in female lines, the genetic progress in reducing taint (or fertility, if the dam line is considered) will be difficult. The use of molecular methods may allow selection for specific genes that affect only androstenone metabolism without affecting other sex hormones. In a genome scan by Grindflek et al. (Reference Grindflek, Meuwissen, Aasmundstad, Hamland, Hansen, Nome, Kent, Torjesen and Lien2011), quantitative trait loci (QTL) affecting skatole and indole did not seem to affect any other traits examined; however, all significant QTLs affecting androstenone identified also affected other sex hormones with one exception.
Age and weight at slaughter/performance testing
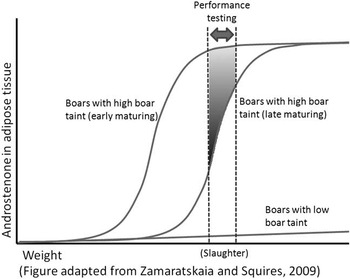
Many studies report a surge in boar taint at puberty (e.g. Willeke et al., Reference Willeke, Claus, Muller E Pirchner and Karg1987; Sellier and Bonneau, Reference Sellier and Bonneau1988). Zamaratskaia and Squires (Reference Zamaratskaia and Squires2009) distinguished between three types of boars: early maturing boars with high androstenone, late maturing boars with high androstenone and boars with low androstenone (Figure 2). Therefore, performance testing should be conducted only after late maturing boars differentiate from low-taint boars with regard to boar taint, which ensures that the trait being selected for is boar taint and not late maturity. On the other hand, testing breeding animals at the target slaughter weight of their offspring provides the closest phenotypic observation of the breeding goal. Because slaughter weights in Europe are relatively low (100 to 130 kg live weight), boar taint components in late maturing males may not have reached their peak at this weight (in our study, 12% of all observations exceeded the androstenone threshold at live weights between 100 and 130 kg). Therefore, a compromise is needed in which performance testing is conducted late enough to ensure that later maturing boars differentiate from low-taint boars but early enough to represent the target slaughter weight. A further advantage of early performance testing is that tested boars not selected for breeding can still be slaughtered without deductions for high weight.
Schematic representation of optimal weight range for performance testing.

A delay in sexual maturation in the usually small sire-line population must be expected when considering the long-term effects of breeding against androstenone. However, if included in a commercial breeding programme, androstenone is not likely to be heavily weighted. Furthermore, a delay in sexual maturation of finishing pigs is likely to have little consequence, because these animals are not used for breeding purposes. This issue is more critical if such breeding programmes are to be applied in dam lines. Nevertheless, further research on long-term effects of breeding against androstenone should be undertaken, including analysis of other relevant sex-related hormones.
Heritability and trait definition
Accurate and repeatable phenotypic measurements allow optimal breeding value estimation and help increase genetic gain. Heritabilities for human nose scores (HNS) of boar taint were considerably lower (0.12 to 0.19) than those calculated with biochemical compounds (h 2androstenone =0.54, h 2skatole = 0.40 to 0.41, h 2indole = 0.33; Windig et al., Reference Windig, Mulder, ten Napel, Knol, Mathur and Crump2012). Two common measures for evaluating sensory observations are repeatability (the ability of a panel to consistently score the attributes of a sample) and reproducibility (the average agreement of a single panelist with the rest of the panel; Rossi, Reference Rossi2001). Windig et al. (Reference Windig, Mulder, ten Napel, Knol, Mathur and Crump2012) found that repeatability of HNS was 0.29, which corresponds well with the results of Mathur et al. (Reference Mathur, ten Napel, Bloemhof, Heres, Knol and Mulder2012), who calculated reproducibility of HNS to be between 0.19 and 0.32. In contrast, the repeatability of biochemical analysis is close to unity, even across laboratories (Ampuero Kragten et al., Reference Ampuero Kragten, Verkuylen, Dahlman, Hortos, Garcia-Regueiro, Dahl, Andresen, Feitsma, Mathur and Harlizius2011). More importantly, HNS can only be recorded for carcasses – measurement in live breeding candidates is not possible. Phenotypic correlations between androstenone in fat and HNS are low to moderate (Aluwé et al., Reference Aluwé, Tuyttens, Bekaert, De Smet, De Brabander and Millet2012). Similarly, Windig et al. (Reference Windig, Mulder, ten Napel, Knol, Mathur and Crump2012) found phenotypic correlations between chemical boar taint compounds and HNS ranging between 0.27 and 0.36; genetic correlations ranged between 0.65 and 0.93 (Windig et al., Reference Windig, Mulder, ten Napel, Knol, Mathur and Crump2012). Therefore, by selecting animals with low biochemical boar taint compounds, HNS can be reduced as well.
Advantages of own performance testing
Genetic gain is dependent on the accuracy of estimated breeding values (EBVs). Until now, boar taint has been mainly measured in close relatives of selection candidates. For example, selection methods may be based on information from full sibs (i.e. measured in carcasses of full brothers of breeding candidates) or from large numbers of progeny. Although information on full sibs is attainable faster than that of progeny (i.e. immediately for full sibs v. 116 days gestation + 170 days rearing and finishing = 286 days for candidate progeny), this information source does not allow selection within the litter, because all full sibs have the same pedigree index. Furthermore, the full sibs tested are no longer available for breeding, although they may have been the better candidates. By measuring boar taint directly in the breeding candidates (own performance), early discrimination between members of the same litter and early identification of low-risk boars are possible. Moreover, all members of the litter are still available for breeding. Performance information is available immediately and the breeding organization does not have to wait until data on large numbers of progeny have been collected.
Selection index
The number of traits in the breeding goal must be chosen carefully, because increasing the number of traits decreases the amount of genetic progress per trait. With regard to boar taint, reducing the off-odour (HNS) of heated pork is the objective. EBVs for androstenone, skatole, indole or other compounds can be weighted accordingly to model individual contributions to the aggregate breeding objective (in this case, HNS). A method such as that presented by Schneeberger et al. (Reference Schneeberger, Barwick, Crow and Hammond1992) could be used to calculate appropriate weights for EBVs. Using this method, weights depend only on genetic variances and covariances among the individual boar taint components and the HNS, and on the economic values of these traits.
Conclusions
This study presents a quantitative performance test for use in live male breeding candidates and is of direct practical relevance to breeding companies. Heritabilities estimated on the basis of data from small tissue samples obtained by biopsy were comparable to values in the literature. Measurement of boar taint compounds in male breeding candidates (own performance) allows early identification of low-risk boars, because performance information is immediately available.
The biopsy device described could be used in future research to gain insight into the pubertal development of boars. Investigating the trend of individual boar taint components over time in live animals could help in understanding the relationships between puberty, age, weight and boar taint compounds. Future research should include further investigation of correlated effects on economically important traits, especially in dam lines.
Acknowledgements
The authors gratefully acknowledge the financial support of the Swiss Commission for Technology and Innovation (KTI).
Supplementary materials
For supplementary materials referred to in this article, please visit http://dx.doi.org/doi:10.1017/S1751731112002273