


Introduction
The Queen Elizabeth Islands (QEI) are an intricate series of islands and channels in the Canadian High Arctic. They are surrounded to the north and west by the year-round ice-covered Arctic Ocean, to the east and the southeast by Greenland and Baffin Bay and to the south by Parry Channel (Fig. 1).
Location map showing ice regimes (as defined by the first author). the northwest passage route is shown by the dashed line. the southern route, indicated by the arrow, continues south through peel sound and then along the mainland coast.

The mean surface pressure pattern over the Arctic indicates that Arctic Ocean multi-year ice is normally forced up against the northern and western sides of the QEI by the prevailing atmospheric circulation, even in summer (Reference Agnew, Le and ShokrAgnew and others, 1999), resulting in some of the thickest and oldest sea ice in the Arctic Ocean. The QEI coastlines are only periodically cleared of sea ice, unlike other coastlines facing the Arctic Ocean, which are ice-free for several months each summer.
During the summer, sea-ice retreat begins in the southern islands (south of Parry Channel) as warmer air masses invade the region from the south. Sea ice also retreats on the northeastern side of the islands, as the North Open Water expands southward from Smith Sound. However, even at the time of minimum sea-ice extent in late summer, many of the northern channels of the QEI remain covered with multi-year ice. For example, semi-permanent multi-year land-fast ice plugs have been identified in Nansen Sound and Sverdrup Channel (Fig. 1). The Nansen plug was first investigated by Reference SersonSerson (1972) and Reference Jeffries, Reynolds and MillerJeffries and others (1992). They determined that this persistent feature was neither ice-shelf ice nor a single homogeneous block of sea ice. Reference Jeffries, Reynolds and MillerJeffries and others (1992) suggested that it was instead "an agglomeration of ice of different ages and thicknesses", and it appears also to be subject to "rearrangement of its component floes". This matrix of ice is subject to local disintegration such as melt holes and stress cracks; however, except in summers of extreme weather, these multi-year ice plugs do not fracture and become truly mobile.
Sea-ice retreat over the western Arctic Ocean and the Canadian Arctic Islands, as caused by large-scale atmospheric changes, is discussed in Reference Maslanik, Serreze and AgnewMaslanik and others (1999). Recent work by Reference Parkinson, Cavalieri, Gloersen, Zwally and ComisoParkinson and others (1999) and Reference Rothrock, Yu and MaykutRothrock and others (1999) has looked at changing ice concentrations and thickness in the Arctic as a possible response of sea-ice conditions to global warming.
Several environmental factors made 1998 an extreme year in the QEI, including temperature, amount of melt of both first-year and multi-year sea ice, duration of the sea-ice melting period, and the fracture of multi-year ice plugs. The anomalous ice conditions in 1998 raised many interesting questions, foremost being whether the ice regime of 1998 could be used as a template for future conditions under a global warming scenario. A first step to answering this question is a detailed characterization of the 1998 ice regime in the QEI and an examination of the factors responsible for this very different ice year. Using a combination of operational and climatological methods, this paper examines the 1998 summer sea-ice regime of the QEI within the context of the ice-climate record and relevant environmental conditions.
General circulation models (GCMs) can play an important part in assessing the relevance of anomalous sea-ice years, like 1998, to future ice regimes. A detailed analysis of the sea-ice events of 1998 in the QEI may produce a specific condition or series of conditions, a fingerprint per se, to look for in model results or provide information useful in the improvement of GCMs. Operationally, this work may begin to shed light on the viability of the Northwest Passage (Fig. 1) as a commercial shipping route under future light-ice regimes. Past expeditions, such as Franklin’s in 1845−48 and Larsen’s in 1940−42, have shown the difficulty and sometimes tragedy of using this route.
Data and Methodology
The following section describes the data and methods used to examine the 1998 sea-ice regime in relation to the longterm climate record. In this paper, the term open water is defined as the total of all the areas with less than one-tenth sea and/or glacial ice ("open water" and "bergy water" as defined by MANICE (Canada, Environment Canada, 1994)). This includes large expanses of open water, as well as open water between ice floes in areas where more than one-tenth sea ice is present. The amount of open water is expressed as a percentage of the total channel area.
In order to effectively study the complex QEI ice region, the archipelago was divided into discrete ice regimes (Fig. 1), based on the operational knowledge of the first author. The ice in each regime behaves in a significantly different manner from that in the other regimes with respect to freeze-up and break-up patterns, ice age, and mobility or stability.
Monthly sea-ice area concentrations from passive microwave data for the period 1979−June 1999 (Fig. 2) were obtained from the NASA Goddard Space Flight Center (GSFC) through the U.S. National Snow and Ice Data Center (NSIDC). These data were extended from the original analysis carried out by Reference Parkinson, Cavalieri, Gloersen, Zwally and ComisoParkinson and others (1999), to include 1997 through June 1999. Techniques used for producing a consistent microwave dataset, and in particular correcting for coastal land spillover effects, are discussed in Reference Parkinson, Cavalieri, Gloersen, Zwally and ComisoCavalieri and others (1999). The QEI area covered by the passive-microwave evaluation includes regimes 1−13 and excludes the area east of the islands (Fig. 1). The time series of passive-microwave maximum open water was calculated from the monthly mean ice-area values for the month of minimum monthly ice area (Fig. 2).
Maximum open-water time series, 1979−98, adapted from Reference Parkinson, Cavalieri, Gloersen, Zwally and Comisoparkinson and others (1999) (pmw), and CIS digitized weekly sea-ice charts. areas 1−13 (fig 1).
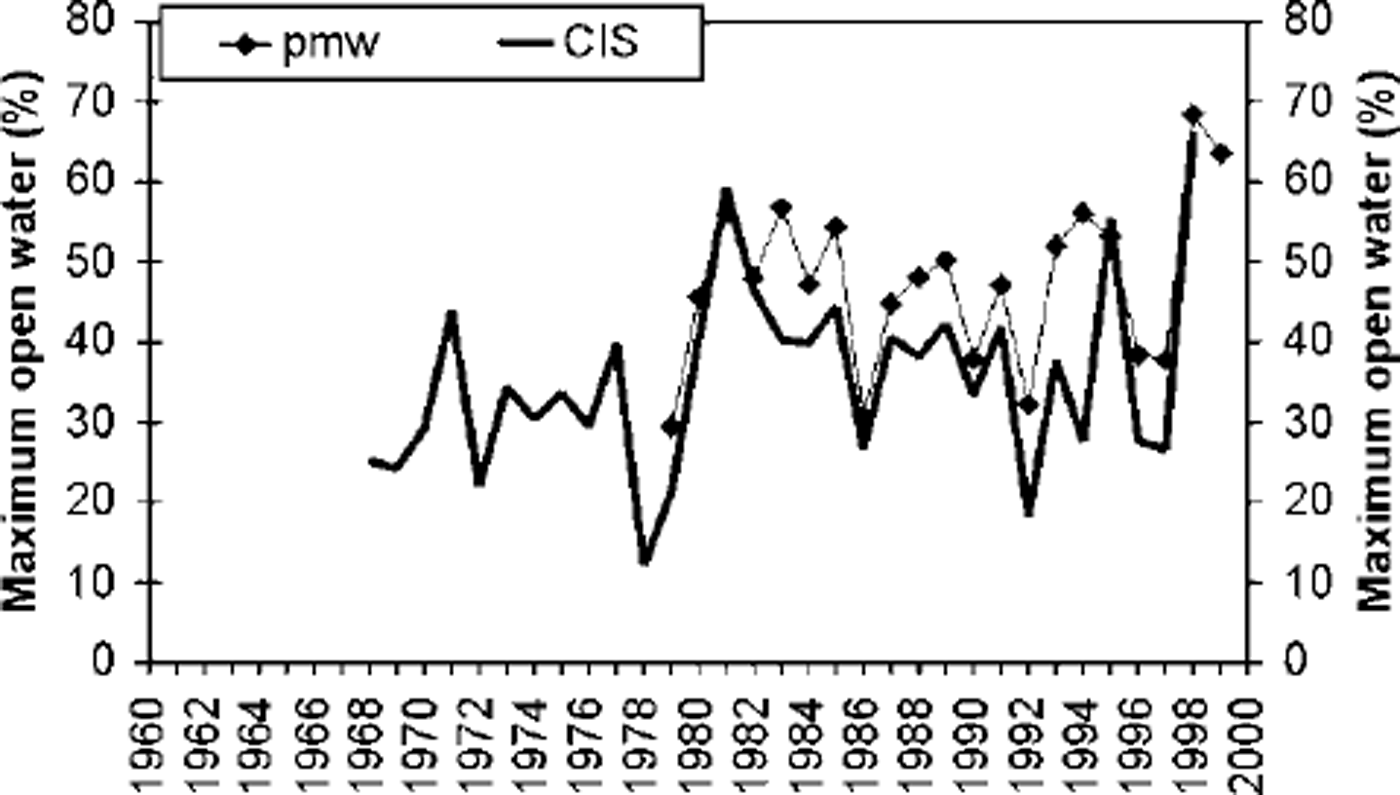
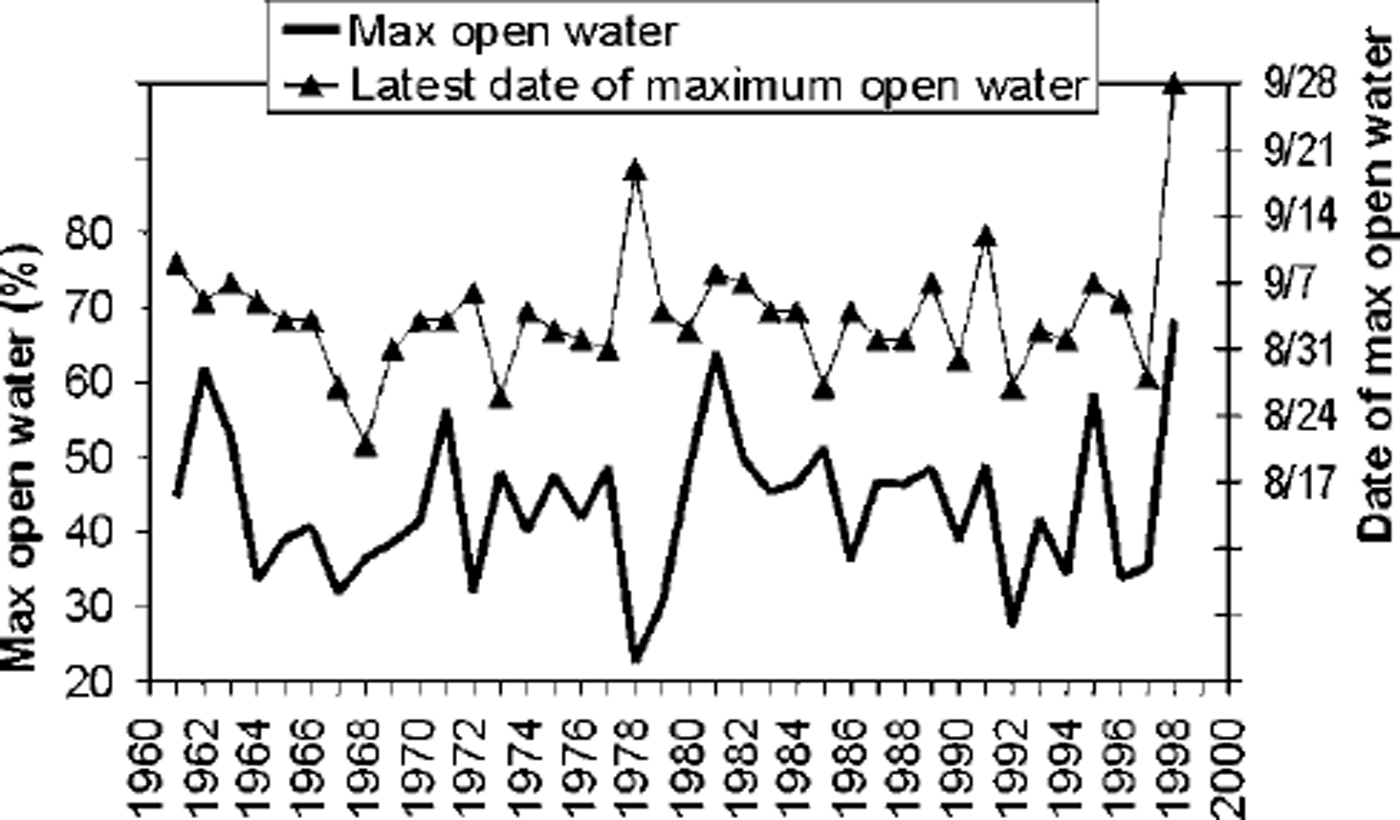
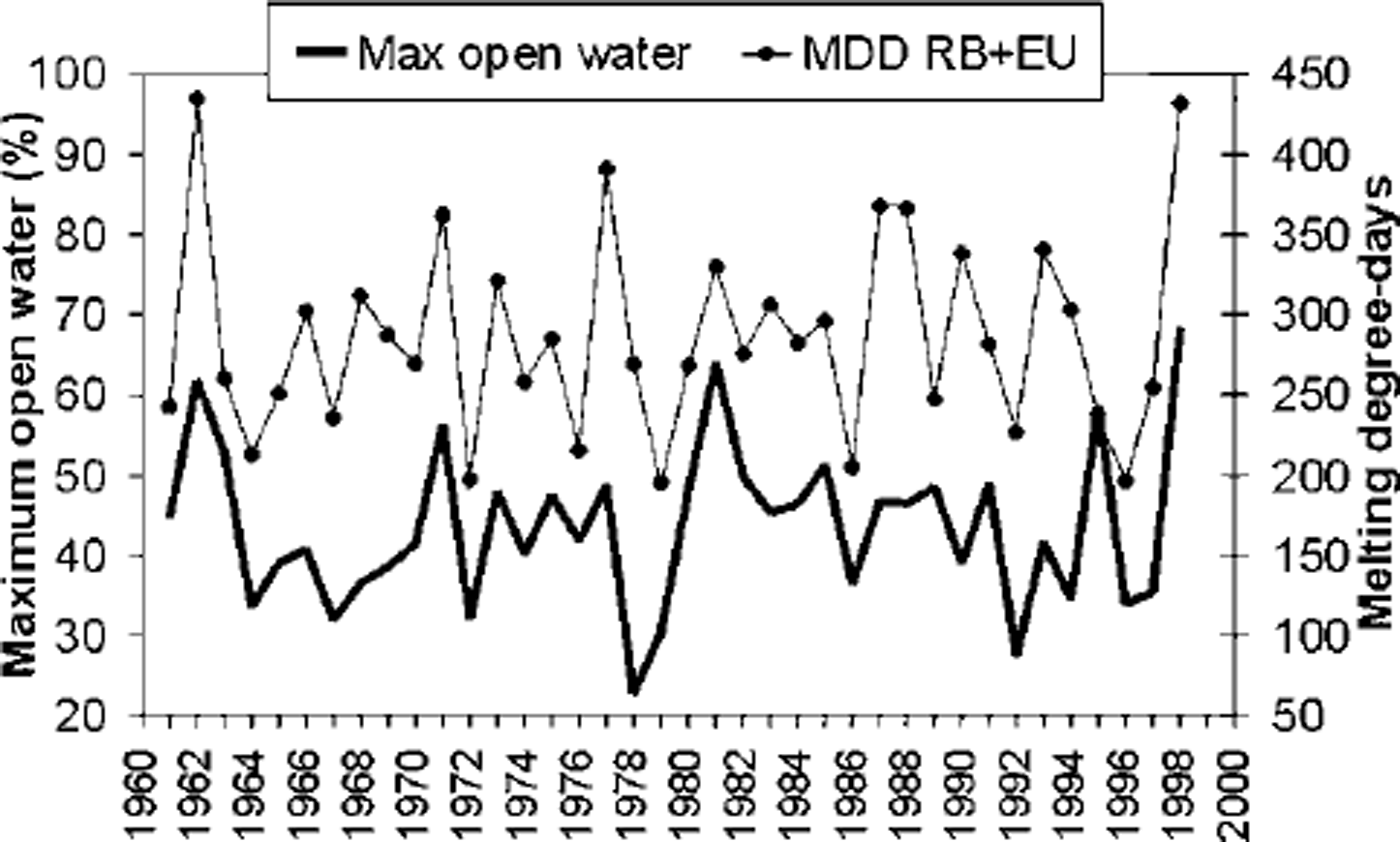
The extent of open water during the period of maximum open water was evaluated for the area covered by regimes 0−13. This is a modification of the area used by Reference KoernerKoerner (1977) in his earlier studies of the relationship between maximum open water and mass balance in the QEI. The Polar Continental Shelf Project (PCSP) sea-ice atlas (Reference LindsayLindsay, 1975, 1977, Reference Lindsay1981) was used for the evaluation in the earlier period (1961−78), while the Canadian Ice Service (CIS) digital database, based on weekly sea-ice charts, was used for the later period (1968−98). These time series have been consolidated into a 38 year time series of maximum open water for the total area of regimes 0−13 and are plotted along with the date of maximum open water (Fig. 3). A 31 year time series based on the CIS data for the total area of regimes 0−13 is shown in Figure 2. A passive-microwave time series for the same period is included for comparison. The estimated error in these time series is at least ± 8% based on analysis of potential error sources. The time series of average total melting degree-days for Resolute Bay and Eureka (Environment Canada data) are included as an indicator of annual summer warmth in the QEI (Fig. 4).
Time series, 1961−98, created from sea-ice charts generated by the cis and the PCSP. Top: latest annual date of maximum open water (dates are month/day). bottom: percentage of annual maximum open water. areas 0−13 (fig.1).
Time series, 1961−98. Top: average melting degree-days (MDD) for resolute bay (rb) and eureka (eu), (environment canada data). bottom: annual maximum open-water percentage from sea-ice charts generated by the cis and the pcsp. areas 0−13 (fig 1).
After the 1998 ice year was placed in proper context, the break-up, melt and freeze-up patterns in the QEI for that year were examined in detail. A chronology of ice events in each regime was constructed for 1998, and significant events identified. Only areas 3 and 4, which contain the ice plugs, are discussed in any detail in this paper. To minimize analyst bias, these events were determined only from ice data, independent of weather records. The data for ice chronology came from CIS Regional Ice Analysis Charts and RADARSAT ScanSAR Wide (SCW) imagery archived at CIS. Important ice events in 1998 were identified and checked against normal conditions using the CIS 30 year digital sea-ice database, consisting of digitized polygon data for the period 1968−98. The data, which include the sea-ice variables of concentration, age, thickness and floe size, were originally derived from the digitization of CIS Regional Ice Analysis charts. Data sources for the analysis charts, which vary over the 31 year period, include visual aerial reconnaissance from fixed-wing aircraft and helicopters; Advanced Very High Resolution Radiometer (AVHRR) and Operational Line Scanner (OLS) satellite imagery; fixed-wing-based Side Looking Airborne Radar (SLAR); fixed-wing- and satellite-based synthetic aperture radar (SAR); ship reports; and shore reports.
Results and Discussion
The maximum open-water time series (Fig. 3) shows an extreme maximum in 1998. Also, the date of the 1998 maximum open water, 28 September (Fig. 3), was the latest in the 38 year record. The summers of 1962 and 1981 appear as two other extreme maximum open-water years in this record. No significant trend is apparent in the 38 year record of sea-ice extent. There is good agreement between the passive-microwave and CIS/PCSP chart-based time series in the extreme years, in particular 1981 and 1998 (Fig. 2). The consistency between these two datasets helps establish the relationship between events in the QEI and events in the Arctic basin (Reference Agnew, Le and ShokrAgnew and others, 1999). As shown in the total melting degree-day record (Fig. 4), both 1962 and 1998 experienced very warm summers. However, 1981, which was a light ice year, was not extreme in terms of total seasonal melting degree-days, suggesting that the relationship between summer air temperatures and ice extent is not straightforward.
The departure of 1998 sea-ice concentrations from the historical norm is readily apparent from a comparison of Figures 5 and 6. The 1998 ice regime in the QEI is characterized by a dramatically larger expanse of less than one-tenth sea ice (open water). Large areas of relatively light ice conditions allow for more ice movement and melt, since sea ice decays best when it is dispersed. This can lead to further increases in open-water area due to positive feedbacks. As sea ice disperses and areal concentration decreases, the overall surface albedo decreases due to the increased presence of open water. This in turn leads to increased absorption of solar radiation in the upper water layers, thus increasing the melt rate of floating ice and further decreasing ice concentration. Also, lower concentration results in exposed floe edges. This furthers sea-ice ablation/decay due to dynamic effects of waves, other ice floes and/or the interaction with warmer ocean water.
Thirty-year (1969−98) median sea-ice concentration for 24 september. (CIS data.)

Total sea-ice concentration for 28 september 1998 (CIS data.)

Another important characteristic of 1998 is that both the Nansen Sound and Sverdrup Channel multi-year fast-ice plugs fractured, became mobile and experienced considerable melt. The only other year this occurred in both areas was 1962 (1961−99 record). It has not been possible to determine exactly why these were the only two years where both the plugs fractured, although the warmer summers, indicated by the temperature record, were likely a contributing factor. A description of the events leading to this joint fracture is provided in the following.
In 1998, Eureka Sound and Norwegian Bay fractured within a week of each other, between 22 and 29 June. By 17 August, there was open water or very open drift ice south of the plugs in both Eureka Sound and Norwegian Bay. As can be seen from Figure 7a and b, the temperature was above normal at both Eureka and Resolute Bay for most of 1998 prior to 17 August. This resulted in much lighter than normal sea-ice concentrations south of the plugs and likely accelerated decay of the plugs themselves. While the mechanism responsible for fracturing the plugs in 1998 is unknown, it is hypothesized that the weakening of the plugs through the warmer summer temperatures left them more susceptible to mechanical forcing, such as from wind and waves. The absence of ice to the south of the plugs exposed them to incident ocean waves, which likely increased the strain on the plugs, hastening fracture and dispersal. A low-pressure system, moving through the QEI between 17 and 20 August, may have provided enough force (wind, wave) to fracture the Sverdrup Channel plug and to cause most of the Nansen Sound plug to break off in one large piece. The wind-direction data, recorded at Resolute and Eureka, capture the reversal of the wind to southerly and back to northerly with the passage of this storm (Fig. 7a). Storm surge associated with this weather system and tides could also have been a factor in the break-up of the plugs.
(a) Maximum and minimum daily temperature for june-october 1998, for resolute bay (rb) and eureka (eu). wind index shows winds from the north sector plotted as positive, and winds from the south sector plotted as negative. (b) same as (a) except for 1962.

When these two plugs fractured, the large amount of (open) water to the south allowed the fractured ice to drift southward and subsequently melt. All of Sverdrup Channel had fractured, so there was a continual supply of Arctic Ocean ice keeping Sverdrup Channel filled with mobile, multi-year ice. Even with Arctic Ocean ice pushing southward, the open-water limit moved steadily northward in Sverdrup Channel. This presumably occurred because of the extreme warm-air temperatures that had caused a similar increase in sea-surface temperature. In Nansen Sound, a small, 10−nautical-mile-wide piece of the plug remained at the Arctic Ocean boundary, preventing the entrance of any Arctic Ocean ice into the Sound. A large piece of the plug that broke off in the week of 17−24 August drifted southward, and melted within the next 2 weeks.
The sequence of occurrence of the various environmental factors in 1998 is significant. Although warmer temperatures (Fig. 7a) conditioned the plugs to be more susceptible to fracture, another forcing factor was needed to break up the ice and disperse it. There was also warming well into the fall (Fig. 7a), which allowed the open water to continue to move northward into Sverdrup Channel and contribute to the removal and melt of the last piece of the Nansen Plug.
To further understand the ice conditions in summer 1998, the extreme light-sea-ice summer of 1962 was also analyzed. The sequences of events leading to fracture of the plugs were very similar when comparing 1962 to 1998, as reflected in the temperature record (Fig. 7a and b) for 1962 and 1998, up to the end of August. The main difference was the amount of melt that took place in the area of the fractured plugs, melt being significantly greater in 1998 than in 1962 (not shown). This is likely related to the divergence of the September temperature in 1962 and 1998 (Fig. 7a and b).
In 1998, new ice growth began in areas 3 and 4 (Fig. 1) between 31 August and 7 September. Between 22 and 24 September a low-pressure system again moved through the region, bringing warmer temperatures and stronger winds from the south (Fig. 7a). This broke the last piece of the Nansen Sound plug and melted the new ice that had formed. It is also this second influx of warm air that extended the melt season 3−4 weeks beyond normal and caused the additional melt (increased open water) shown in Figure 8 for the plug areas in particular. This late-season warming is what most distinguishes 1998 from the light-ice year of 1962. The warm-season extension in 1998 is particularly interesting in light of the results of Reference Zhang, Vincent, Hogg and NiitsooZhang and others (2000), which show a warming trend for the fall season across the whole QEI in both daily maximum and daily minimum temperatures for the period 1950−98 (while in the other seasons the trends are less consistent).
Difference between the percentage of open water present on 7 september and 24 september 1998. positive values indicate more open water on 28 september. negative values indicate less open water present on 28 september.

Warmer Arctic seasons are expected to increase the amount of open water, thus possibly making the channels of the QEI more navigable. Based on analogs developed using ice-core records from Devon Ice Gap, estimates can be made of the maximum open-water conditions for the seasons of various historical attempts to navigate the Northwest Passage (Reference Alt, Koerner, Fisher, Bourgeois and SutherlandAlt and others, 1985): when Franklin attempted the Northwest Passage in 1846−48 there would have been 30−40% less open water than in 1998, while Larsen, in 1940−42, would have encountered 25−30% less open water. Thus, upon historical reflection, conditions similar to those in 1998 do appear to suggest improved conditions for navigation. However, this study showed that the removal of the plugs in 1998 allowed the southward movement of previously restrained heavy, old ice into the islands, in this case via Sverdrup Channel. A potential future scenario is that annual fracturing or absence of High Arctic plugs and absence of first-year ice in the QEI may result in an influx of multi-year ice into the islands and thus actually decrease the amount of navigable water.
Conclusions
Several datasets of sea-ice conditions in the Canadian Arctic Islands have been analyzed to show that summer 1998 had record maximum open water. In 1998 both the Nansen and Sverdrup multi-year ice plugs fractured, became mobile and underwent significant melt. The only other time that these two events occurred during the same season in the 38 year record was summer 1962. Although the two years are similar in many respects, the presence of an enhanced warming period in September distinguished 1998 from the 1962.
Detailed examination of the weather record for 1998 shows that retreat of the sea ice in the QEI occurred through a process of strong thermal preconditioning (which weakens the sea ice) interspersed with storm events. Several such storm events occurred in 1998 in the High Arctic islands. It is likely that other environmental factors, such as tides, current, storm surge, wave activity and precipitation, also helped shape this anomalous ice regime. Their roles have yet to be studied and form the foci of future work.
It could be postulated that several successive years like 1998 would completely clear the Northwest Passage of first-year ice. However, this study has shown that if the Sverdrup plug and the normally land-fast ice along the northwest edge of the QEI were to fracture in future warm years, a steady supply of multi-year pack ice could enter the passage from the northern QEI and may present a major hazard to shipping. This study has highlighted the need to understand more fully the roles of these ice plugs both in defining the current ice conditions along the northwest edge of the QEI and as indicators of long-term change in the ice regimes of the Arctic Archipelago under different climate scenarios.



