I. INTRODUCTION
Various types of diseases and injuries can lead to tissue damage, loss of organ function, fractures, and disfigurations. The treatment for these types of problems demands biomaterials that promote recovery of proper function in various regions of the body. The use of polyurethanes as biomaterials has increased due to their excellent mechanical properties and biocompatibility.Reference Nabid and Omrani1 For this reason, multiple biomedical devices are designed starting from polyurethanes of various origins according to the requirements of each application.Reference Rocco, Maxfield, Best, Dean and Breuer2 Nevertheless, biomaterials that combine the properties of polyurethanes with new features deserve more attention, as these materials could further enable the treatment of different physical disorders.Reference Gómez3
In recent years, the incorporation of fillers into polymeric matrices has been explored, and the results show improvements in the properties of the materials and even yielding materials with completely new properties.Reference Patel, Biswas, Maiti, Cooper and Guan4 In particular, the use of cellulose as the reinforcing material in polymer matrices is an emerging field of study. For instance, adding cellulose nanofibers extracted from pineapple leaves to a polyurethane matrix made of di-p-phenyl-diisocyanate, polycaprolactone diol (M n = 530g/mol), and 1,4-butanediol significantly improved the properties of the material. The composite showed an increase in Young’s modulus (E′) and tensile strength (σ) of 2600% and 300%, respectively, after the addition of 5% nanofibers.Reference Cherian, Leão, De Souza, Costa, De Olyveira, Kottaisamy, Nagarajan and Thomas5 The material withstood 12 years of cyclic use in accelerated fatigue tests and in vivo implantation in rats. Besides, this material is suitable for use in cardiac valves and vascular implants because it maintains good hemodynamic properties.
Indeed, there are several characteristics that make cellulose an interesting reinforcing material, such as its high modulus of elasticity, low density (≈1.6 g/cm3), low cost, and the opportunity to incorporate a renewable carbon source, in particular, in the production of polyurethanes.Reference Fang, Arola, Malho, Kontturi, Linder and Laaksonen6 Introducing vegetable oils in the synthesis of polyurethanes is another approach to produce environmentally friendly materials, as polyols derived from vegetable oils can replace those from fossil sources.Reference Alagi, Choi, Seog and Hong7 Among the many vegetable oils that can be used to synthesize polyurethanes, castor oil is the most attractive, as it is the only natural oil polyol produced directly by nature.Reference Gurunathan, Mohanty and Nayak8 Approximately 90% of castor oil fatty acids is ricinoleic acid, which has a hydroxyl functionality at the carbon-12 positionReference Omonov, Kharraz and Curtis9; therefore, no chemical transformation is necessary for its incorporation in polyurethane production.
Some authors have researched the use of cellulose in the form of either micro- or nanocrystals as the reinforcing material in castor oil-based polyurethane matrices using different types of diisocyanates. In sum, these studies have found that cellulose affects the thermal and mechanical properties by increasing thermal stability and E′, while diminishing elongation at break (ε%). However, a significant difference in these studies regards the tensile strength of the materials: while the composites synthesized with microcrystalline cellulose showed a decrease in tensile strength,Reference Oprea, Potolinca, Gradinariu, Joga and Oprea10 those that integrated nanocrystals obtained by acid hydrolysis showed an increase.Reference Saralegi, Gonzalez, Valea, Eceiza and Corcuera11–Reference Wik, Aranguren and Mosiewicki14 Regarding the composition of the materials, most of them presented optimum behavior with cellulose loads of approximately 1–2 wt%, whereas higher amounts of filler lead to aggregation. A catalyst was used only in one of the aforementioned studies for the synthesis: dibutyltin dilaurate (DBTDL), which provided the greatest improvement in the mechanical properties with an increase in σ of 125% and a small decrease in ε% of 2.9%.Reference Gao, Peng, Zhong, Sun, Wang and Yue13
Of the various catalysts used in polyurethane synthesis, DBTDL is the most efficient, along with iron acetylacetonate.Reference Ryszkowska, Bil, Woźniak, Lewandowska-Szumieł and Kurzydłowski15 Nevertheless, most of the commonly used catalysts in the synthesis of urethanes are known to be toxic, which is the case for DBTDLReference Tanzi, Verderio, Lampugnani, Resnati, Dejana and Sturani16; hence, it may negatively affect the biocompatibility of polyurethanes. Some authors have though proposed different purification methods to overcome this inconvenience.Reference Lundin, Daniels, Mcgann, Stanbro, Watters, Stockelman and Wynne17–Reference Rudnik, Resiak and Wojciechowski19
Besides, harmful particles leaching from the matrix and possible enzymatic degradation products may also diminish the biocompatibility of the materials during use in biomedical field.Reference Luong, Sinh, Minna, Jürgen, Torsten, Matthias and Jukka20 However, none of the aforementioned studies evaluating the use of cellulose in castor oil-based polyurethanes report any cytotoxicity testing. As stated, the cited studies show that cellulose is a promising reinforcing material for obtaining stable and biocompatible materials, which could be of tremendous value to the biomedical industry. Nevertheless, they focus on improvements in the properties of the composites and overlook the evaluation of their biological responses. The purpose of this study is thus to assess the role of filler particle size and the use of an organotin catalyst on the physicochemical and biological properties of materials synthesized from cellulose crystals, castor oil (from Ricinus communis), and isophorone diisocyanate. The requirement of a rinsing protocol after synthesis to eliminate eventual unreacted raw materials and catalyst traces and subsequently diminish the risk of releasing harmful particles is also ascertained.
II. MATERIALS AND METHODS
A. Materials preparation
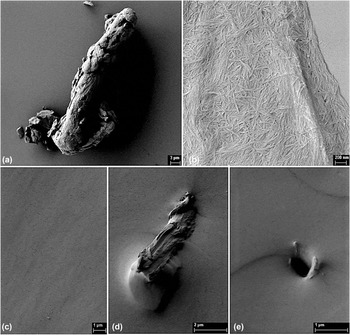
Cellulose nanocrystals (CNCs) were obtained by acid hydrolysis of microcrystalline cellulose (MCC; Sigma-Aldrich, Saint Louis, Missouri). MCC with an average size of 20 μm [Fig. 1(a)] was mixed with deionized water and sulfuric acid (H2SO4; Scharlau, Barcelona, Spain), achieving a final acid concentration of 64% v/v and maintaining a ratio of cellulose to acid medium of 1:10 w/v. Following the methodology proposed in Ref. Reference Bondeson, Mathew and Oksman21, the reaction was performed at 44 °C for 2 h, after which distilled water was added to quadruple the volume. The suspension was then rinsed with deionized water by means of repeated centrifuge cycles at 5000 rpm for 4 min. As the supernatant became turbid, the washing process was stopped, the supernatant discarded, and the precipitate neutralized by adding 0.2 M sodium hydroxide (NaOH; Scharlau, Barcelona, Spain). The nanocrystals in the aqueous phase were washed with acetone for three days following the protocol reported in Ref. Reference Capadona, Van Den Berg, Capadona, Schroeter, Rowan, Tyler and Weder22 with slight modifications, i.e., the solvent was changed twice per day by adding a volume of acetone equal to the initial volume of the aqueous dispersion of the nanocrystals, and the organic phase was stirred regularly to facilitate the solvent change. CNC-acetone gels with nanocrystal concentrations between 11 and 15% were obtained.
SEM images of (a) MCC- 1.2 K X, (b) CNCs- 20.0 K X, and freeze-fracture surfaces under liquid nitrogen of (c) COPU/Cat.- 4.5 K X, (d) COPU/MCC/Cat.- 6.0 K X, and (e) COPU/CNC/Cat.- 12.0 K X.

Castor oil (CO; Ciacomeq S.A.S., Bogotá, Colombia) with a hydroxyl number of 160 mg KOH/g and isophorone diisocyanate (IPDI; Alfa Aesar, Tewksbury, Massachusetts) were used as-purchased. Samples of neat castor-oil-based polyurethane (COPU) and with 2 wt% MCC and CNC (COPU/MCC and COPU/CNC) were synthesized. Another set of samples was synthesized using DBTDL (Alfa Aesar, Ward Hill, Massachusetts) as the catalyst to accelerate curing times (COPU/Cat., COPU/MCC/Cat. and COPU/CNC/Cat.). Composites were synthesized via in situ polymerization. For the CNC composite sample synthesis, CO was mixed with CNC-acetone gels. To avoid agglomeration, the mixture was blended in a VCX-750 ultrasonic processor (Sonics, Newtown, Connecticut) at 80% amplitude for 6 min. Acetone was removed by evaporation under reduced pressure, and the mixture was sonicated for additional 4 min and then heated to 60 °C. When the set temperature was reached, IPDI was added; the mixture was stirred for additional 5 min and vacuumed to remove bubbles. The amount of IPDI added was calculated so as to maintain a [NCO]/[OH] ratio of 1, including only the hydroxyl groups present in CO. For the materials synthesized without acetone gel, the reduced pressure evaporation process was omitted, and sonication was applied for 10 min before adding IPDI to the CO/MCC mixture. For the samples synthesized with catalyst, DBTDL (68 μL) was added and stirred for 2 min after bubbles were removed. Finally, the samples were poured into steel molds and cured at 105 °C for 12 h.
Three films of each composition, weighing between 250 and 300 mg, were rinsed with tetrahydrofuran (THF; Scharlau, Barcelona, Spain) for 1 day. The solvent was progressively changed to ethanol (Scharlau, Barcelona Spain) in a four-step process. The samples were then rinsed in pure ethanol for 12 and 24 h after the first solvent change. Following the fourth day, ethanol was changed to deionized water for an additional day. The samples were next dried under vacuum at 50 °C until constant weight. A Mettler AX 205 balance (Mettler-Toledo Inc., Columbus, Ohio) with a sensitivity of 0.01 mg was used to weigh samples before and after rinsing to measure any mass loss. Three parallel samples for each material type were used.
B. Morphological and physicochemical characterization
Particle size determination for the cellulose crystals was performed on an AURIGA Compact field-emission SEM (Zeiss, Jena, Germany) operating at an accelerating voltage of 2 kV and a working distance of 4 mm. Water suspensions of cellulose were dried on glass sample holders and coated with platinum before observation. The analysis of the micrographs was performed using ImageJ software (U. S. National Institutes of Health, Bethesda, Maryland). Images of freeze-fractured polyurethane samples were also taken.
Fourier transform infrared spectra of the samples were collected using a Bruker PLATINUM ATR (Billerica, Massachusetts) infrared spectrometer to reveal differences in the chemical interactions of hard segments (HS) and soft segments (SS) in the neat polyurethane and its composites. The spectra were measured from 400 to 4000 cm−1 at 4 cm−1 resolution.
The aforementioned balance, equipped with a Mettler ME 33360 density accessory kit, was used to determine the density through Archimedes’ principle by immersion in n-octane (reagent grade 98%; Aldrich, Saint Louis, Missouri; ρn-octane = 0.703 g/mL). Dry samples were weighed in air (m in air) and immersed in n-octane (m in n-octane) at room temperature. The density, ρ, was calculated as the ratio of m in air to the volume of n-octane displaced (V displaced):
 $$\rho = {{{m_{{\rm{in}}\;{\rm{air}}}}} \over {{V_{{\rm{displaced}}}}}} = {{{m_{{\rm{in}}\;{\rm{air}}}}} \over {{{\left( {{m_{{\rm{in}}\;{\rm{air}}}} - {m_{{\rm{in}}\;n{\rm{ ‐ octane}}}}} \right)} / {{\rho _{n{\rm{ ‐ octane}}}}}}}}\quad .$$
Each sample was weighed three times. Potential swelling of the samples due to immersion in n-octane was analyzed before the measurements (data not shown) and considered negligible.
Swelling in water was determined by weighing pieces with dimensions of 5 × 5 × 3 mm (length, width, thickness) of the samples immersed in distilled water at 37 °C. Measurements were done in triplicate at 24, 48, and 144 h. The percentages of swelling (swellingwater) of each sample were calculated as the ratio between the water absorbed by the sample (m water) and the initial mass of the dry sample:
 $${\rm{Swellin}}{{\rm{g}}_{{\rm{water}}}} = {{{m_{{\rm{water}}}}} \over {{m_{{\rm{dry}}\;{\rm{sample}}}}}} = {{\left( {{m_{{\rm{wet}}\;{\rm{sample}}}} - {m_{{\rm{dry}}\;{\rm{sample}}}}} \right)} \over {{m_{{\rm{dry}}\;{\rm{sample}}}}}} \times 100%\quad ,$$
where m dry sample and m wet sample are the weights of the sample before and after immersion in water, respectively.
The water contact angles (WCAs) were measured by optical contact angle measurements and drop shape analyses using an OCA20 device by Data Physics (Filderstadt, Germany). Four 5 μL drops were placed on the surfaces of dry samples in the sessile drop mode. The WCA reported for each sample is the average of the measurements from the right and left sides for each drop.
C. Thermal analysis
The thermal stability of the samples was assessed in a Mettler Toledo TGA/DSC 2 device (Columbus, Ohio). Approximately 7 mg of sample were heated from 30 to 600 °C at a heating rate of 10 °C/min under nitrogen atmosphere.
DSC scans were taken using a PerkinElmer DSC 8000 (Waltham, Massachusetts) to correlate the compositions and thermal properties of the samples. Specimens of approximately 5 mg of each sample were cooled to −80 °C, stabilized for 1 min, and next heated to 200 °C at 20 °C/min in a sealed aluminum pan under nitrogen atmosphere.
D. Mechanical tests
The elastic moduli, E′, and deformation percentage, ε%, were evaluated using an EZ-LX (Shimadzu Tokyo, Japan) universal testing machine with a load cell of 5 kN and a frame displacement speed of 10 mm/min. Four specimens of each sample with dimensions of 40 × 6 × 3 mm (length, width, thickness) were used for these tests.
E. Hydrolytic and enzymatic degradation assays
Hydrolytic and enzymatic degradation assays were performed in parallel to investigate the stability of the samples in aqueous media. Specimens between 150 and 200 mg with dimensions of 7 × 7 × 3 mm (length, width, thickness) were used. Each one was immersed in 1.5 mL of medium. Hydrolytic degradation was performed in phosphate buffered saline (PBS) for 3 months at 37 °C.
Enzymatic degradation was induced with esterase from porcine liver (Sigma-Aldrich) in PBS at 37 °C for 21 days. The samples were immersed in 1.5 mL of enzyme solution (10 units/mL) and removed for analysis every seven days. To preserve enzymatic activity, the degradation medium was changed every 48 h. Four replicates were used for each data point. Poly(ε-caprolactone) (PCL) was used as a reference material for the enzymatic degradation assays and the samples immersed in PBS with no enzyme served as negative controls.
F. In vitro calcification assay
Golomb and Wagner solution was used to simulate in vitro calcification conditions. The solution consisted of 3.87 mmol of calcium chloride (CaCl2), 2.32 mmol of dipotassium phosphate (K2PHO4), and 0.05 mol of Tris buffer in 1 L of water. The samples were in contact with the calcification medium for 4 weeks, with weekly solution changes as described in Ref. Reference Boloori Zadeh, Corbett and Nayeb-Hashemi23. The presence of calcium deposits on the sample surfaces was assessed using the aforementioned FE-SEM. Energy dispersive X-ray spectroscopy (EDS) was conducted to determine the relative amounts of calcium and phosphorus on the samples, which were previously coated with carbon for these analyses. Titanium was used as the optimization standard.
G. Cell viability assay
In vitro cell viability was evaluated using L929 fibroblasts (mouse C3H/An connective tissue; Sigma-Aldrich) in direct contact with the samples. Cubic samples of the materials were exposed to UV radiation for 20 min on each side to minimize the bacterial load of the material. Specimens with dimensions of 7 × 7 × 3 mm (length, width, thickness) were used. Cells were precultured for 24 h at 37 °C and 5% CO2 in a 96-well plate (10,000 cells per well) with Dulbecco’s Modified Eagle’s Medium (DMEM, Fisher, Pittsburgh, Pennsylvania) supplemented with 10% fetal bovine serum (FBS; Innoprot Bizkaia, Spain) and 1% penicillin-streptomycin (P/S; Innoprot Bizkaia, Spain). Subsequently, the specimens were introduced and left in contact with the cells for 24 h under the same preculture conditions.
For cell viability quantification, the medium was removed and 100 μL of 3-(4,5-dimethylthiazol-2-yl)-2,5-diphenyltetrazolium bromide (MTT; 10% in DMEM without phenol red) were added to each well. After 2 h of incubation, the supernatant was discarded, and isopropanol was added to break cell membranes and allow the formazan salts to solubilize for 10 min. Optical density measurements were performed with a PerkinElmer VICTORReference Gómez3 (Waltham, Massachusetts) plate reader at a wavelength of 570 nm. All tests were performed in quadruplicate, and wells cultured without samples and with latex served as positive and negative controls, respectively. The percentage of cell proliferation was calculated using the following equation:
 $${\rm{Cell}}\;{\rm{viability}} = {{{\rm{O}}{{\rm{D}}_{{\rm{Sample}}}} - {\rm{O}}{{\rm{D}}_{{\rm{Blank}}}}} \over {{\rm{O}}{{\rm{D}}_{{\rm{Positive}}\;{\rm{control}}}} - {\rm{O}}{{\rm{D}}_{{\rm{Blank}}}}}} \times 100\% \quad .$$
H. Statistical analysis
The results were analyzed using analysis of variance (ANOVA), and the criterion for significant differences was set to be α < 0.05. The least significant difference (LSD) post hoc test (confidence degree of 0.95) was selected for the multiple mean comparison. For the enzymatic degradation assay, comparisons of the means were performed using the Student’s t-test. Data were processed with the STATGRAPHICS® Centurion XVII professional package (Statgraphics Technologies, Inc., Warrenton, Virginia). Experiments were conducted using at least three independent replicates. The results are reported as mean ± standard deviation (SD).
III. RESULTS AND DISCUSSION
A. Composite morphologies and physicochemical structures
The SEM images of purchased MCC and CNC obtained by acid hydrolysis are shown in Figs. 1(a) and 1(b), respectively. CNC particles were highly aggregated and had a needle-like morphology with an average length of 294 ± 72 nm, a diameter of 29.3 ± 2.8 nm, and an aspect ratio (L/D) of 10. A high aspect ratio reduces the critical volume fraction that is necessary to form a percolated network of reinforcing material, which enhances mechanical strength and modulus.Reference Habibi, Dufresne and Sattler24 Figures 1(c)–1(e) show SEM images of the surfaces of COPU/Cat. and composite specimens that were freeze-fractured under liquid nitrogen. The surface of the neat polyurethane was homogeneous, indicating a proper interpenetration of the phases.Reference Dave and Patel25 In the MCC composites, occasional particles of cellulose trapped in the polymer matrix were observed, whereas the remainder of the surface appeared to be as homogeneous as neat polyurethane. Conversely, the CNC composite surface looked deflected and uneven, which could indicate a different energy dissipating mechanism within the matrix and the CNC.Reference Wik, Aranguren and Mosiewicki14 The roughness appeared to be uniform on the surface of the material, indicating a regular distribution of the reinforcement material within the polyurethane matrix. Materials synthesized without catalyst showed analogous behavior.
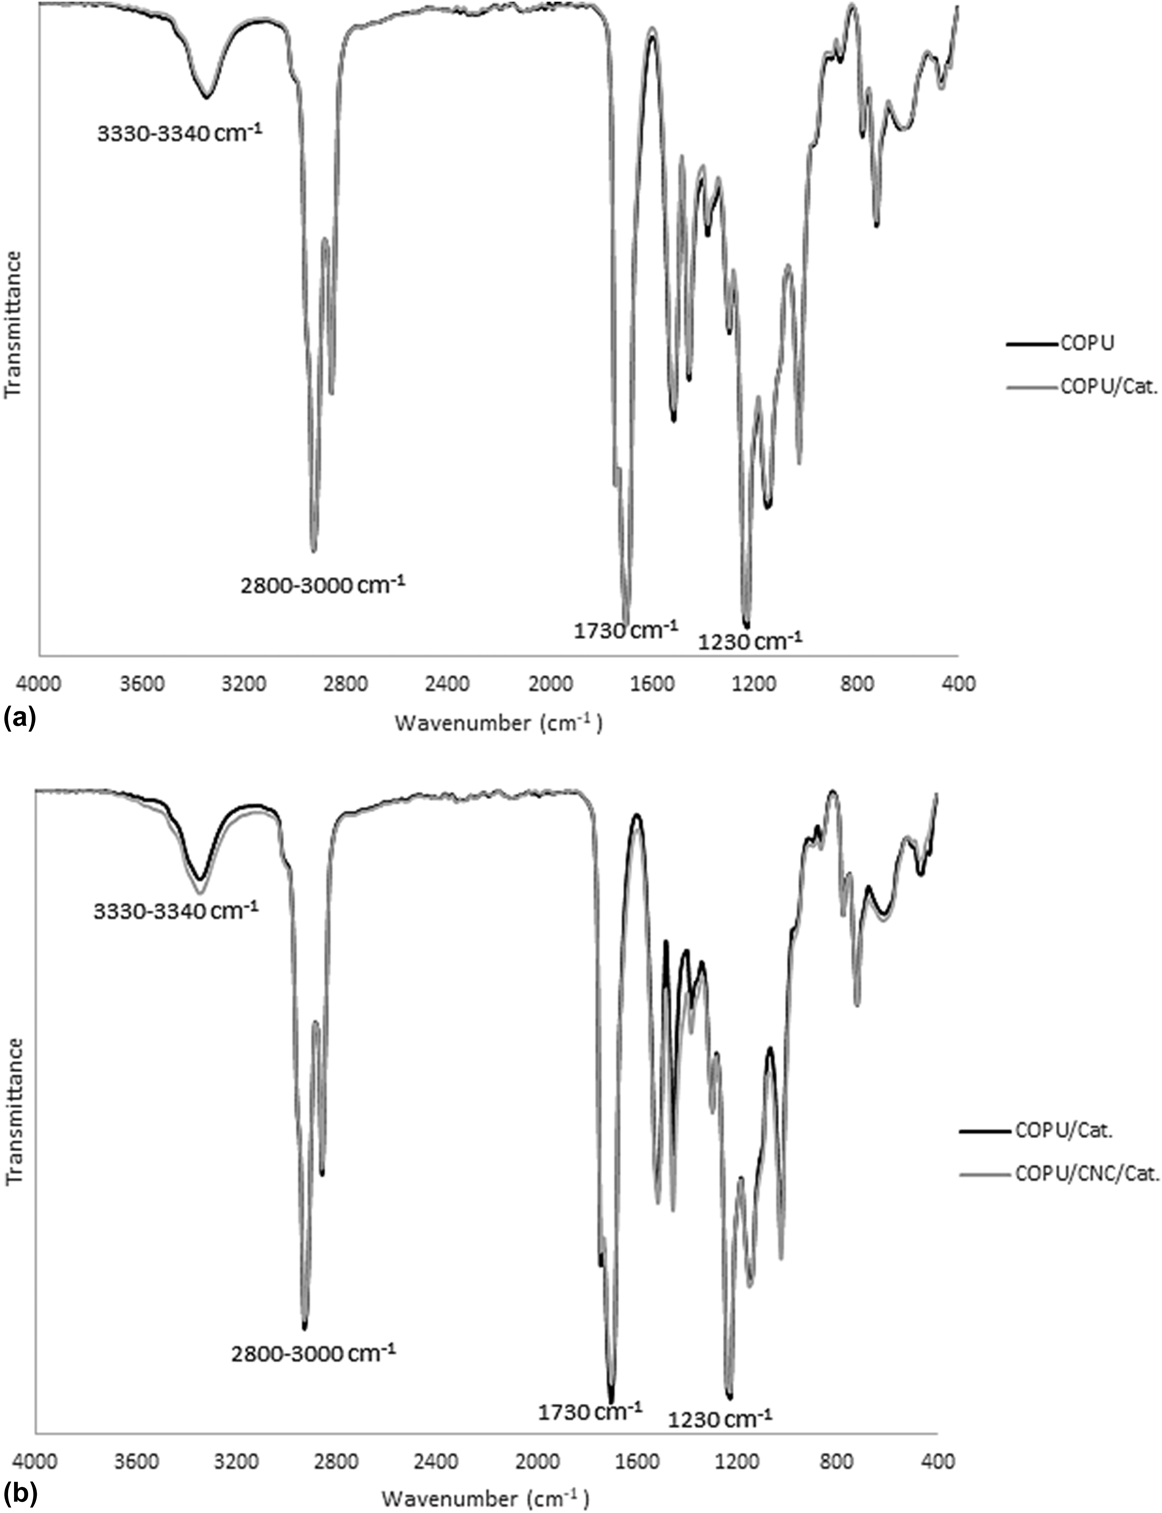
The IR spectra for neat polyurethanes synthesized with and without catalyst are shown in Fig. 2(a). A signature peak can be observed at 1730 cm−1 and a broad band at 3330–3340 cm−1 from the C=O and NH stretching vibrations, respectively, of urethane.Reference Gao, Peng, Zhong, Sun, Wang and Yue13 Additionally, the absence of the characteristic isocyanate peak at 2200 cm−1 indicates that IPDI was completely consumed in the catalyzed and noncatalyzed polymerization reactions. Peaks between 2800 and 3000 cm−1 correspond to CH2 and CH3 symmetric and asymmetric stretching, which are characteristics of bio-based polyurethanes,Reference Datta and Głowińska26 while the peak at 1230 cm−1 corresponded to CH2 of aliphatic chains in polyurethane.Reference Dave and Patel25
IR spectra of (a) neat polyurethanes, with and without catalyst, and (b) neat polyurethane with catalyst and its CNC composite.

The cellulose loading used in the synthesized materials did not result in new peaks, as shown in Fig. 2(b) where the IR spectra of neat polyurethane COPU/Cat. and the COPU/CNC/Cat. composites are to be compared. Nevertheless, a difference in the magnitude of the peak at 3330–3340 cm−1 was observed. This difference could indicate a change in the polyurethane phase separation due to a hydrogen bond interaction between polyurethane segments and cellulose in the COPU/CNC/Cat. composites. Polyurethane is known to segregate into both HS-rich domains that consist of urethane and are responsible for physical cross-linking, and SS-rich domains that consist of polyol chains (the major constituent by mass), which gives the material its elastomeric performance.Reference Prisacariu27 In neat polyurethane, NH in the HS domains serves as the proton donor, whereas C=O from the HS and SS domains serves as the proton acceptor.Reference Senich and MacKnight28 The addition of cellulose could lead to new hydrogen bond interactions between OH groups on the surface of cellulose and C=O ones, with C=O dissociating its original hydrogen bonds with NH, which gives the SS more freedom to arrange into domains.Reference Gao, Peng, Zhong, Sun, Wang and Yue13 These changes in the polyurethane phase structure and the strong interactions between cellulose and the matrix evidenced in the SEM images could affect the mechanical and thermal properties of the material, as discussed later.
The samples were rinsed to remove noncrosslinked chains, unreacted raw materials, filler particles, and catalyst residues, which can affect material biocompatibility. The samples swell significantly in THF, becoming very fragile while submerged and shrinking abruptly when the solvent was changed, so the change to ethanol was done progressively. Once the samples were washed with water, they shrank to their initial shape, recovering their rubbery consistency. The mass loss after rinsing depended exclusively on the use of a catalyst, increasing to 1.51 ± 0.23% for the noncatalyzed samples compared with 1.08 ± 0.06% for the catalyzed samples. None of the synthesized composites, with or without catalyst, showed significantly different mass losses (α > 0.05) compared with neat polyurethanes, suggesting that the cellulose particles (MCC and CNC) were properly integrated in the matrix and filler leaching was unlikely.
B. Degree of crosslinking and hydrophilic behavior of composites
The type of cellulose used as the reinforcement material and the addition of DBTDL as the catalyst had a statistically significant effect (α < 0.05) on the density (ρ) of the synthesized materials. Even though the amount of cellulose added to the matrix was very low (2 wt%), the density increased with filler content, as shown in Table I, because the density of cellulose is higher than that of the PU matrix. The experimental density values for the composites were very close to the theoretical values calculated using the rule of mixtures, using the experimental densities of neat polyurethanes (ρCOPU = 1.020 g/mL and ρCOPU/Cat. = 1.014 g/mL) and taking the completely crystalline natural cellulose density as 1.5905 ± 0.0085 g/mL.Reference Sun29 As expected, the CNC-based composites had higher densities than the MCC-based ones, due to the higher crystallinity of the former. The effect of the catalyst on the density can be attributed to a less ordered polymer network in the materials where the catalyst was used, due to the accelerated polymerization reaction.
Experimental densities, theoretically calculated composites densities, and WU of neat PUs and their composites.

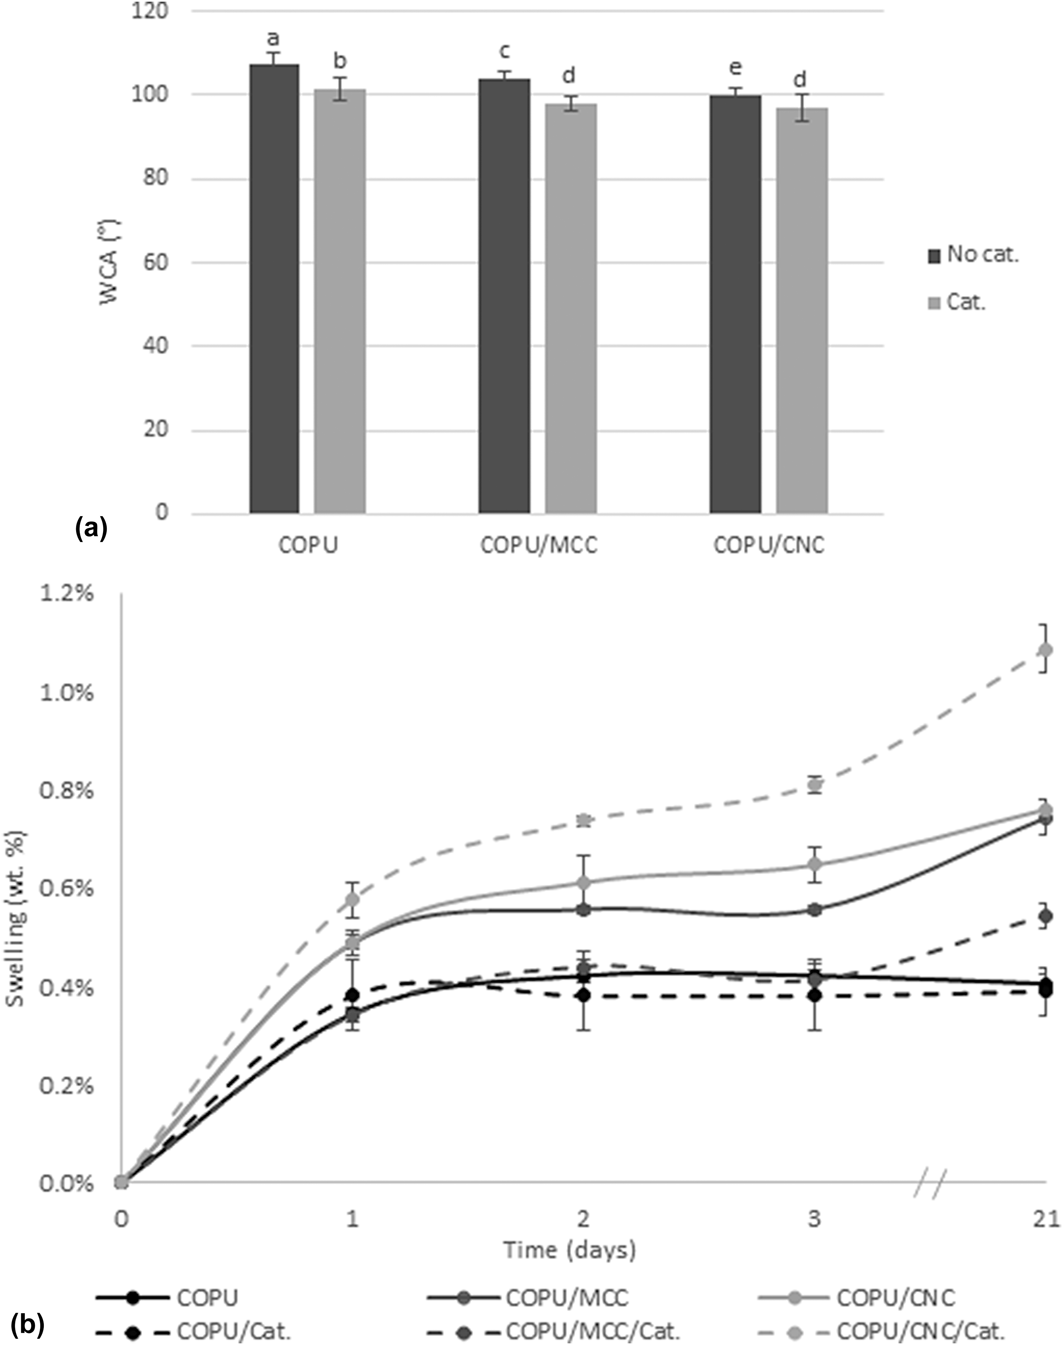
The hydrophilicity of neat PUs and their composites was analyzed via the WCA and swelling in water. Figure 3(a) presents the average WCAs of the sample surfaces, which can be considered as not easily wettable, as all presented angles were greater than 90°.Reference Yilgör, Yilgör and Wilkes30 The hydrophobic behavior of the samples was reduced by the addition of cellulose and the catalyst. This behavior can be attributed to the hydrophilic character of cellulose and modifications in microphase separations and segment migrations, which are related to the surface energy.Reference Yilgör, Yilgör and Wilkes30 The filler particle size also had an effect on the surface hydrophilicity; the CNC composites had a lower hydrophobicity than the MCC composites. A smaller particle size may have increased the proportion of cellulose segments available at the surface of the material to interact with water.
(a) WCAs and (b) water sorption kinetics of neat PUs and their composites. Note: WCA data are presented as the means and error bars represent two SD (n = 8). Bars with different letters indicate statistically significant differences (α < 0.05) according to the ANOVA and LSD post hoc test.

The water uptakes (WUs) of the samples after 21 days immersed in water are shown in Table I. The PU neat matrix can be regarded as hydrophobic considering the amount of water absorbed (approximately 0.40%). The evolution of sample weights during exposure to water versus time is presented in Fig. 3(b). As expected, the composites showed higher swelling due to the higher hydrophilicity of cellulose, which allowed water molecules to infiltrate the interfacial filler/matrix zone.Reference Benhamou, Kaddami, Magnin, Dufresne and Ahmad31 The significant difference between COPU/CNC/Cat. and the other composites can be related to the formation of an interconnected filler network that promotes diffusion of water in the material, in agreement with data from the literature.Reference Santamaria-Echart, Ugarte, García-Astrain, Arbelaiz, Corcuera and Eceiza32 This interconnected network may not have completely formed in the other composites, either as the result of filler aggregation in the composites where the catalyst was not used or due to the low aspect ratio of the filler in the MCC composites, leading to a slower diffusion of water into the material. This absorption mechanism is clearly demonstrated in Fig. 3(b), which shows that the neat PUs reached maximum swelling after 2 days in contact with water, while the composites kept swelling after 21 days. COPU/MCC/Cat. notably had a lower water uptake compared with the noncatalyzed composites. This lower WU was attributed to the formation of aggregates in the noncatalyzed composites, which created interstitial spaces where water accumulated.
C. Thermal properties
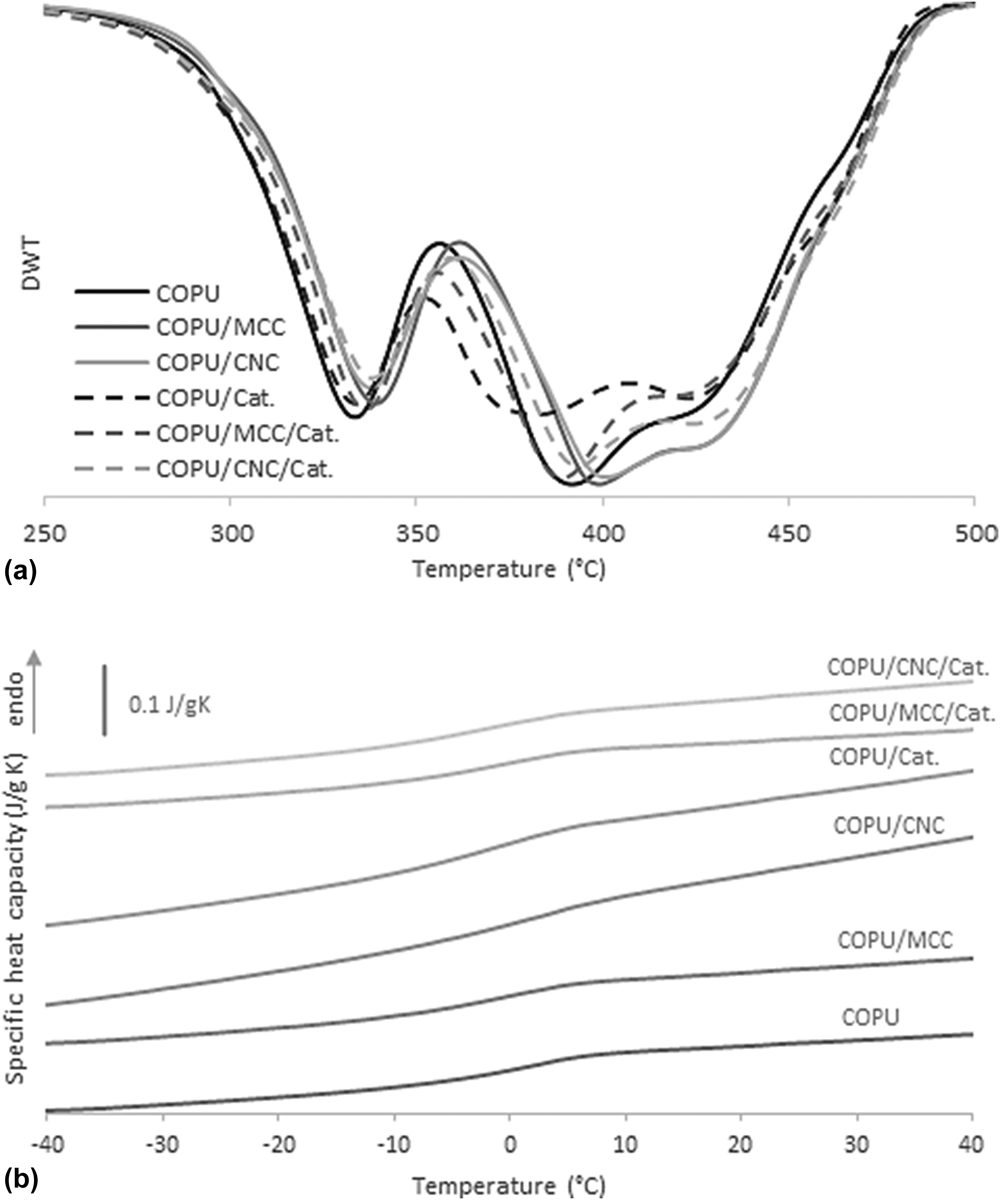
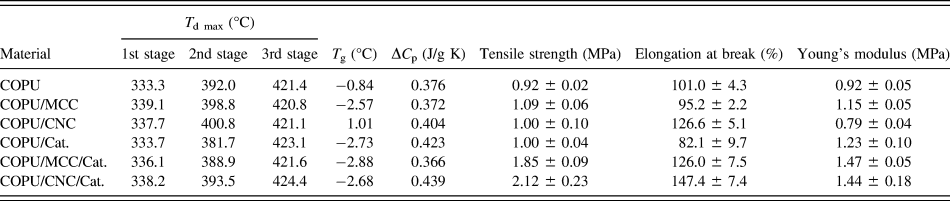
The derivative thermograms in Fig. 4(a), calculated as the derivative of the sample weight versus the temperature measured by TGA, show three different decomposition stages for all the samples. The maximum decomposition temperatures (T d max) of each stage, calculated as the relative minimum of the sample weight derivative, are summarized in Table II, along with other thermal properties. The 1st degradation stage, between 270 and 370 °C, is known to be related to the urethane bond decomposition that occurs through three mechanisms: (i) dissociation to its parent isocyanate and alcohol, (ii) formation of a secondary amine and an olefin, and (iii) formation of a secondary amine and carbon dioxide.Reference Javni, Petrović, Guo and Fuller33 The 2nd stage, at approximately 380 °C, corresponds to polyurethane SS pyrolytic degradation into 10-undecanoic acid and heptanal (degradation products of ricinoleic acid).Reference Kumar and Siddaramaiah34 The last stage is related to the decomposition of the polyurethane networks and other remaining structures.
(a) Weight derivatives versus temperature obtained from TGA curves and (b) specific heat capacities of COPUs and their composites.

Thermal properties obtained from TGA (T d max) and DSC (T g and ΔC p) analyses, and mechanical properties of PUs and their composites.

The T d max for the 1st and 2nd stages tend to be higher when cellulose was added. This result was attributed to the new bonds between the matrix and the hydroxyl groups on the cellulose surface, which provided higher thermal stability to the composites.Reference Wik, Aranguren and Mosiewicki14 On the other hand, the T d max for the 1st and 3rd degradation stages were almost identical for materials with and without the catalyst. Nevertheless, in the 2nd degradation stage, the T d max seemed to be affected by the use of a catalyst, being 10 °C lower for the materials in which a catalyst was used. This result has been attributed to a catalytic effect from DBTDL on the SS-rich phase packing; a less packed domain structure leads to lower thermal stability.Reference Oprea, Joga, Zorlescu and Oprea35 The influence of the catalyst on the thermal properties of SS-rich domains was also evident in the DSC analyses performed.
Polyurethanes with a high phase separation are known to have two glass transition temperatures (T g), one at temperatures below 0 °C for the SS-rich domains and the other at temperatures above 0 °C for the HS-rich domains.Reference Gurunathan, Mohanty and Nayak8 However, the synthesized materials showed only one glass transition temperature (T g) at approximately 0 °C, as shown in the DSC normalized thermograms presented in Fig. 4(b). The presence of only one T g can thus be attributed to a poor phase separation related to the curing temperature. A high curing temperature leads to HS–HS hydrogen bond disassociation, resulting in a more homogeneous structure.Reference Prisacariu27 Neat castor oil polyurethanes synthesized in other studies under similar conditions, but at lower curing temperatures, show two defined T g at −46.12 °C and 116.42 °C for SS-rich and HS-rich domains, respectively.Reference Gurunathan, Mohanty and Nayak8
T g values were calculated using the half C p extrapolation method and are listed in Table II, along with the change in specific heat capacities (ΔC p). The T g in the DSC thermograms, assumed to be the T g for the SS-rich domains because they appear close to or below 0 °C, tends to shift to lower temperatures for those materials synthesized with the catalyst compared with those synthesized without the catalyst. This result can be attributed to an accelerated polymer network formation when DBTDL was used, which could cause a less organized domain structure and, as TGA analysis suggests, a less packed structure in the SS-rich domains. Subsequently, a higher T g was reported for COPU/CNC, suggesting that the addition of CNC resulted in higher phase separation, which combined with a slower polymerization reaction, led to higher domain separation and packing.
D. Mechanical properties
The neat COPUs and the composites with 2 wt%. of MCC or CNC were tested under tension at room temperature (above the T g of materials). Table II shows the mechanical properties of materials, which display a typical rubbery behavior with a low tensile strength, a low Young’s modulus, and high elongation at break. The low strength of polyurethanes based only on CO as polyol result from the many dangling chains, which act as imperfections in the polymer network, and do not support the stress when loading the matrix.Reference Narine, Kong, Bouzidi and Sporns36 The composites without catalyst (COPU/MCC and COPU/CNC) showed little to no improvement in their mechanical properties, having the same tensile strength of neat PUs. For these materials, the lack of mechanical improvement can be related to the easier aggregation of the filler. The synthesized polyurethane matrix needed long curing times, due to the low hydroxyl number of CO; this led to the formation of agglomerates that act as defects in the composites, consequently reducing the possible reinforcing effect of the filler. Nevertheless, elongation at break was improved for the COPU/CNC composite by 25%, compared with neat COPU. This suggests that the CNC smaller particle size may increase the hydrogen bond interaction between the cellulose interface and PU matrix, enhancing microphase separation.
On the other hand, the composites synthesized with the catalyst did show a statistically significant improvement (α < 0.05) in their mechanical properties, as displayed in Fig. S1. In particular, the highest tensile strength and elongation at break were found in the composite COPU/CNC/Cat., with an increase of 112% and 79%, respectively, compared with neat COPU/Cat. The reinforcement effect of the cellulose fillers was attributed to the formation of a tridimensional network of cellulose particles in the PU matrix. The interaction between this network and the PU matrix probably increased the crystallinity of the hard-segments, decreasing molecular mobility and promoting rigidity, in agreement with other studies.Reference Lin, Huang, Chang, Wei, Xu and Zhang37 Mechanical properties are therefore very sensitive to the presence of DBTDL because it accelerates the polymerization reaction. A higher polymerization rate diminishes the time span between the mixing of cellulose during synthesis and polymer network formation, preventing agglomeration of the filler.Reference Yakovlev, Gagolkina, Lobko, Khalakhan and Klepko38 The improvement in both tensile strength and elongation at break achieved in this work contrast with the results obtained in other studies that evaluated the effect of the addition of cellulose to similar PU matrices. Some authors found an increase in tensile strength and a reduction in elongation at break,Reference Saralegi, Gonzalez, Valea, Eceiza and Corcuera11–Reference Wik, Aranguren and Mosiewicki14 while others reported a decrease in both mechanical properties.Reference Oprea, Potolinca, Gradinariu, Joga and Oprea10 This suggests that the proposed system allows the reinforcement of hard domains without blocking the movement of the molecular chains of the PU.
Although the reinforcement effect on the tensile strength was remarkable relative to the filler content, this mechanical property is expected to be at its highest when the filler content is above the percolation volume.Reference Gao, Peng, Zhong, Sun, Wang and Yue13 The critical volume fraction of filler necessary to reach the percolation threshold can be calculated by V TH = 0.7(L/D).Reference Cao, Xu, Wang, Liu, Liu and Chen39 Herein, with an aspect ratio of 10 (calculated in Sec. III.A from the SEM image analysis) for this system, the result is V TH = 7 vol% or 10.98 wt%, given the density of crystalline cellulose and the PU matrix mentioned in Sec. III.B. As reported by Marcovich et al.,Reference Marcovich, Auad, Bellesi, Nutt and Aranguren40 simple models are available to correlate the mechanical properties of the composite with the concentration of the filler, but these models are not accurate when applied in systems where the filler can react with the polyurethane matrix, as the case of the system proposed in this work.Reference Girouard, Xu, Schueneman, Shofner and Meredith41 Without available accurate models to predict the properties of the system and taking into account that the content of filler was well below the necessary to reach the percolation volume, the effect of the addition of NCC in higher concentrations over the mechanical properties of the composite is being studied and will be the subject of future publications.
E. Composite stabilities and calcifications
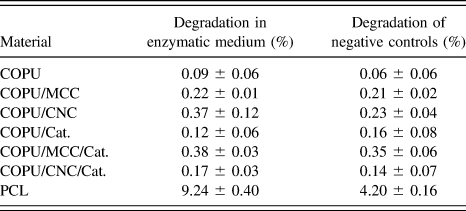
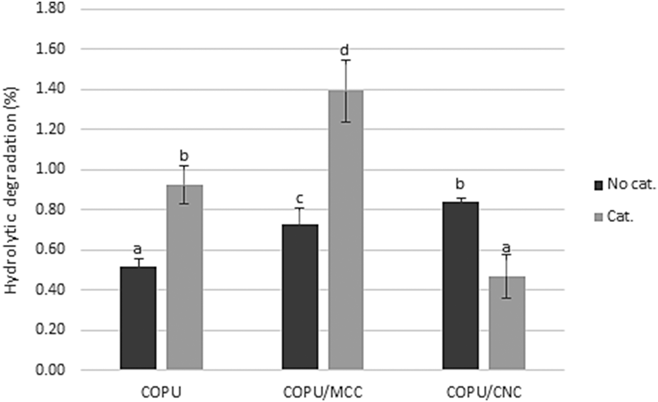
Table III shows the mass loss of the materials after 3 weeks of enzymatic degradation, and the mass loss of the control samples that were immersed in PBS without the enzyme. In contrast to the PCL, which was expected to follow a more substantial degradation in an enzymatic medium,Reference Chawla and Amiji42 the PUs and their composites showed no statistically significant difference (α > 0.05) in terms of mass loss compared with the negative control samples during the enzymatic degradation assay. The highly hydrophobic surfaces and highly packed structures of the synthesized materials may have caused the poor degradative effects of the enzyme because these qualities hinder a proper enzyme–polymer interface, which was necessary for the enzymatically catalyzed degradation to occur.Reference Azevedo, Reis, Reis and San Román43 The mass loss of the samples is thus attributed to hydrolytic nonenzymatic degradation of ester and urethane bonds in the polymers. After the 3rd week, the mass loss was very low (0.06–0.35%), and the hydrolytic degradation assay was therefore extended to twelve weeks; the mass loss results are shown in Fig. 5. The materials were highly resistant to hydrolytic degradation, 1.39 ± 0.15% being the highest mass loss value, for COPU/MCC/Cat. The presence of a catalyst, cellulose, and filler particle size, all affected the material stability. The samples tended to degrade faster when cellulose was added, and more specifically mass loss was higher for the CNC than the MCC composites. This result can be attributed to the enhanced hydrophilicity of the former, as the WCA results showed. Additionally, materials in which the catalyst was added tended to show higher weight losses. This result also indicates that the catalyzed materials have a less organized structure due to the accelerated polymerization reaction, which facilitates the release of chains that break from the polymer network and their diffusion towards the medium. Other studies have correlated greater amorphous morphologies and higher free volumes to higher degradation rates.Reference Mondal and Martin44 Therefore, COPU/CNC/Cat. was expected to be the sample most susceptible to hydrolytic degradation; nevertheless, it showed the lowest degradation value. This result could be attributed to the enhanced physical cross-linking between the CNCs and the HS phase of the PU matrix. A similar behavior was reported for graphene oxide/polyamide-11 composites, where changes in the hydrogen bonding behavior of a well-dispersed composite inhibited the hydrolysis process.Reference Hocker, Hudson-Smith, Smith, Komatsu, Dickinson, Schniepp and Kranbuehl45
Enzymatic degradations of PCL and the synthesized materials and degradation of the negative controls.

Hydrolytic degradations of neat PUs and their composites after 12 weeks. Note: data are presented as the means and error bars represent two SD (n = 4). Bars with different letters indicate statistically significant differences (α < 0.05) according to the ANOVA and LSD post hoc test.

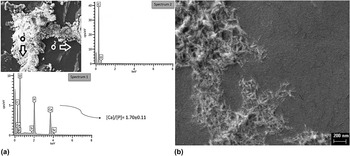
PUs can support calcium phosphate crystal formation. The polyurethane chemical composition, the hydrophilicity of the material, and the presence of an ether oxygen have important effects on calcification deposition, yet the exact mechanism remains unknown.Reference Marzec, Kucińska-Lipka, Kalaszczyńska and Janik46 Figure 6(a) shows the SEM image of the COPU surface after immersion for 4 weeks in Golomb and Wagner’s calcification medium and EDS spectra 1 and 2, which confirm the calcium phosphate nature of the observed deposits. All the samples show calcified formations on their surfaces. An average Ca/P ratio of 1.70 ± 0.11 was obtained from the EDS spectra (four EDS spectra were taken per sample), which was slightly higher than the biological hydroxyapatite Ca/P molar ratio (1.67), and in the range of 1.52–2.0 that has been reported in similar studies.Reference Gorna and Gogolewski47 Figure 6(b) shows the needle-like shape of the calcifications; this morphology has been reported in previous polyurethane calcification studies, along with spherical, rosette-like, and plaque-like deposits.Reference Golomb and Wagner48–Reference Meskinfam, Bertoldi, Albanese, Cerri, Tanzi, Imani, Baheiraei, Farokhi and Farè50 Deposit morphology is believed to be affected by the physicochemical properties of the material, rather than the calcification medium used.Reference Golomb and Wagner48
(a) SEM image of the PU sample surface after immersion in the calcification medium for 4 weeks and EDS spectra confirming the calcium phosphate deposits and (b) SEM image of the needle-like calcium deposits on the PU sample surface after immersion in the calcification medium for 4 weeks.

F. Fibroblast proliferation
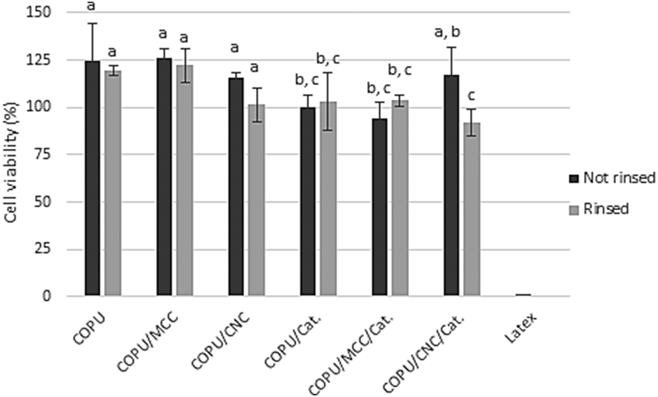
Figure 7 shows the effects of the addition of cellulose, the catalyst, and the rinsing protocol on L929 fibroblast viability. The statistical analysis shows significant differences (α < 0.05) between the noncatalyzed and catalyzed samples, those with the catalyst showing a lower cell viability. The cytotoxicity of DBTDL has been reported previously,Reference Tanzi, Verderio, Lampugnani, Resnati, Dejana and Sturani16 but it is though widely used in polyurethane synthesis pursuing biomedical applications.Reference Marzec, Kucińska-Lipka, Kalaszczyńska and Janik46 Some studies have found that DBTDL has a large effect on cell viability, leading to poor biocompatibilityReference Lundin, Daniels, Mcgann, Stanbro, Watters, Stockelman and Wynne17,Reference Lundin, Mcgann, Daniels, Streifel and Wynne51 ; however, most of them do not state any negative effect. In view of these results, the samples synthesized in this work were noncytotoxic according to the ISO 10993-5:2009 norm “Biological evaluation of medical devices-Part 5: Tests for in vitro cytotoxicity”,52 as all materials maintained cell viability above 70% with respect to the positive control. These results suggest that these neat PUs and their composites could be suitable for applications in the biomedical field, where their ability to nucleate hydroxyapatite is mandatory and interesting.
Viability of L929 cells after 24 h of cultivation in contact with previously rinsed and not rinsed materials. Note: data are presented as the means and error bars represent two SD (n = 4). Bars with different letters indicate statistically significant differences (α < 0.05) according to the ANOVA and LSD post hoc test.

A rinsing protocol was proposed and enacted to investigate its efficacy in avoiding cytotoxicity or reaching a higher cell viability. However, the rinsed samples did not show a better biological development and in particular the COPU/CNC/Cat. rinsed samples yielded a lower cell viability, which was attributed to the leaching of solvent trapped in the matrix after rinsing. The significant swelling of the samples in contact with THF and abrupt shrinking when immersed in ethanol may have caused traces of the solvents to be trapped in the PU matrix and then its latter release when the materials where in contact with the culture medium. Adding cellulose to the materials did not have a negative effect on cell viability, confirming that the synthesis procedure is appropriate for incorporating cellulose in the form of micro- or nanocrystals.
Interestingly, some of the synthesized materials (COPU, COPU/MCC, COPU/CNC, and COPU/CNC/Cat.) presented cell viabilities above 100% compared with the positive control. Further research is necessary to study the factors and mechanisms that promote cell proliferation on these samples.
IV. CONCLUSIONS
Cellulose composites based on a castor oil polyurethane matrix were successfully prepared by an in situ polymerization with (COPU/Cat., COPU/MCC/Cat., and COPU/CNC/Cat.) and without (COPU, COPU/MCC, and COPU/CNC) the addition of DBTDL as the catalyst. For the composites, containing cellulose crystals, the use of the catalyst was essential to avoid filler agglomeration, promoting the formation of a filler network, which modified the domain configurations of the materials, improving their mechanical properties, including the tensile strength and elongation at break. The addition of cellulose also improved the thermal stability of the materials, whereas the use of the catalyst decreased their SS degradation temperature, which was related to a decrease in the ability of the SS to arrange into organized domains due to the accelerated polymerization reaction. These effects were confirmed by the decrease in the glass transition of the catalyzed materials. The materials were highly stable against enzymatic and hydrolytic degradation. However, the addition of cellulose and the use of the catalyst increased the hydrophilicity of the materials, increasing the susceptibility of the composites to hydrophilic degradation of ester and urethane bonds. For the COPU/CNC/Cat. combination, this particular effect differed because these samples experienced the lowest hydrolytic degradation, despite being the most hydrophilic ones. Besides this, the increase in the mechanical properties of CNC composites, elongation at break for COPU/CNC, and both elongation at break and tensile strength for COPU/CNC/Cat. suggest that a filler small particle size increase the hydrogen bond interactions between cellulose surface and PU matrix, enhancing the microphase separation and segments’ stability. Materials were noncytotoxic, and a thorough rinsing after synthesis appeared not to be necessary to reach cell viabilities above 70% compared with the positive control. All the samples were susceptible to calcification in simulated physiological conditions, showing needle-like depositions with a Ca/P ratio near the physiological hydroxyapatite ratio. The mechanical, physicochemical, and biological properties of the castor oil polyurethane–cellulose composites synthesized in this work with DBTDL as a catalyst suggest that this system may be an interesting candidate in the development of bioactive biomaterials.
Supplementary Material
To view supplementary material for this article, please visit https://doi.org/10.1557/jmr.2018.286.
ACKNOWLEDGMENTS
Universidad de La Sabana supported this work under Grant No. ING-176-2016. S.V.V. acknowledges the Universidad de La Sabana for the Teaching Assistant Scholarship for his master’s studies. J.A.G.T. and A.V.L. acknowledge the support of the Spanish Ministry of Economy and Competitiveness (MINECO) through project DPI2015-65401-C3-2-R (including FEDER financial support). The authors acknowledge the assistance and advice of the Electron Microscopy Service of the UPV. CIBER-BBN is an initiative funded by the VI National R&D&I Plan 2008-2011, Iniciativa Ingenio 2010, Consolider Program. CIBER Actions are financed by the Instituto de Salud Carlos III with assistance from the European Regional Development Fund.