1 Introduction
One of the core tasks of the standardsetters IASB and FASB is to consider how much scope for discretion the management should be allowed in the preparation of a company's financial statement. On the one hand, it is argued that such managerial discretion could lead to the manipulation of earnings by the management. Thus a significant part of the literature about international accounting deals with the questions if – and why – managers manipulate earnings, how they do it and what the consequences of this behavior might be. Others believe that managerial discretion serves to communicate the management's internal information to the statement addressees (Healy and Palepu, Reference Healy and Palepu1993). Thus, the question if the management should be allowed a certain scope of discretion is mainly a question of whether the advantages of private information being communicated outweigh the disadvantages created by the management's opportunistic behavior (Dye and Verrecchia, Reference Dye and Verrecchia1995). However, earnings are not the only component of a financial statement, in which discretion can be used to influence investors’ perception.
Therefore, following the research approach of Hann et al. (Reference Hann, Lu and Subramanyam2007) we examine this question by means of a specific accounting measure which is to be disclosed in the notes – the defined benefit obligation (DBO), i.e., the present value of future benefits already earned by the current and past employees. Within International Financial Reporting Standards (IFRS), the accounting for pensions, which often have a significant influence on the balance sheet of companies, is covered by IAS 19: Employee Benefits. Although this standard deals with several topics of benefits being granted to employees (such as wages, salaries or termination benefits), in the present paper we focus on defined benefit plans for two reasons: The accounting for defined benefit plans is complex and offers substantial discretionary powers to the management.
Under IAS 19, defined benefit plans have to be actuarially evaluated before being recognized on the balance sheet. These plans oblige the employer to make payments to the employee after the occurrence of a specified event, such as the retirement of the employee. Owing to the uncertainty of future events, the obligation has to be estimated considering a number of parameters. In this context, IAS 19.72 differentiates between demographic and financial assumptions.Footnote 1 Among the main demographic assumptions relating to defined benefit plans, IAS 19.72 (a) lists assumptions regarding the employee turnover and the mortality rate. The financial assumptions essentially comprise, according to IAS 19.72 (b), such regarding the discount rate and the rate of compensation growth and future pension increases. IAS 19.78 prescribes that the discount rate is to be determined using the return of high-class, fixed interest bearing corporate bonds. If there is no liquid market for such corporate bonds, the market returns of government bonds should be used as the basis for calculation. According to IAS 19.79, the discount rate only reflects the time value of money – it does not, per definition, contain any risk component. In general, it has to be considered that the different benefit promises have different durations, which means that different discount rates have to be applied. However, according to IAS 19.80, companies can instead use a single, weighted discount rate reflecting the settlement dates, the sum and the currency of the benefits to be paid. Regarding the measurement of obligations, IAS 19.83 (a) demands that expected future rises in the income level are to be considered, taking into account inflation, the duration of employment at the company, promotions, and the structure of supply and demand on the labor market. Furthermore, adjustments need to be taken into account, which are ascribed to legal or factual obligations. This is, for example, necessary if a company has regularly adjusted pension payments by a compensation for inflation in the past. As the determination of these financial parameters is complex, flexible and hardly comprehensible to outsiders, there exists a significant scope of discretion for the management.Footnote 2 This can either be used to communicate decision useful, internal information about the nature of the obligation to the statement addressees, or to manipulate both the balance sheet structure and the earnings.
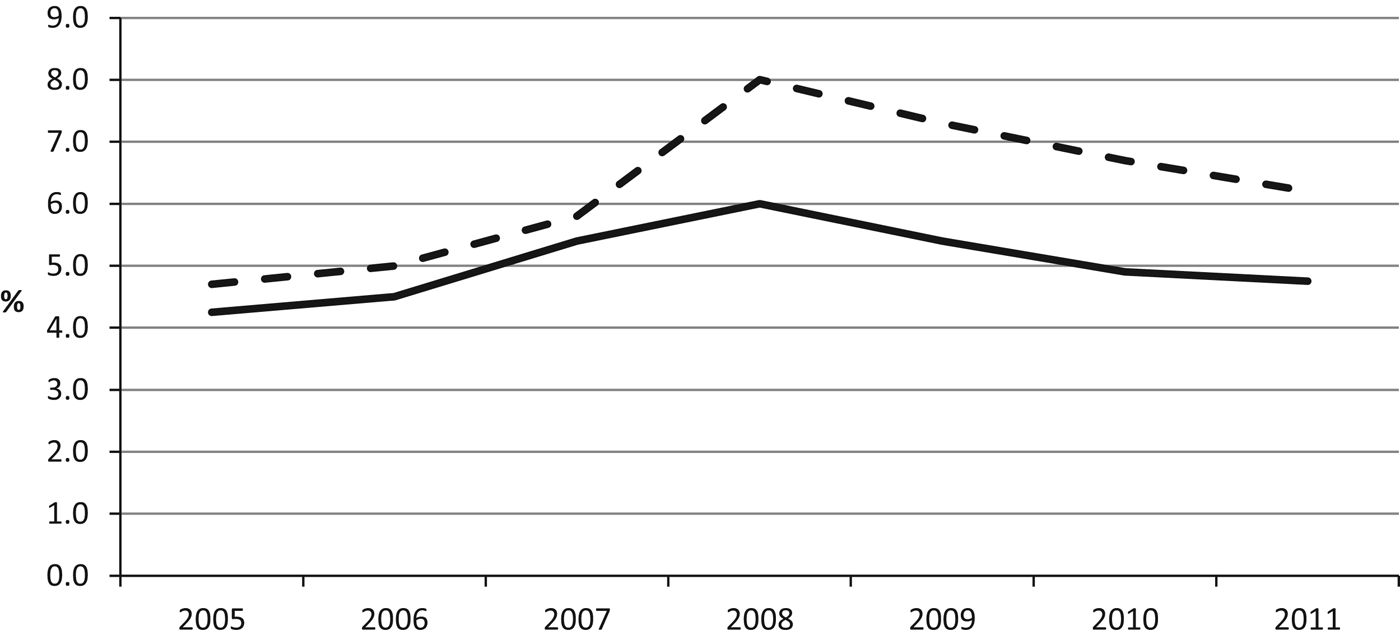
To illustrate the scope for discretion within the determination of actuarial assumptions, Figure 1 shows the development of the discount rate of Lanxess AG, a large German chemicals company (dashed line) as compared to the development of the median discount rate of the chemicals industry (solid line). For 2005–2007, both lines roughly remain in parallel with the discount rate of Lanxess AG exceeding that of the industry by approximately 0.5 percentage points. This may be caused by economic differences between Lanxess AG and other chemicals companies, such as different age structures and hence, different durations of pension obligations. In 2008, however, the discount rate of Lanxess AG increased by 2.2 percentage points, while the industry median only increased by 0.6 percentage points. Having a look at the financial statement of Lanxess AG, the increase is explained by higher market yields as a result of the financial crisis – certainly an event, which impacted the competitors of Lanxess AG as well. We do not want to overstress this example as there may be other reasons apart from the pernicious use of the discretion granted by IAS 19. This is why, in the following, we want to introduce the research approach applied and elaborate on our sample choice.
Development of discount rate of Lanxess AG (dashed line) versus chemicals industry (solid line).

To analyze the use of discretion in the context of the determination of financial assumptions, we examine the question how this discretion affects the value relevance of the disclosed DBO and hence, lowers or increases the market value of equity. To this aim, we identify the component of the DBO which is not to be ascribed to discretion by replacing the company-specific assumptions with their respective industry medians (Hann et al., Reference Hann, Lu and Subramanyam2007).
The difference between the disclosed DBO and the identified non-discretionary component constitutes our estimator for that component of the DBO, which can be ascribed to discretion. Using our main sample, comprising the IFRS statements of listed German companies in the period of 2005–2011, we examine the value relevance of this discretionary component. More precisely, we examine: (i) whether the discretionary component increases the value relevance of the DBO and hence influences the market value of equityFootnote 3 and (ii) if the degree of underfunding moderates investor's perception and their equity valuations.
We limit the sample for our analysis to Germany because of the following reasons: First, all companies operate within the same institutional and regulatory environment and are governed by the same enforcement mechanisms (Ernstberger, Reference Ernstberger2008). Second, data on actuarial assumptions had to be hand-collected as not all the information we needed was available in financial databases and the information available (Datastream items #18806–18847) was of poor quality. Third, Glaum (Reference Glaum2009) notes that studies about pension accounting have up to this point almost exclusively been based on US-American data and regulations. We aim to close this research gap with the present contribution. Last and most important, pension accounting in Germany may deliver new insights to the debate of uniformity versus flexibility in international accounting (Hann et al., Reference Hann, Lu and Subramanyam2007): Pension accounting was less complex in Germany before the introduction of IFRS for the consolidated financial statements of listed companies in 2005. Furthermore, for a large part of German companies it is still less complex as the determination of actuarial assumptions under German GAAP – which is applicable for individual financial statements and for companies which are not listed – differs from IFRS. Under German GAAP, discount rates are not determined individually, but prescribed by the Federal Bank of Germany.Footnote 4 Hence, there is an ongoing debate in Germany, on whether the flexibility of IFRS regulations leads to more decision-useful financial statements as compared to German GAAP.Footnote 5 By focusing on Germany, we aim at contributing to this country-specific debate. Furthermore, our results may influence the overall debate of uniformity versus flexibility and deliver interesting insights beyond the German case.
In summary, we find that the discretionary component is not value relevant in overall terms. This result is in contrast to prior research (Hann et al., Reference Hann, Lu and Subramanyam2007) which finds that – under US-GAAP – discretion in the DBO is value relevant beyond the non-discretionary component. We provide an explanation in the country-specific characteristics of Germany. Furthermore, we find weak evidence that the discretionary component is incorporated in investor's equity valuations in case the pension plan is distinctly underfunded. Our inferences are subject to some limitations. First, we investigate the value relevance of the DBO in a single country, which makes transferability difficult. However, together with the work of Hann et al. (Reference Hann, Lu and Subramanyam2007), we believe that our results help to develop a better understanding of the consequences of managerial discretion within pension accounting. Second, due to the fact that disclosures of actuarial assumptions are sometimes incomplete (e.g., when companies operate both domestic and foreign pension plans) we had to make some simplifications. Please refer to the robustness part of this paper for further details.
This study is structured as follows: Section 2 provides a short overview on the relevant literature, while Section 3 introduces our research approach and develops our hypotheses. Section 4 presents our research results followed by a final conclusion in Section 5.
2 Literature review
There is an ongoing debate within international financial reporting research on how much scope for discretion should be allowed to the management. Principally, this means weighing the benefits of discretion (communication of private information) against their costs (opportunistic behavior by the management) (Dye and Verrecchia, Reference Dye and Verrecchia1995). The majority of works dealing with this question can be subsumed under the term earnings management (a good introduction is provided by Schipper (Reference Schipper1989), Healy and Wahlen (Reference Healy and Wahlen1999), Dechow and Skinner (Reference Dechow and Skinner2000) and Dechow et al. (Reference Dechow, Ge and Schrand2010)). Earnings management is referred to whenever managers apply discretion during financial reporting to either deceive the statement addressees about the company's performance or to influence specific accounting parameters, which could for example affect performance-based payment components (Healy and Wahlen, Reference Healy and Wahlen1999). However, this discretion might also serve to communicate company internal, private information to the statement addressees (Schipper, Reference Schipper1989; Healy and Palepu, Reference Healy and Palepu1993; Sankar and Subramanyam, Reference Sankar and Subramanyam2001).
A large part of the literature on earnings management is based on the model of Jones (Reference Jones1991), dividing accruals into a discretionary and a non-discretionary component. Subramanyam (Reference Subramanyam1996), for instance, demonstrates that the practice of discretion on average increases the value relevanceFootnote 6 of earnings, whereas Guay et al. (Reference Guay, Kothari and Watts1996) note that such a differentiation of accruals tends to be defective. One possible way of avoiding such defects is to examine only specific managerial decision processes (McNichols, Reference McNichols2000) – in the particular case the accounting for pensions. The advantage of investigating these decision processes is that researchers can use their expertise in a specific area to model the discretion inherent in the decision processes in a reliable way.
Owing to the following reasons, various researchers have chosen to analyze the decision process of the accounting for pensions:Footnote 7 First, pensions have a significant influence on the companies’ balance sheetFootnote 8 and second, there exists an enormous room for discretion in the determination of the pension obligation. Furthermore, companies have to disclose specifications of the essential parameters determining the amount of the pension obligation, which gives the opportunity to analyze the extent to which these parameters are driven by discretion. Looking at the USA, we find various studies which show that these parameters can vary significantly between companies and that their determination is influenced by management (Gopalakrishnan and Sugrue, Reference Gopalakrishnan and Sugrue1995; Godwin et al., Reference Godwin, Goldberg and Duchac1996).Footnote 9
In general, pension research can be classified in such analyzing pension assets and such analyzing pension liabilities. Considering pension assets, Bergstresser et al. (Reference Bergstresser, Desai and Rauh2006), Asthana (Reference Asthana2008) and Adams et al. (Reference Adams, Frank and Perry2011) analyze the opportunity to influence reported earnings through the expected rate of return on pension assets. While Bergstresser et al. (Reference Bergstresser, Desai and Rauh2006) and Asthana (Reference Asthana2008) find that managers may manipulate earnings through their characterizations of pension assets and through the expected return on plan assets, Adams et al. (Reference Adams, Frank and Perry2011) come to the result that the expected rate of return on pension assets is not overstated relative to several benchmarks. However, further support on the view that the expected rate of return is subject to managerial manipulation is provided by Hsu et al. (Reference Hsu, Wu and Lin2013) who show that companies with distress risk and complex ownership structure tend to increase the value of plan assets by rising the expected rate of asset returns.
With regard to the allocation of pension assets between different risk classes, Bikker et al. (Reference Bikker, Broeders, Hollanders and Ponds2012) show that a higher average age of plan participants significantly reduces equity exposure, whereas Phan and Hegde (Reference Phan and Hegde2013) demonstrate that good corporate governance increases the willingness to invest in more risky assets. Furthermore, Amir et al. (Reference Amir, Guan and Oswald2010) find that UK and US companies shifted pension assets from equity to debt securities as a reaction to new disclosure requirements and Chuk (Reference Chuk2013) shows that changes in the disclosure requirements also lead to changes in the allocation behavior of companies.
On the other hand, there are several studies that focus on pension liabilities. By providing evidence that companies select downward biased assumptions to exaggerate the economic burden of their benefit plans when ‘hard’ freezing these plans, Comprix and Muller (Reference Comprix and Muller2011) support the relevance of research on discretion within the determination of actuarial assumptions. With regard to the change from ‘disclosure’ (SFAS No. 87) to ‘recognition’ (SFAS No. 158) of pension obligations under US-GAAP, results are inconsistent. Although Beaudoin et al. (Reference Beaudoin, Chandar and Werner2011) fail to find incrementally value relevant information as a result of the disclosure requirement of the funded status of the defined benefit plans under SFAS 158, Yu (Reference Yu2013) shows that SFAS 158 increases the value relevance of previously disclosed off-balance-sheet pension obligations for firms with a low level of institutional ownership or analyst following.
Hann et al. (Reference Hann, Lu and Subramanyam2007) also focus on pension obligations and – using a US sample – find that discretion in the determination of the DBO serves to communicate value-relevant information to the capital market. They therefore conclude that imposing uniformity in the choice of pension assumptions, on average, prevents communication of value relevant information through the DBO. In this paper, we follow the research approach introduced by Hann et al. (Reference Hann, Lu and Subramanyam2007). We first determine the non-discretionary component of the DBO by replacing the actuarial assumptions of management with their respective industry medians. The discretionary component of the DBO is then deduced by the subtraction of this sum from the disclosed DBO. One disadvantage of this approach is the fact that the amount of the DBO is only disclosed in the notes. In this context, we must ask ourselves whether statement addressees appreciate the notes at all, or whether the capital market appraises them equally to the specifications made in the profit and loss statement or on the balance sheet. Barth (Reference Barth1991), however, demonstrates that specifications regarding pension obligations are perceived by the market in a similar way to specifications about other obligations reported on the balance sheet.
Furthermore, it should be noted that research on the association between market data and accounting data has primarily focused on earnings information.Footnote 10 However, we believe that in the context of IFRS pension accounting, our approach of analyzing the DBO is a suitable method to exploring the question whether the benefit of discretion in pension accounting outweighs the inherent costs. For our sample period, IAS 19 allowed three options with respect to the accounting for actuarial gains and losses. According to IAS 19.92-93D, the possible options were: (1) the corridor approach, (2) any faster recognition in income and (3) the recognition within equity. As most of the companies in our sample either used option (1) or option (3), only a small part of actuarial gains and losses went directly through the P&L, namely those exceeding the corridor under option (1) or those under option (2). Furthermore, IAS 19 (rev. 2011) eliminates this option for financial years starting on or after 1 January 2013. From that date onwards, actuarial gains and losses have to be recorded as remeasurements via other comprehensive income in equity. Hence, we conclude that the link between actuarial assumptions and earnings is weak and research with respect to the DBO is worthwhile.
3 Research approach
3.1 Determining the discretionary component of the DBO
The determination of that component of the DBO which can be ascribed to discretion (henceforth DBO D ) is based on Hann et al. (Reference Hann, Lu and Subramanyam2007), who derive the discretionary component DBO D from the difference between the DBO disclosed in the notes and that component of the DBO which is not to be ascribed to discretion (DBO X ). DBO X is determined by replacing company-specific actuarial assumptions with their respective industry medians.Footnote 11
We thus suggest that the DBO can be defined asFootnote 12
 $$DBO = \displaystyle{{P_{i,r,L} ({\widehat {KW}}(1 + g)^N )} \over {(1 + i)^N}}. $$
In this context, P
i,r,L
describes the present value factor of a pension which geometrically progresses over a period L with pension increases of r and a discount rate of i, formally expressed byFootnote
13
 $P_{i,r,L} = ((1 + i)^L - (1 + r)^L /(i - r)(1 + i)^L )$
(in contrast to our approach, Hann et al. (Reference Hann, Lu and Subramanyam2007) do not take into account the projected future pension increases in their segmentation of the DBO). L defines the average life expectancy of an employee after retirement; K indicates the proportion of the current wage level W, which is to be paid as a pension in N years. Accordingly,
 ${\widehat {KW}}$
is our estimator for this relation. The factor (1+g)
N
is used to anticipate future salary increases. It should be noted that N has to be equally applicable both to employees and to pensioners – it thus represents the average, weighted years to retirement over both groups.Footnote
14
In other words, the DBO is the present value of the predicted pension
 ${\widehat {KW}}$
(1+g)
N
, which has to be paid over a period of L years after retirement.
Determining the parameters i, g and r is uncomplicated, as these can be extracted directly from the notes. This is not possible for L and N, meaning that two assumptions have to be made:
-
• Assumption regarding L : In 2005, the average remaining life expectancy of 65-year-old men was approx. 16.5 years, that of 65-year-old women about 20 years.Footnote 15 Thus, for reasons of simplicity we assume an average remaining life time of L = 18 years.
-
• Assumption regarding N: The average age in Germany in 2005 was about 42 years,Footnote 16 while the average age of retirement was about 62 years.Footnote 17 This would mean 20 years to retirement N. Since N refers to both employees and pensioners, however, we first determine an estimator to identify which proportion of each DBO is allotted to pensioners. For this purpose, the benefit payments BP, which were due in a specific period and disclosed in the notes, are multiplied by annuity present value factors PVF gained from the Professional Association of Mathematics Experts of the Arbeitsgemeinschaft für betriebliche Altersversorgung e.V. (‘Commission for Company Pension Schemes Inc.’) in Germany. The proportion of the DBO allotted to pensioners can thus be defined as
(2) $$\lambda = \displaystyle{{BP*PVF} \over {DBO}}.$$

The proportion allotted to the employees thus amounts to φ = 1−λ. This is multiplied by the original 20 years to retirement, providing a company- and period-specific estimator for N in dependence to φ.
Apart from
 ${\widehat {KW}}$
all elements of equation (1) are thus either known (i, r and g) or assumed (L and N). Reordering equation (1),
 ${\widehat {KW}}$
can be determined as follows:
 $${\widehat {KW}}{\rm =} \displaystyle{{DBO(1 + I)^N} \over {P_{i,r,L} (1 + g)^N}}. $$
If we now replace the actuarial assumptions of the management (i, r and g) in equation (1) by their respective industry medians (i*, r* and g*), the result is DBO X , the non-discretionary component of the DBO.
 $$DBO_X = \displaystyle{{P_{i^*,r^*,L} ({\widehat {KW}}(1 + g^*)^N )} \over {(1 + i^*)^N}}. $$
By subtracting
 $$DBO_D = DBO - DBO_X, $$
we determine the discretionary component of the pension obligation DBO D .
By replacing actuarial assumptions with industry averages, we assume that all deviations from the averages are ‘discretionary’. However, some deviations are likely to reflect real economic differences. For example, discount rates may differ if pension beneficiaries have different age structures and if pension obligations hence have different durations. Salary increase rates may differ if companies face different labor-market supply and demand structures. The research method developed by Hann et al. (Reference Hann, Lu and Subramanyam2007) and now adopted by us cannot differentiate between these real economic differences and what we call ‘discretion’. However, we do not believe that this renders the research approach unreliable and aim at a useful contribution to pension accounting research.
3.2 Hypotheses development
For the purpose of determining the value relevance of DBO D , we use regression models with the market value of equity as of 3 months after balance sheet date as the dependent variable. Accordingly, we assume that all companies have published their financial statements until this date and that this information is reflected within the market value of equity. The use of the market value of equity (in contrast to using returns) is suitable for our study, since we examine the value relevance of a ‘balance sheet item’. To be in line with the accounting based valuation model suggested by Ohlson (Reference Ohlson1995), we correct the total liabilities for all items associated with pensions. In doing so, we can use the DBO as explanatory variable, although it is not recognized directly on the balance sheet.Footnote 18 Such a specification, however, suffers from a number of econometric difficulties, mainly those created by heteroscedasticity and scale effects (Brown et al., Reference Brown, Lo and Lys1999). To account for these problems, all variables are standardized by sales. In addition, we apply time-fixed effects panel regressions with firm-clustered standard errors.
3.2.1 Overall value relevance of the discretionary component
First, we want to analyze how the discretionary component DBO D is perceived by investors and if there is a difference in the perception compared to the non-discretionary DBO X . Therefore, we examine the relative value relevance of the pension obligation with and without discretion. For this we compare the coefficients as well as the adjusted R 2 of the following models (I.) and (II.).
 $$\eqalign{MVE_{it} =& \sum\limits_{t = 2005}^{2011} \alpha _t I_t + \beta _1 TA_{it} + \beta _2 NPTL_{it} + \beta _3 DBO_{it} + \beta _5 NI_{it} + \beta _6 EMP_{it} + \beta _7 RD_{it} \cr &+ \beta _8 LOSSD_{it} + \beta _9 LOSSD_{it} \cdot NI_{it} + u_t,}$$
 $$\eqalign{MVE_{it} = & \sum\limits_{t = 2005}^{2011} \alpha _t I_t + \beta _1 TA_{it} + \beta _2 NPTL_{it} + \beta _3 DBO_{it} + \beta _4 DBO_{D,it} + \beta _5 NI_{it} \cr & + \beta _6 EMP_{it} + \beta _7 RD_{it} + \beta _8 LOSSD_{it} + \beta _9 LOSSD_{it} \cdot NI_{it} + u_t.}$$
MVE it defines the market value of equity as of 3 months after balance sheet date of company i at time t, TA it and NPTL it define total assets and non-pension total liabilities, DBO it is the defined benefit obligation, DBO X,it the non-discretionary component of the DBO, DBO D,it is the discretionary component and NI it is net income before extraordinary items. The I t are dummy variables implemented to account for differences over time.Footnote 19 The general structure of the equations suits the accounting-based valuation framework of Ohlson (Reference Ohlson1995). In addition, we incorporate the following control variables into our model: RD it is the research and development expense, EMP it is the average number of full-time employees during a financial year and LossD it is a dummy variable equal to 1 if the company makes losses and 0 otherwise. All variables apart from EMP it are divided by the total sales. EMP it and RD it are used to account for the service cost anomaly, i.e., the unexpectedly positive relation between service costs and stock price (Barth, et al., Reference Barth, Beaver and Landsman1992). Subramanyam and Zhang (Reference Subramanyam and Zhang2001) demonstrate that the inclusion of EMP it and RD it into the regression equation disposes of this anomaly.Footnote 20
Hann et al. (Reference Hann, Lu and Subramanyam2007) find no evidence that discretion impairs the value relevance of the DBO under US-GAAP. Instead, they find that the discretionary component is value relevant beyond the non-discretionary component. In contrast to the USA, however, pension accounting in Germany was less complex before the mandatory introduction of IFRS for consolidated financial statements in 2005, and for a large part of German companies it still is less complex.Footnote 21 Owing to the transition toward IFRS, pension obligations in Germany – and the scope for discretion – on average increased. However, we believe that many investors in Germany still stick to the traditional German pension regime with less heterogeneity and, therefore, adjust their equity valuations accordingly.
There are two arguments which support our view. First, we refer to Daske et al. (Reference Daske, Hail, Leuz and Verdi2008), who show that only 26.9% of companies have been early voluntary IFRS adopters (and 9.2% late voluntary). Hence, the majority of companies adopted IFRS when they became mandatory in 2005. Therefore, we assume that many investors only started to get acquainted with the complex rules of IAS 19 later. Second, ownership concentration is high in Germany (Leuz et al., Reference Leuz, Nanda and Wysocki2003), i.e., as compared to the USA, there are fewer international investors. Taken together, we conclude that many shareholders of German companies – institutional as well as non-institutional – are lacking experience with IAS 19 in our sample period and therefore rather stick to the traditional, more conservative and well-known German pension regime. Accordingly, we do not expect a significant association between DBO D and MVE and our first hypothesis is:
H1:
The discretionary component DBO D is not value relevant in overall terms in a country with low experience in the complex rules of IAS 19 such as Germany.
3.2.2 Influence of the funded status on the value relevance of DBO D
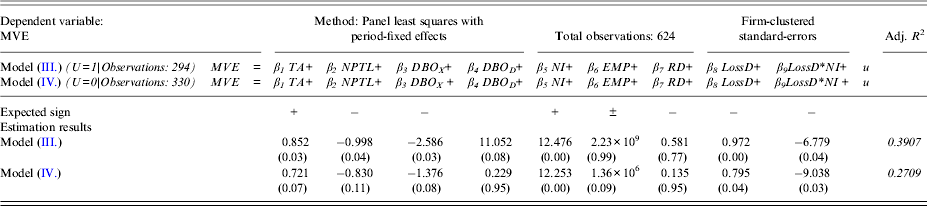
Companies whose plans are strongly underfundedFootnote 22 have, under otherwise equal conditions, stronger incentives to reduce the DBO by an opportunistic choice of actuarial assumptions. This is why we examine in accordance with Hann et al. (Reference Hann, Lu and Subramanyam2007) whether there is a difference with regard to the funded status of the obligations. We define the extent of underfunding as the non-discretionary component of the obligation DBO X less the present value of plan assets (PA), divided by the disclosed DBO. In the following estimation equations (III.) and (IV.), U indicates a dummy variable equal to 1 if the extent of underfunding is above the median of underfunding over all companies, and 0 otherwise. Accordingly, we split our sample in two subsamples and run the regressions (III.) and (IV.) individually.
 $$\eqalign{ MVE_{it} = & \sum {_{t = 2005}^{2011} \,} \alpha _t I_t + \beta _1 TA_{it} + \beta _2 NPTL_{it} + \beta _3 DBO_{X,it} + \beta _4 DBO_{D,it} + \beta _5 NI_{it} \cr & + \beta _6 EMP_{it} + \beta _7 RD_{it} + \beta _8 LOSSD_{it} + \beta _9 LOSSD_{it} \cdot NI_{it} + u_t, \cr & {\rm for}\,\,U_{{\rm it}} = 1.} $$
 $$\eqalign{ MVE_{it} = & \sum {_{t = 2005}^{2011} \,\,} \alpha _t I_t + \beta _1 TA_{it} + \beta _2 NPTL_{it} + \beta _3 DBO_{X,it} + \beta _4 DBO_{D,it} + \beta _5 NI_{it} \cr & + \beta _6 EMP_{it} + \beta _7 RD_{it} + \beta _8 LOSSD_{it} + \beta _9 LOSSD_{it} \cdot NI_{it} + u_t, \cr & {\rm for}\,\,U_{{\rm it}} = 0,} $$
with these equations we are able to test whether the use of discretion of companies with more funded plans is perceived differently from the use of discretion of companies with distinctly underfunded plans. Owing to the stronger incentives for those companies, we expect that the market is very sensitive to this information, which might counterbalance the overall inexperience with IAS 19 (see H1). Therefore, we expect that equity valuations are not adjusted to the traditional, more conservative case here and the discretionary component is incorporated in equity valuations. Accordingly, we hypothesize as follows:
H2:
The discretionary component DBO D is value relevant for companies with distinctly underfunded plans.
3.3 Data description
The empirical analysis is based on a sample which consists of the 160 companies from the main indexes DAX, MDAX, TecDAX and SDAX of the German stock exchange. These indexes comprise the largest and most traded listed German companies, which often serve as benchmarks for smaller entities regarding the application of IFRS regulations.
First of all, in accordance with other studies (see, for example, Leuz et al., Reference Leuz, Nanda and Wysocki2003, Francis and Smith, Reference Francis and Smith2005; Pronobis et al., Reference Pronobis, Schwetzler, Sperling and Zülch2009), we eliminate all banking institutions and insurance companies from the sample, as their balance sheet structure differs fundamentally from the balance sheet structure of other companies, which would seriously affect the comparability of the various entities. The basic data of the remaining 123 companies havebeen extracted from Thomson Reuters Datastream, while the relevant specifications made in the notes concerning the financial assumptions – the discount rates, the rates of compensation growth and future pension increases, etc. – had to be hand-collected for the mentioned reasons. We restrict the main sample for our analysis to the period of 2005–2011 due to the mandatory IFRS-application from 2005 onwards. However, we will provide information on the financial assumptions for the period of 2001–2011 (i.e., including voluntary IFRS adopters) and additionally run robustness tests for this period.
Since the number of companies increases due to new entries into the indexes over the years, we first gain a basis of 777 firm-year observations for our analysis. In a next step, all those observations are eliminated, in which no (or insufficient) specifications were made regarding the pension obligations. We then determined the industry medians i*, g* and r* for the years 2005–2011, using the sector classification provided by the German stock exchange.Footnote 23 We decided to exclude all those sectors to which less than five companies could be countedFootnote 24 since such a small number of companies cannot provide for the determination of reliable medians. In all other sectors, i*, g* and r* are determined for those years in which observations could be gathered for at least five companies. All observations to which this does not apply were also eliminated, resulting in a further reduction of our sample size. Our main sample was thus reduced to 98 companies and 624 firm-year observations. To account for the effects of outliers, both the 0.5- and the 99.5-percentile were winsorized (Tukey, Reference Tukey1962: 18).
4 Results
4.1 Descriptive analysis
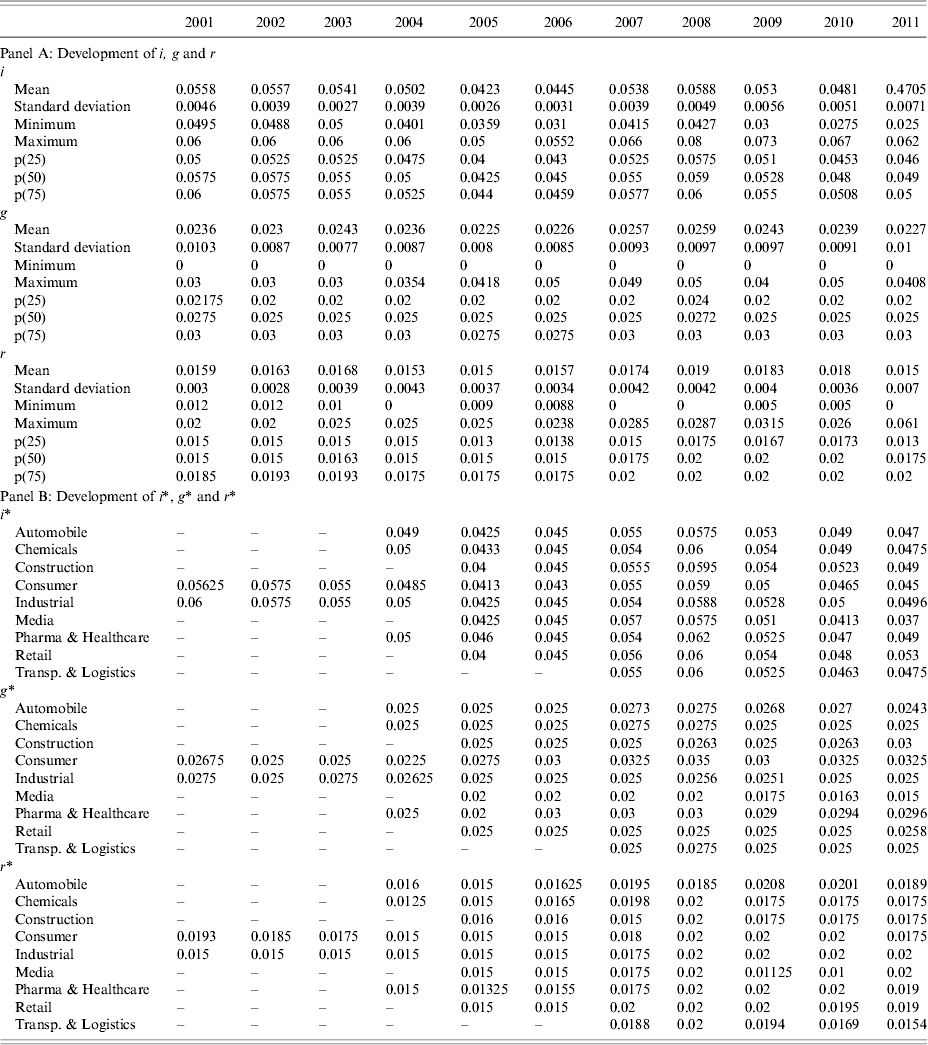
Companies can influence the total sum of the DBO by choosing actuarial assumptions, with higher (lower) interest rate or lower (higher) rate of compensation growth and future pension increases respectively, resulting in a lower (higher) DBO. According to IAS 19.120A (n), each company is obliged to specify the parameters they applied in the notes. Panel A of Table 1 provides an overview of the development of the discount rate (i), the rate of compensation growth (g) and of future pension increases (r). As we want to give a comprehensive overview on the development of these parameters, we aggregated them for all industry sectors over the period 2001–2011, i.e., observations are also considered here which were later excluded from the study due to the marginal representation of individual sectors in the sample or due to the restriction of the main sample used for the regressions to 2005–2011. Not surprisingly, we find that the development of actuarial assumptions to some extent depends on the development of macro-economic conditions.
Development of actuarial parameters

Panel A summarizes information on the discount rate i, the rate of compensation growth g and of future pension increases r over the period 2001–2011.
Panel B presents the median value of those parameters (highlighted with asterisks) differentiated by industry sectors as specified by the German stock exchange.
Focusing on the discount rate i, we can see that the mean value decreases in the first half of the decade reaching a minimum in 2005. Presumably due to the increased volatility at the financial markets as a result of the financial crisis both the mean and the standard deviation of the discount rate increase afterwards. While the mean value has reached the same level as before the crisis in 2010, the standard deviation is still considerably larger in 2010 and 2011. Another indication for the increased heterogeneity in the observations is the increased spread between the maximum and the minimum value from 2008 onwards, presumably also a result of the financial crisis.
With respect to future salary increases g and future pension increases r, we can see an analogous development with the mean of g (r) reaching its minimum in 2005 (2004) and its maximum in 2008 (2008). Taking into account the reverse impact of the discount rate and the future salary/pension increases on the level of the DBO this result is somewhat counterintuitive. Assuming opportunistic behavior of the management, we would expect the discount rate and the future salary/pension increases to develop in opposite directions, i.e., an increase in i is accompanied by a decrease in g/r and vice versa. However, this result is only counterintuitive without taking into account the relative importance of the parameters: as the discount rate has by far the highest impact, it is possible that companies tend to influence the level of the DBO only with the discount rate, i.e., g and r, are of minor importance.
As the interquartile range of i, g and r is small, the conclusion could possibly be drawn that such lack of variability leaves little room for managers to exercise discretion. However, taking into account the impact of a change in the discount rate on the pension obligation, this conclusion might be premature.Footnote 25
Panel B of Table 1 presents the median value of the three parameters differentiated by industry sectors. It must be noted that for the majority of sectors, the number of companies necessary for the determination of the median could only be obtained after the transition to mandatory IFRS accounting in 2005. That is why we restrict our sample for the following analyses to 2005–2011. From this table we learn that there is substantial heterogeneity between industry sectors. Within-industry variation (not depicted in the table) is lower, but far from non-existent. However, heterogeneity per se is not a reason for criticism. Owing to a different structure of the workforce and different specifications of the respective pension plans, certain heterogeneity in the actuarial assumptions is to be expected. So far, we learn that the flexibility granted by IAS 19 is used by the preparers of financial statements.
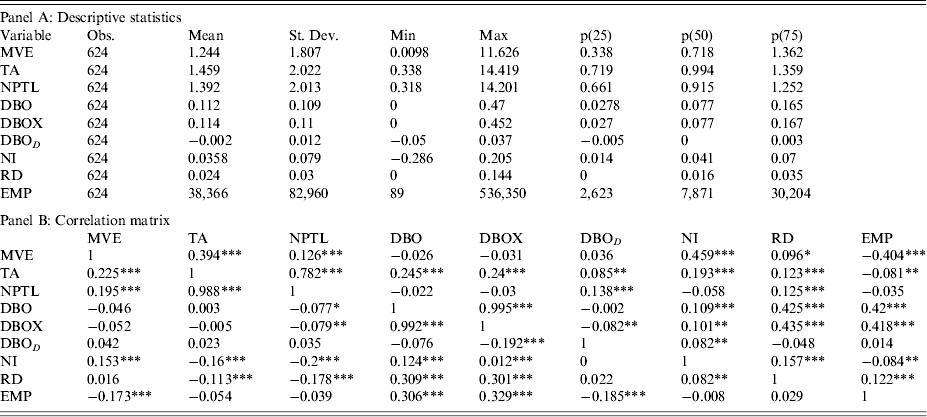
Panel A of Table 2 provides an overview on the main characteristics of our sample, whereas Panel B shows pairwise Pearson (lower triangle) and Spearman (upper triangle) correlations. A formal description of the variables is given below the table. All variables apart from EMP have been standardized by total sales.
Descriptive statistics, correlation matrix and explanation of variables

Panel A provides an overview of the main characteristics of our sample over the period 2005–2011. All variables except for EMP have been divided by beginning total sales. Both the 0.5- and the 99.5-percentile were winsorized to account for outliers.
Panel B shows pairwise Pearson correlations (lower triangle) and pairwise Spearman correlations (upper triangle). ***, ** and * show significance at the 1, 5 and 10% levels, respectively. Variable definitions are as follows:
MVE, market capitalization as of 3 months after balance sheet date of company i at time t; TA, total assets of company i at time t; NPTL, non-pension total liabilities of company i at time t; DBO, defined benefit obligation of company i at time t; DBOX, non-discretionary proportion of DBO of company i at time t; DBO D , discretionary proportion of DBOit of company i at time t; NI, income before extraordinary items of company i at time t; RD, research and development expenses of company i at time t; EMP, average number of full-time employees during a financial year of company i at time t.
Both mean and median (p(50)) for DBO D are negative but low, compared to DBO and DBO X . Serving as reference, Hann et al. (Reference Hann, Lu and Subramanyam2007) find even lower values for their US-American sample, i.e., with mean and median equal to zero for all decimal places displayed. The negative sign indicates that the majority of companies tend to decrease their obligation by choosing actuarial assumptions carefully. However, the magnitude of DBO D indicates that by far the largest part of the DBO cannot be assigned to discretion. From our view, this does not contradict the analysis performed but even increases its value: if we find that the discretionary component is value relevant to the markets, it has to be assessed whether the discretion is used to communicate private information or to opportunistically influence investors. If we fail to find this value relevance this may be due to country-specific characteristics as Hann et al. (Reference Hann, Lu and Subramanyam2007) have shown that the discretionary component is priced in a manner similar to the non-discretionary component under US-GAAP.
When running our regressions, we face multicollinearity with respect to the variables TA and NPTL. Given the fact, that these variables only differ by pension liabilities and the book value of equity this does not come unexpected. However, as multicollinearity does only affect confidence intervalsFootnote 26 and both variables are significant in our regressions, we conclude that multicollinearity is not a problem for our dataset.
4.2 Overall value relevance of the discretionary component
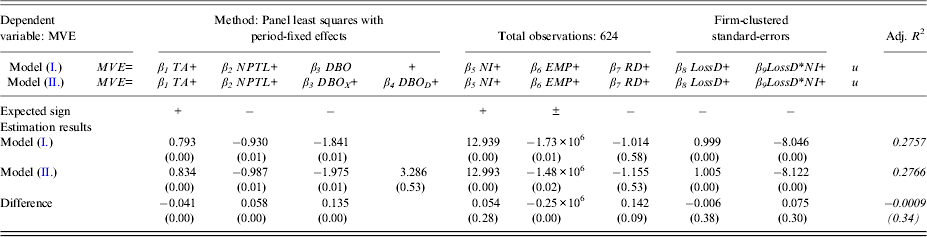
Table 3 summarizes the results of the estimations of models (I.) and (II.). The only difference between these two estimations is that the DBO functions as an independent variable in the first estimation, being disassembled into the non-discretionary component DBO X and the discretionary component DBO D in the second estimation. For reasons of completeness, we depict the differences between the coefficients of model (I.) and model (II.) in the last row. The differences are significant on a common level (except for NI, LossD, and LossD*NI) due to the different model specification. However, both the direction and the level of the coefficients are comparable.

For these estimations we used panel least squares with periodfixed effects and firm-clustered standard errors. For reasons of comprehensibility we do not depict the coefficients for the fixed effects. For variable definitions see Table 2. p-values in parentheses for coefficients and differences are two-sided. The p-value for the difference in Adj. R 2 is based on the Vuong (Reference Vuong1989)-Test. In the last row, we depict the differences of the coefficients of model (I.) and model (II.) for reasons of completeness. These differences are mostly significant due to the different model specification. However, both the direction and the level of the coefficients are comparable.
Most variables in model (I.) point in the expected direction and are significant on a conventional level. RD is insignificant but has not been removed from the regression to account for the service cost anomaly (Barth et al., Reference Barth, Beaver and Landsman1992). For model (II.) the same is true, with one major difference: the decomposition of the DBO reveals that only the non-discretionary part of the DBO, DBO X , is significant. The coefficient of DBO D is higher than the coefficient of DBO X , i.e., the discretionary part of the DBO tends to influence MVE positively. However, as the coefficient is insignificant, we conclude that the discretionary component is not value relevant in overall terms.
The missing value relevance in overall terms is in contrast to Hann et al. (Reference Hann, Lu and Subramanyam2007) who find that – under US-GAAP – the discretionary component is incrementally priced by the market in a manner similar to the non-discretionary component. As the rules for pension accounting are comparable between US-GAAP and IFRS, we conclude that there are country-specific characteristics which drive this deviation.
From our point of view, characteristics driving the result are as follows: German investors are not experienced with the complex rules of pension accounting under IAS 19, as pension accounting was less complex in Germany before the introduction of IFRS for listed companies in 2005 and, hence, adjust their equity valuations accordingly. Taken together, our first hypothesis H1 is supported by the results.
To compare the two models we take a look at the adjusted R 2. At 27.66%, it is marginally higher for model (II.) than it is for model (I.) at 27.57%. However, there are various econometric difficulties inherent in the simple comparison of the adjusted R 2 of two models (Greene, Reference Greene2003: 152–159 and Kennedy, Reference Kennedy2008: 87–88). We thus controlled whether the difference between the adjusted R 2 is significant on a common level by applying the Vuong (Reference Vuong1989) test, summarizing the result in the last column of the differences row. Therefore, a superiority of model (II.) over model (I.) in a statistical sense cannot be observed – due to the insignificance of DBO D , this was to be expected.
4.3 Influence of the funded status on the value relevance of DBOD
The incentives to (downwardly) manipulate the total sum of pension obligations by a careful choice of actuarial assumptions increase in correspondence with the underfunding of plans.Footnote 27 We used model (III.) and model (IV.) to verify the hypothesis that the discretionary component DBO D is value relevant for companies with distinctly underfunded plans (H2). The results are presented in Table 4. U is a dummy variable equal to 1 if the extent of underfunding of company i at time t is above the median of underfunding over all companies. Accordingly, we have split our sample into two subsamples, one including companies with distinctly underfunded plans and the other including the remainder.

For these estimations we used panel least squares with periodfixed effects and firm-clustered standard errors. For reasons of comprehensibility we do not depict the coefficients for the fixed effects. For variable definitions see Table 2. p-values in parentheses for coefficients and differences are two-sided. We have split our sample into two parts depending on the degree of underfunding. U is a dummy variable equal to 1 if the extent of underfunding of company i at time t is above the median of underfunding over all companies and 0 otherwise.
In general, both regressions suffer from the fact that fewer observations are used. However, with regard to model (III.), all variables (except for RD) are significant. Interestingly, the coefficient for DBO D is significant on the 10% level. On the contrary, the coefficient for DBO D is insignificant for model (IV.), i.e., in cases where U is 0 and the pension obligations are less underfunded. Therefore, we conclude that discretion in the determination of the DBO is priced for companies with distinctly underfunded plans and our second hypothesis is supported. However, the coefficient for DBO D in model (III.) is positive, i.e., a discretionary increase (decrease) in the overall obligation is accompanied by an increase (decrease) in market value of equity. As an increased obligation results in higher (expected) future cash outflows and vice versa, this result is somewhat counterintuitive. A possible explanation is that investors cherish a more conservative estimation and punish a discretionary decrease of the overall obligation which is in accordance with the traditional, more conservative accounting regime in Germany.
4.4 Robustness
As market value of equity is driven in large extent by growth opportunities, we separately incorporated 1-year, 3-year and year sales growth into our regression models (not depicted). These variables were all insignificant and did not improve our models. The insignificance of sales growth is surprising. However, we believe that the insignificance is driven by collinearity issues and therefore decided to present our results for the regressions without sales growth.
We restricted our sample to the period of 2005–2011 due to the mandatory IFRS-adoption for fiscal years beginning in 2005. As a robustness check, we included the years 2001–2004 (i.e., the voluntary IFRS-adopters) in our analysis and obtain qualitatively similar results. The same applies for estimations without the adoption period 2005 and for estimations without winsorized data.
The validity of our results is strongly dependent on the functional determination of DBO D which is certainly not altogether free of mistakes. We are forced to make assumptions that influence the amount of DBO D , particularly the fundamental assumption that the scope of discretion might be determined by a deviation from the industry median, as well as the assumptions regarding life expectancy (L) and the average years to retirement (N). Thus, estimating the life expectancy after retirement to a general 18 years is an extreme simplification. Insofar as there are differences between the various companies under observation (and undoubtedly there are), DBO D must be flawed. Also, the estimator of the years to retirement N is based on assumptions, again distorting the determination of the ‘true’ discretionary component.
For this reason we estimated another regression based on Hann et al. (Reference Hann, Lu and Subramanyam2007), identifying the proportion of DBO D which can be deduced from the difference between the disclosed actuarial assumptions and the respective industry medians:
 $$\displaystyle{{DBO_{D,it}} \over {DBO_{it}}} = \alpha + \beta _1 (i_{it} - i_{it}^* ) + \beta _2 (g_{it} - g_{it}^* ) + \beta _3 (r_{it} - r_{it}^* ) + u_{it}. $$
Table 5 summarizes the results of this estimation. For the estimation of this model, we restricted our sample to those observations that have complete data for i, g and r. The coefficients are significant and point in the expected direction. Furthermore, the value of Adj. R 2 (0.8365) is of interest. It indicates that the significantly largest part of DBO D,it /DBO it can be ascribed to deviations between the disclosed i, g and r and the industry medians (i*, g* and r*). This result demonstrates that in this context flawed assumptions about L and N have less influence on the determination of DBO D . DBO D is mainly driven by the deviations between the companies’ actuarial assumptions and the respective industry medians.
Estimation results of model (V.)

The validity of our results is strongly dependent on the functional deviation of that part of the DBO that we ascribe to discretion. For this reason we estimated model V., the dependent variable being the discretionary DBO divided by the total amount of the disclosed DBO. As explanatory variables we used the deviations between the company-specific actuarial assumptions and the industry medians.
However, we do not want to conceal two further simplifications, which may lead to erroneous measurements and flawed specifications: First, in the case of companies providing both domestic and foreign pension plans, we assumed that the foreign pension plans are of minor importance. Thus the determination of the scope of discretion in the DBO is only based on domestic actuarial assumptions, regardless of the fact that foreign assumptions might also play a role. We justify this means however by the observation that only a very small proportion of companies has foreign pension obligations, and that these are significantly lower than the domestic ones. Second, regarding the specifications disclosed in the notes, it should be stressed that interest rates as well as the rates of compensation growth and future pension increases are, contrary to the regulations of IAS 19.120A (n), not always provided in absolute percentages. Some companies rather present a certain spread for the respective parameters. However, as these spreads are small, we simply assume that the mean of these spreads represents the true value of the respective assumptions. This then is incorporated in the determination of both, the industry medians and DBO D .
5 Conclusion
There is a lot of disagreement as to the scope of flexibility a management should be allowed in their drawing up of IFRS statements. On the one hand, it is argued that discretion may serve to better communicate company internal information to the statement addressees. Others believe that discretion might be used to manipulate the balance sheet structure and the earnings and, hence, accounting standards should rather ensure uniform financial statements. The accounting for pensions and in particular the determination of the DBO is interesting for this question for two reasons: First, pensions have significant influence on the balance sheet of companies and second, there exists an extensive room for discretion in the determination of the DBO.Footnote 28 In this present study, we identify that component of the DBO which cannot be ascribed to discretion by replacing the essential actuarial assumptions – discount rate, rate of compensation growth and projected future pension increases – with their respective industry medians. In calculating the difference between the non-discretionary component and the disclosed DBO, we obtain that component which we ascribe to discretion.
Prior research (Hann et al., Reference Hann, Lu and Subramanyam2007) yields the result that the discretionary component of the DBO contains value relevant information and hence advocates keeping the flexibility within pension accounting. On the contrary, we hypothesize that the discretionary component DBO D is not value relevant in Germany. We justify this hypothesis by the fact that pension accounting in Germany was less complex before the mandatory introduction of IFRS for consolidated financial statements in 2005. Hence, we hypothesize that investors in German companies are less experienced with IAS 19 and therefore adjust their equity valuations to reflect the traditional, more conservative German pension regime. Based on the Ohlson (Reference Ohlson1995) link between accounting data and firm value, we run two different regression models – one is excluding and one is including DBO D , which support our hypothesis as we find that DBO D is not value relevant in overall terms.
Furthermore, we analyze whether the degree of underfunding moderates investor's perception and their equity valuations. We hypothesize that investors are very sensitive to pension information for companies with distinctly underfunded plans, which might counterbalance the overall inexperience with IAS 19 for those companies. As DBO D is (borderline) significant for those companies, we find weak evidence that supports this hypothesis. The sign of DBO D is positive for this regression, indicating that an increase (decrease) in the obligation results in a higher (lower) equity valuation. A possible explanation is that the markets cherish a more conservative estimation and punish a more aggressive estimation of the overall obligation.
The contribution of our study to accounting knowledge is twofold: First, we provide comprehensive information on the development of actuarial assumptions in Germany over the past decade. Second, we contribute to the discussion of uniformity versus flexibility in financial reporting with a country-specific result contradicting prior research (Hann et al., Reference Hann, Lu and Subramanyam2007) for Germany. Our results indicate that the increased flexibility of IAS 19 as compared to pension accounting regulations under German GAAP does not necessarily enhance the decision-usefulness of financial statements. Only for distinctly underfunded pension plans, investors seem to process the difference between the individual actuarial assumption and the industry's median in their equity valuations. However, as the flexibility of IAS 19 also has some disadvantages, namely those created by management's opportunistic behavior, the standardsetter should consider the experience of German companies with a discount rate prescribed by a federal authority as part of a fundamental review of pension and related benefits.Footnote 29 Furthermore, it should be investigated if our results are robust for other countries applying IFRS and if flexibility may become worthwhile in a manner similar to the USA when investors gain more experience with the complex rules of IAS 19.
Acknowledgements
We appreciate the helpful and beneficial comments of Hartmut Engbroks, chairman of the Professional Association of Mathematics Experts of the ‘Arbeitsgemeinschaft für betriebliche Altersversorgung e.V.’ (‘Commission for Company Pension Schemes’), of participants of the EAA 2011 Annual Meeting in Rome and of participants of the 2nd WHU Doctoral Program in Accounting Research at Vallendar. We thank David Leuwer for research assistance. Marcus Salewski acknowledges financial support from the Ernst & Young Foundation, Germany.