Introduction
The avifauna of the Democratic Republic of Congo (DRC) is rich, with more than 1,100 bird species, the highest number for any African country. However, many parts of DRC are poorly explored ornithologically, and the distribution and populations of many bird species are still not known well (Louette and Mulotwa Reference Louette, Mulotwa, DellaSala and Goldstein2022). Forest-dwelling Galliformes are shy and difficult to observe in the field, and various methods have been used to detect their presence, model distribution and assess densities (Johnsgard Reference Johnsgard1988; Del Hoyo et al. Reference Del Hoyo, Elliott and Sargatal1994; Johnsgard Reference Johnsgard1999; Soldatini et al. Reference Soldatini, Pellizzi and Albores-Barajas2012; Dunn Reference Dunn2014; Bagaria et al. Reference Bagaria, Thapa, Sharma, Joshi, Singh, Sharma, Sarma, Thakur and Chandra2021). Of 1,874 articles on Galliformes, only 2.1% cover African species and most studies were from the Western hemisphere (Tian et al. Reference Tian, Xu, Li, Zhang and Wang2018).
In this paper, we present data on two little-known species of African Galliformes, Congo Peafowl Afropavo congensis and Forest Francolin Peliperdix lathami, in the Lomako Yokokala Faunal Reserve (LYFR) based on call playback to detect their presence. We were informed about the presence of the Congo Peafowl in LYFR by J. Dupain. During Bonobo Pan paniscus surveys in 1994–1996, Dupain and a colleague had 12 encounters of this bird during 14 months of fieldwork north of the Lomako River and along the Yokokala River (Dupain and van Krunkelsven Reference Dupain and Van Krunkelsven1996). The enigmatic Congo Peafowl, described in 1936 (Chapin Reference Chapin1936), is endemic to DRC and has a limited global range in central and eastern DRC (Louette and Mulotwa Reference Louette, Mulotwa, DellaSala and Goldstein2022). The Forest Francolin is another Afrotropical forest species with a much wider distribution from West Africa to Sudan and Tanzania (Urban et al. Reference Urban, Hilary, Keith, Woodcock and Willis1986; Del Hoyo et al. Reference Del Hoyo, Elliott and Sargatal1994), and the eastern race schubotzi is overlapping in range with Congo Peafowl in the central Guinea-Congo basin.
Various methods have been used to determine the presence or absence of Congo Peafowl and, in some cases, to estimate its density, such as conducting interviews with local hunters (Hart and Upoki Reference Hart and Upoki1997), transect counts and using droppings and feathers (Mulotwa et al. Reference Mulotwa, Louette, Dudu, Upoki and Fuller2010) as well as camera trapping and direct observations (Hart and Upoki Reference Hart and Upoki1997; Mulotwa et al. Reference Mulotwa, Louette, Dudu, Upoki and Fuller2010; Bessone et al. Reference Bessone, Hühl, Hohmann, Herbinger, N’Goran and Asanzi2020; Jocque et al. Reference Jocque, Mertens, Jamie, Jones, Mbende, Nunes and Pett2023). To our knowledge, targeted density studies have not previously been undertaken for the Forest Francolin.
Playback is widely used to survey Galliformes (Tian et al. Reference Tian, Xu, Li, Zhang and Wang2018), and is a well-known method used to detect especially nocturnal or elusive species (Johnson et al. Reference Johnson, Brown, Haight and Simpson1981; Chávez-León Reference Chávez-León, Eitniear, Baccus, Dingle and Carroll2004; Vrezec and Bertoncelj Reference Vrezec and Bertoncelj2018; Orlando et al. Reference Orlando, Varesio and Chamberlain2021) and should also be used with care to reduce disturbance (Sibley Reference Sibley2011). It has been used to assess the conservation status of Nahanʼs Francolin in Uganda and the Udzungwa Forest Partridge in Tanzania (Fuller et al. Reference Fuller, Akite, Amuno, Fuller, Ofwono, Proaktor and Ssemmanda2012; Dinesen et al. Reference Dinesen, Pagh, Sonne, Levinsky and Mulungu2023); both are globally threatened forest Galliformes. Playback methods have not previously been tested and used in systematic surveys of the Congo Peafowl and Forest Francolin, which are both notoriously shy and difficult to detect (Fishpool and Evans Reference Fishpool and Evans2001; McGowan et al. Reference McGowan, Kirwan, Sharpe, del Hoyo, Elliott, Sargatal, Christie and de Juana2020; McGowan and Kirwan Reference McGowan, Kirwan, del Hoyo, Elliott, Sargatal, Christie and de Juana2020). Here we present the results of our field studies and data collection on the two species in LYFR in August 2023, July and August 2024 and July and August 2025.
Methods
Field site
We conducted our studies at the research camp of Iyema within LYFR (Figure 1), at 0°55′22″ N, 21°6′3″ E, run by the Antwerp Zoo Foundation (AZF) in collaboration with the Institut Congolais pour la Conservation de la Nature (ICCN). LYFR was established as a Faunal Reserve in 2006 and covers 3,625 km2 (Sakamaki et al. Reference Sakamaki, Mashini and Dupain2020). The reserve has been a well-known study site for Bonobos since 1974 (Badrian and Badrian Reference Badrian and Badrian1977; Dupain and van Krunkelsven Reference Dupain and Van Krunkelsven1996; Dupain et al. Reference Dupain, Van Krunkelsven, Van Elsacker and Verheyen2000; Sakamaki et al. Reference Sakamaki, Mashini and Dupain2020, Reference Sakamaki, Mtowasekye, Lompwanga and Dupain2025). It is situated between the Lomako River in the south and the Yokokala River in the north. Both rivers flow into the Maringa River (Sakamaki et al. Reference Sakamaki, Mashini and Dupain2020), a tributary to the Congo River. The area has an average altitude of 400 m above sea level (Boubli et al. Reference Boubli, Eriksson, Wich, Hohmann and Fruth2004) and soils of sedimentary origin comprising limestone, clay, sand, and gravel and dissected by a network of water courses (Fruth Reference Fruth1995). Mean annual rainfall for the region is above 2,000 mm with approximately 10 wet months and a drier period in January to March (Fruth Reference Fruth1995; Demey and Louette Reference Demey, Louette, Fishpool and Evans2001).
The location of the Lomako Yokokala Faunal Reserve in DRC (top left) and the Lyema study site (bottom left). To the right the location of the playback points in the study site around Lyema and the responding Congo Peafowl Afropavo congensis (grey dots) and Forest Francolin Peliperdix lathami (red dots) or both (black dots).

Figure 1. Long description
Panel 1 (Top-Left): A map of the Democratic Republic of the Congo showing provincial borders. A grey shaded area highlights Prov. Mongala and Prov. Tshuapa. A small red rectangle indicates the study area within these provinces.Panel 2 (Bottom-Left): A zoomed-in map of the study area. It features the Yokokala river to the North and the Lomako river to the South. A dashed line marks the Lomako Yokokala Faunal Reserve border. A circle represents Lingunda village and a triangle represents Iyema camp. A 20 k m scale bar is provided.Panel 3 (Right): A large scatter plot representing the area within the red rectangle from the previous maps. The Y-axis represents latitude from 0.86 to 0.94, and the X-axis represents longitude from 21.02 to 21.14. A 2.5 k m scale bar is at the bottom right. The plot contains circular data points categorized by a legend: red circles for Forest Francolin, light blue circles for Congo Peafowl, dark blue circles for Both species, and white circles for no response.Data distribution:- In the Southwest (bottom-left), there is a linear cluster of points following a path, mostly consisting of white and red circles with two dark blue points.- In the Northeast (top-right), there is a dense, roughly rectangular cluster of points. This area shows a high concentration of red circles (Forest Francolin) interspersed with light blue (Congo Peafowl) and dark blue (Both species) points.- Iyema camp (white triangle) is located in the upper-middle section of this dense cluster near longitude 21.10 and latitude 0.92.
1. Top-left panel: A map of the Democratic Republic of the Congo showing provincial borders. A red rectangle highlights the study area within the shaded Tshuapa and Mongala provinces.
2. Bottom-left panel: A zoomed-in map of the Lomako Yokokala Faunal Reserve. It shows the Yokokala river to the North and the Lomako river to the South. A red rectangle identifies the Iyema study site. A scale bar indicates 20 km. Symbols include a circle for Lingunda village and a triangle for Iyema camp.
3. Right panel: A large-scale map of the Lyema study site playback points. The Y-axis represents latitude from 0.86 to 0.94, and the X-axis represents longitude from 21.02 to 21.14. A scale bar indicates 2.5 km. The map features numerous circular data points representing species responding to playbacks:
* Red dots: Forest Francolin.
* Grey dots: Congo Peafowl.
* Black dots: Both species.
* White dots: No response recorded.
The forest is part of the large Guinea-Congo basin comprising mixed moist semi-evergreen forest interspersed with swamp forest and riparian forest (White Reference White1983; Dupain et al. Reference Dupain, Van Krunkelsven, Van Elsacker and Verheyen2000). Four distinct forest types were recognised in the reserve (Fruth Reference Fruth1995, Boubli et al. Reference Boubli, Eriksson, Wich, Hohmann and Fruth2004): 1) mixed primary forest with a canopy of 30–40 m and emergent trees >40 m (57% of the reserve). 2) Primary forest dominated by Gilbertiodendron dewevrei (22%) with a homogenous canopy of 30–40 m and varied understory vegetation, 3) secondary forest (9%), comprising former human agricultural fields and 4) swamp and temporarily inundated forest (12%). The LYFR is managed by ICCN staff, supported by AZF, and conducts systematic monitoring patrols with a focus on biological monitoring, law enforcement, and community outreach. ICCN have focused on four species: Bonobos, Elephant Loxodonta cyclotis, Bongo Tragelaphus eurycerus and Congo Peafowl. There are indications of an increase in encounter rates of most mammals as a response to enhanced management (Sakamaki et al. Reference Sakamaki, Mtowasekye, Lompwanga and Dupain2025).
Data collection
We used playback from point counts and collected response data for analysis using a network of trails cut and maintained for Bonobo surveys (Sakamaki Reference Sakamaki2023). The trails constituted narrow walking paths, which generally meant no cutting of vegetation was necessary during the survey. The points were located by GPS in the field and spaced a minimum of 400 m apart to avoid double-counting and correspond to a reliable detection distance (see Figure 1, also Soldatini et al. Reference Soldatini, Pellizzi and Albores-Barajas2012; Orlando et al. Reference Orlando, Varesio and Chamberlain2021). In cases where birds were responding at distances further away than 200 m, we were reluctant to include calling individuals at this distance at the subsequent point to avoid double counting. We moved at night (see later) as a team of four (LD, MD and two guides) in 2023 and a team of two (MD and a guide) in 2024 and in a team of five (LD, MD and three guides or guides alone) in 2025 and switched off our torches and mobile phones at the points during the playback sessions.
At each point, the call of Congo Peafowl was played for approximately 1 minute, followed by 1 minute of silence, and then repeated for another 1 minute, followed by 1 minute of silence, after which the call of Forest Francolin was played for half a minute, followed by half a minute of silence. Any responding individual within the whole 5-minute playback session was recorded, and the distance to the calling location was estimated. The playback protocols of the two species differed because we detected differences in responses during initial testing. Forest Francolin usually responded promptly while Congo Peafowl sometimes reacted with a delay in responding.
Birds of both species responded from their night roosts in trees (see Figure 2), which also meant that the bias that birds are moving towards the observers during playback was eliminated. Playback of other forest-dwelling Galliformes in Africa has been conducted during daytime (Fuller et al. Reference Fuller, Akite, Amuno, Fuller, Ofwono, Proaktor and Ssemmanda2012; Dinesen et al. Reference Dinesen, Pagh, Sonne, Levinsky and Mulungu2023) or Himalayan Galliformes (e.g. Jolli et al. Reference Jolli, Srivastav and Thakur2012), or species in the Neotropics (e.g. Chávez-León Reference Chávez-León, Eitniear, Baccus, Dingle and Carroll2004). However, in this study, we collected data after sunset from 19h00 to 03h00, after an initial trial. Fieldwork with the aim of collecting data from playback points was conducted between 13 and 28 August 2023 and 22 July and 16 August 2024. Raw data from the playback points are provided in the Supplementary material Dataset S1. Moreover, LD and MD returned in 2025 (28 July to 21 August) and attempted to catch two birds to attach a radio tag but failed. In 2025, playback of Congo Peafowl was undertaken at 16 nights, and groups located at their calling locations, and group size and sex ratio were noted when possible.
Pair of Congo Peafowl and family group of Forest Francolin in LYFR, August 2023 approximately 17 m and 8 m above the ground respectively. Photo credit: Cedric Muliri.

The calls of the Forest Francolin (Boesman Reference Boesman2022) and the duetting call of the Congo Peafowl (Kuchenbuch Reference Kuchenbuchn.d.) were downloaded from xeno-canto www.xeno-canto.org. In the 2024 and 2025 surveys, new recordings were uploaded to xeno-canto: Congo Peafowl (XC894811, XC894816) and Forest Francolin (XC952847). We used loudspeakers from a radio to amplify the recording on our mobile phone. We used a Garmin Trex 20 and a Garmin GPSMAP 64x for locating points and measurement of altitude.
We undertook counts on 10 nights in 2023 and conducted playback at 61 different points making use of the full length of the pre-prepared Bonobo trail network generally working on a specific section of the trail system then moving to the next session on a subsequent night. Points were located before embarking on fieldwork and then adjusted in the field if a trail was blocked by vegetation or water. In a similar survey in 2024, playback sessions were conducted on 18 nights, as in the 2023 survey, and in the 2024 survey, playback sessions were also undertaken 15 km from the original study site parallel to Lomako River. In 2025, random playback sessions were undertaken for Congo Peafowl only to locate and observe the groups of birds. We took note on six groups that were located by guides and individuals were identified to get an impression of the average number of individuals of Congo Peafowl and sex ratio at a calling location.
Density estimations
Points situated within 200 m of each other were eventually omitted in the analysis. However, three points from the 2024 survey had identical geographic coordinates to point samples from the 2023 survey and were included as resurveys. Hence, a total of 93 samples from 90 unique point localities were used for data analysis.
Individuals tend to respond over distances above 50 metres, making estimates of exact distances to the calling locations uncertain. At the same time, Congo Peafowl detections quickly declined beyond 200 m. For this reason, we abandoned the fitting of detection functions and instead calculated densities within binned distance bands from the sampling points, estimating density within one band at a time, using both frequentist and Bayesian approaches. A maximum of 2 calling locations were detected per point count (the second location was always further away than the first). Within a chosen distance band, the number of birds detected per point count was modelled as a Poisson process, with the rate parameter (λ) estimated as the total number of calling localities within the distance band (k) divided by the number of sampling points (T = 93). Estimated rates were converted to densities by dividing by the area of the distance annulus in hectares. In the frequentist approach, the 95% confidence intervals were derived using the chi-square distribution for the Poisson mean (i.e. total number of calling localities) and then divided by T.
With relatively few detections per species, the frequentist confidence intervals derived from chi-square approximations can be unreliable. Thus, in addition to the frequentist estimates, we used a Bayesian Gamma–Poisson model to quantify uncertainty in the Poisson rate parameter λ. We used a flat prior for the Gamma distribution (α0 = 1, β0 = 0), ensuring that posterior estimates are dominated by the observed data rather than prior assumptions. The resulting 95% credible interval for λ reflects the uncertainty in the rate parameter given the observed data: under the model, there is a 95% posterior probability that the true density lies within these bounds.
Results
Congo Peafowl responded to playback at 19 of 93 points (Figure 1, 24 records used for analysis). In several cases, the heard response was a duet between a male and a female, and it was difficult to determine whether more birds were vocal. At six points, birds were responding to playback from two different calling locations. Outside the systematic census, birds were observed in 2023 and 2025 at six calling locations, after detection via repeated playback and torches, and their sex was identified. These records included one single male, three pairs, a group of three males and two females, as well as a group of eight birds, including five males and one female, and two of unidentified sex. Altogether 36 call responses from call locations (including responses recorded by the ranger with his team without us) were recorded in 2025 including, for the first time, responses from birds at three different, widely distributed calling locations.
The Forest Francolin responded to playback at 49 out of 93 points (51 records used for analysis). All responses were the advertisement call from a single male, sometimes prompting another male within hearing distance to respond. At 9 points, two calling males were responding from different locations. On one occasion, birds were located by torches and comprised a family group of a male, female and an immature bird roosting shoulder to shoulder on a twig 8 m above the forest floor (Figure 2).
Densities
The Bayesian density estimate for the 50–175 m distance band showed the narrowest confidence intervals for Congo Peafowl, averaging 2.8 calling locations per km² (95% CI: 1.8–4.1, Figure 3, Supplementary material Table S1). At larger distances (> 125 m), the density was lower, and no peafowl responded closer than an estimated 50 m. The equivalent density of Forest Francolin was 5.6 males (95% CI: 4.1–7.3) per km2 for the same distance band (50–175 m, Figure 3, Supplementary material Table S2).
The frequency of responding individuals of Congo Peafowl Afropavo congensis from calling locations and Forest Francolin Peliperdix lathami and their estimated distance from the point of playback.

Figure 3. Long description
A multi-panel histogram with a shared x-axis labeled Distance metres ranging from 0 to 250 and a shared y-axis labeled Frequency.
* Top Panel: Congo Peafowl. This histogram uses red bars. The y-axis ranges from 0 to 6. Data is concentrated between 50 and 175 metres, with a peak frequency of 6 at approximately 110 metres. Three vertical dashed red lines are positioned at 50, 125, and 175 metres. A small secondary cluster of 2 individuals appears at 210 metres.
* Bottom Panel: Forest Francolin. This histogram uses blue-grey bars. The y-axis ranges from 0 to 15. Data is more widely dispersed across the x-axis. Three vertical dashed blue lines are positioned at 50, 125, and 175 metres. Significant peaks occur at 160 metres with a frequency of 10 and a primary peak at 210 metres with a frequency of 15. Smaller frequencies are recorded between 25 and 125 metres and at the 250-metre mark.
There was no significant association between occurrences of Forest Francolin and Congo Peafowl in the point records (χ² = 0.27, df = 2, P = 0.87). We had very few responding individuals of both species, fewer than an estimated 50 m away from the observers (see Figure 3), indicating that birds chose to keep silent close to the survey point. The bias described by Fuller et al. (Reference Fuller, Akite, Amuno, Fuller, Ofwono, Proaktor and Ssemmanda2012) and others that birds move towards the observer before responding, resulting in considerable overestimation of their numbers, do not apply in this study because birds remained in their night roosting locations. On a couple of occasions peafowl were detected in the evening and revisited hours later in the night or the next early morning and found in the same roosting tree confirming the assumption that they are not moving from their night roost before dawn (unless disturbed).
Time
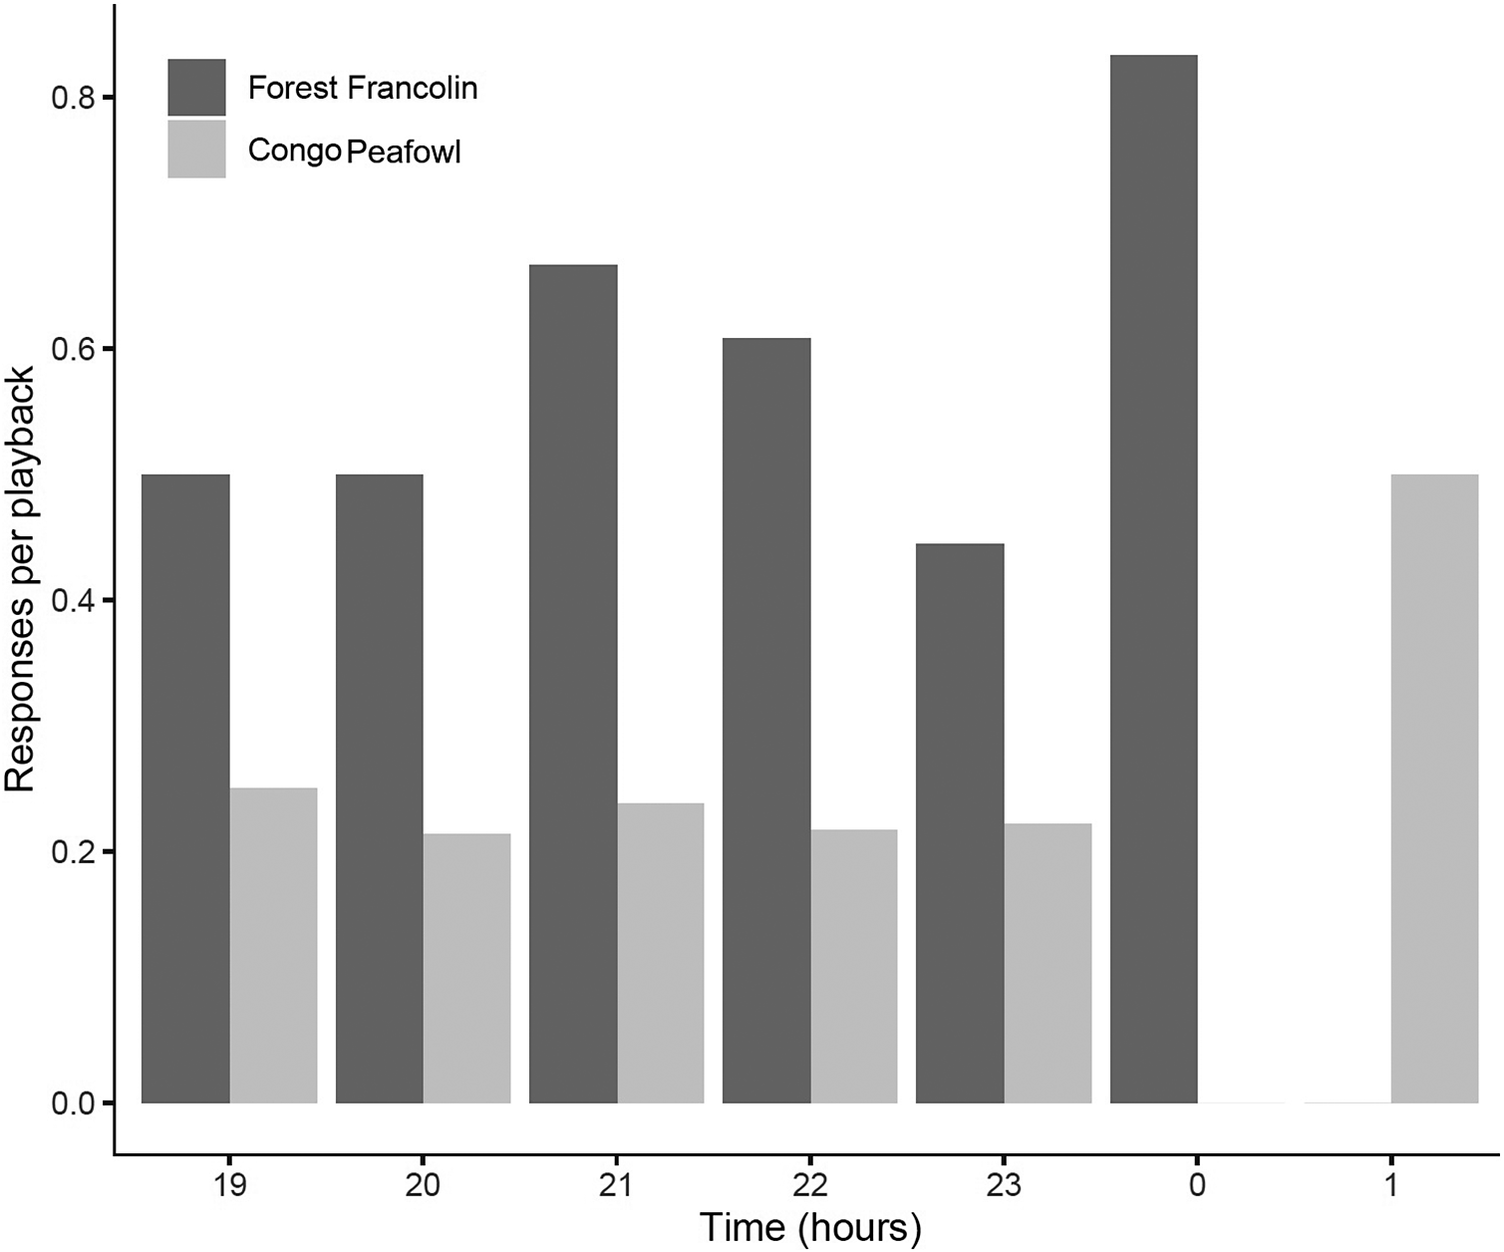
Birds of both species responded throughout the census period between 19h00 and 03h00 (Figure 4). There was no significant tendency to respond more frequently during the first 3 hours of survey time than later (for Forest Francolin: χ² = 0.23, df = 1, P = 0.65; for Congo Peafowl: χ² = 0.02, df = 1, P = 0.88, both with Yates’ correction for continuity).
Response rate (birds per playback session) of Forest Francolin and Congo Peafowl from their night roosts, by hour of the night.

Figure 4. Long description
The y-axis is labeled Responses per playback with a scale from 0.0 to 0.8. The x-axis is labeled Time in hours with intervals at 19, 20, 21, 22, 23, 0, and 1. A legend at the top left identifies dark gray bars as Forest Francolin and light gray bars as Congo Peafowl.Data points by hour:* At 19: Forest Francolin is at 0.5 and Congo Peafowl is at 0.25.* At 20: Forest Francolin is at 0.5 and Congo Peafowl is at 0.22.* At 21: Forest Francolin increases to approximately 0.66 and Congo Peafowl is at 0.24.* At 22: Forest Francolin is at 0.61 and Congo Peafowl is at 0.22.* At 23: Forest Francolin is at 0.45 and Congo Peafowl is at 0.22.* At 0: Forest Francolin reaches its peak at approximately 0.83 while Congo Peafowl has no recorded response.* At 1: Forest Francolin has no recorded response while Congo Peafowl reaches its peak at 0.5.
* At 19 hours, Forest Francolin is at 0.5 and Congo Peacock is at 0.25.
* At 20 hours, Forest Francolin remains at 0.5 while Congo Peacock drops slightly to 0.22.
* At 21 hours, Forest Francolin increases to approximately 0.67 and Congo Peacock rises to 0.24.
* At 22 hours, Forest Francolin decreases to 0.61 and Congo Peacock drops to 0.22.
* At 23 hours, Forest Francolin drops to 0.45 and Congo Peacock rises slightly to 0.23.
* At 0 hours, Forest Francolin reaches its peak at approximately 0.83 while Congo Peacock has no recorded response.
* At 1 hour, Forest Francolin has no recorded response while Congo Peacock reaches 0.5.
Discussion
Playback proved to be a reliable method to detect Congo Peafowl and Forest Francolin in LYFR, but it was unexpected that birds of both species responded from their night roosts in trees. Both species are shy and difficult to detect, and playback proved an efficient way to collect data on their occurrence and densities. Our playback survey was conducted within mixed primary forest, which we assume is a key habitat for the two species in LYFR (Hart and Upoki Reference Hart and Upoki1997; Fuller and Garson Reference Fuller and Garson2000; Louette and Mulotwa Reference Louette, Mulotwa, DellaSala and Goldstein2022; see also Mulotwa et al. Reference Mulotwa, Louette, Dudu, Upoki and Fuller2010), which according to (Boubli et al. Reference Boubli, Eriksson, Wich, Hohmann and Fruth2004) comprises 57% of the area in LYFR (equivalent to more than 2,000 km2).
Density estimates
The density estimated for Congo Peafowl using the lowest confidence interval was 2.8 (95% CI: 1.8–4.1) calling locations per km2 in the distance band of 50–175 m of responding birds to the observers. Each calling locality is expected to comprise a male, a duetting pair, or, in some cases, a larger group, and our observations may indicate a loose “flock” structure. Our own observations of six groups suggested a group size of 1 to 8 birds. In a study in Salonga National Park (Louette and Mulotwa Reference Louette, Mulotwa, DellaSala and Goldstein2022), undertaking transect counts and sightings or other indications of its presence, Congo Peafowl densities were estimated to be 2.4–2.8 individuals km-2 in secondary forest and 1.1–1.4 individuals km-2 in primary forest. In another study in Salonga using camera traps, densities were estimated at 0.9 (0.66–1.27) individuals km-2 (Bessone et al. Reference Bessone, Hühl, Hohmann, Herbinger, N’Goran and Asanzi2020). We do not have enough data to estimate the average number of birds at a calling locality, however, with groups of up to eight birds, the density of birds in LYFR is judged to be considerably higher compared to Salonga estimates. Moreover, we regard the Congo Peafowl to occur throughout LYFR (see Supplementary material Figure S1), based on frequent ICCN tracking between December 2015 and August 2025 covering the entire reserve but with the least tracking in the northeastern part, and for that reason we believe that the reserve supports a large and viable population of the Congo Peafowl.
Playback proved efficient at detecting Forest Francolin and yielded dramatically higher detection rates, as shown by non-systematic visual surveys in the same area or in Salonga (Van Beirs Reference Van Beirs2017; Jocque et al. Reference Jocque, Mertens, Jamie, Jones, Mbende, Nunes and Pett2023). The density estimate of 5.6 (95% CI: 4.1–7.3) calling males per km2 of Forest Francolin in the distance band of 50–175 m indicates high densities of the species in LYFR in its natural, undisturbed habitat. We regard the number of calling males as an approximation for the number of territories of the Forest Francolin.
Group composition and social behaviour
Both Congo Peafowl and Forest Francolin have been regarded as monogamous (Urban et al. Reference Urban, Hilary, Keith, Woodcock and Willis1986; Del Hoyo et al. Reference Del Hoyo, Elliott and Sargatal1994; Louette and Mulotwa Reference Louette, Mulotwa, DellaSala and Goldstein2022), however, we question whether this is the case for the peafowl (own observations, camera trap photos). While Congo Peafowl often calls in a duet started by the male (Urban et al. Reference Urban, Hilary, Keith, Woodcock and Willis1986, own observations) the advertisement call of Forest Francolin was by the male alone (Del Hoyo et al. Reference Del Hoyo, Elliott and Sargatal1994; own observations).
Our records indicated a skewed sex ratio towards more males of the peafowl. Groups filmed by camera traps in LYFR comprised a pair, and one female with two males (AZF and BonDiv 2025), and in Lomami National Park, filmed groups uploaded by Terese Hart comprised three females and five males, as well as one female and two males, respectively (Hart Reference Hart2017). The Salonga National Park records comprised from one to six individuals (Louette and Mulotwa Reference Louette, Mulotwa, DellaSala and Goldstein2022). Sexual dimorphism, group tendency and the observed skewed sex ratio towards more males may indicate a different mating system (see also Hart and Upoki Reference Hart and Upoki1997; field notes by Teresa Hart Reference Hart2017). Further and targeted surveys are needed to address this question.
Supplementary material
The supplementary material for this article can be found at http://doi.org/10.1017/S0959270926100781.
Acknowledgements
Thanks to Jef Dupain, director of the Antwerp Zoo Foundation, for support throughout the study and to Tetsuya Sakamaki for invaluable assistance at Iyema camp and comments on an earlier draft. Moreover, we are indebted to Dieumerci Kaumo, Otshudiakona Otshudiembo Polycarpe, AZF for logistical support and the local guides Baende Ntoko Felix “Didier” and Bofaso Bofaso Jonas “Bushiri” for providing their skills during fieldwork and Lomanga Lompwanga Frederick and staff at the Congolese Institute for the Conservation of Nature (ICCN) in Lingunda for support. We are thankful to Simon Bruslund Copenhagen Zoo, World Pheasant Association Germany, and World Pheasant Association International who made fieldwork for LD and MD possible in 2025. Finally, our thanks go to Marianne Courouble and Xavier Gilibert for their support. Finally, thanks to two anonymous referees for comments to the manuscript.