1. Introduction
Several recent studies have investigated the effects of development on fatalities from natural disasters, such as earthquakes, floods, windstorms and landslides (Anbarci et al., Reference Anbarci, Escaleras and Register2005; Kahn, Reference Kahn2005; Escaleras et al., Reference Escaleras, Anbarci and Register2007; Toya and Skidmore, Reference Toya and Skidmore2007; Kellenberg and Mobarak, Reference Kellenberg and Mobarak2008; Raschky, Reference Raschky2008; Keefer et al., Reference Keefer, Neumayer and Plümper2011).Footnote 1 They have focused mainly on two dimensions of of development, per capita income and governance, with the variables used to define the latter varying across studies. The general finding is that countries that are richer and have stronger institutions suffer fewer deaths from natural disasters. These countries are evidently better able to agree on, invest in, and implement zoning regulations, building codes, emergency response systems and other measures that reduce the exposure of vulnerable populations to extreme natural events and mitigate the consequences if populations are exposed.
Although this is an appealing and intuitive finding, it may be overly simplistic, at least in the case of floods. In a series of works that started with his 1945 dissertation, Gilbert F. White warned that many of the flood control measures that development enables are unlikely to have an unambiguously positive impact on flood hazards: ‘In the long run the measures [large-scale protection works, flood warnings, and flood proofing] might help build still higher catastrophe potential by promoting complacency and a tolerance for flood plain use’ (White, Reference White, Brinkmann, Cochrane and Ericksen1975: 88). In this paper, we find that two statistical features of the recent economic studies may have resulted in biased estimates of the magnitude and significance of development's effects, with the more complex relationship described by White being revealed when less biased methods are employed. First, although all the studies have analyzed cross-country panel data, only one has attempted to exploit this data structure to control for time-invariant unobserved country effects (Kellenberg and Mobarak, Reference Kellenberg and Mobarak2008). Moreover, that study used a conditional fixed effects (FE) negative binomial model, which ‘is not a true fixed-effects model’ (Hilbe, Reference Hilbe2012: 474) and controls for unobserved country effects only under a very restrictive assumption (Guimarães, Reference Guimarães2008). Three other studies controlled, more coarsely, for unobserved continent effects (Anbarci et al., Reference Anbarci, Escaleras and Register2005; Kahn, Reference Kahn2005; Escaleras et al., Reference Escaleras, Anbarci and Register2007), but they also used negative binomial models. The widespread application of impact evaluation methods has made development economists well aware that inadequate control for unobserved effects can result in biased and inconsistent estimates of regression parameters (Ravallion, Reference Ravallion, Schultz and Strauss2008). Unobserved geological, topographical or climatic characteristics are one example of time-invariant factors that could confound estimation of the effects of development on natural disaster fatalities, as they could affect both development and fatalities.
Second, less than half the studies based their tests of statistical significance on standard errors that were clustered within countries (Kahn, Reference Kahn2005; Raschky, Reference Raschky2008; Keefer et al., Reference Keefer, Neumayer and Plümper2011). Conventional standard errors in panel models can be severely underestimated if the error term is not independently distributed within countries, and as a result they can overstate the significance of explanatory variables (Angrist and Pischke, Reference Angrist and Pischke2009: 308–315). Clustering reduces this bias and the accompanying risk that variables will be falsely accepted as significant.
We present new results on the effects of development on flood fatalities that are not tainted by these two statistical problems. We analyze fatalities using an econometric model, the FE Poisson model, which has not been applied to disaster data previously. Unlike the FE negative binomial model, it controls completely for time-invariant unobserved country effects (Wooldridge, Reference Wooldridge2002: 674–676). We cluster the standard errors in this model by country, and we investigate the impact on inference by comparing significance levels based on the clustered standard errors to significance levels based on conventional (non-clustered) standard errors. To investigate the impact of controlling for unobserved country effects, we also compare the FE Poisson results to results from negative binomial models similar to those used in previous studies.
Our results are also new in that they are based on a data source that has not been used in previous studies on the effects of development on natural disaster fatalities. Nearly all previous studies have drawn data from the Emergency Events Database (EM-DAT),Footnote 2 which is affiliated to the World Health Organization and several other international organizations (http://www.emdat.be). Although widely used, EM-DAT has shortcomings that include separate events being recorded as a single one and underreporting of smaller events in developing countries (Jonkman, Reference Jonkman2005: 153). We instead drew data from the Dartmouth Flood Observatory (DFO; http://floodobservatory.colorado.edu), which is funded by NASA and the European Commission and is the flood data source preferred by hydrologists. Floods were the most common natural disaster between 1975 and 2001, and although they killed fewer people than earthquakes, they affected a larger number of people (Jonkman, Reference Jonkman2005). We compiled and analyzed DFO data on 2,171 flood events in 92 countries during 1985–2008. The DFO provides more detail on flood events than EM-DAT does, and this enabled us to investigate not only the direct effects of development on flood fatalities but also the indirect effects via flood magnitude and flood frequency.
Our results confirm some results reported by previous studies but contradict others. Two previous studies analyzed the effect of income on flood fatalities as part of broader analyses that examined a range of natural disasters. Despite using a different data set, we are able to replicate Kahn's (Reference Kahn2005) finding that countries with higher income experienced fewer flood fatalities in a negative binomial model without country fixed effects, and Kellenberg and Mobarak's (Reference Kellenberg and Mobarak2008) finding that income has an inverse U-shaped effect on flood fatalities in a negative binomial model with these effects. The effect of income becomes insignificant, however, when we switch to the FE Poisson model with clustered standard errors. When applied to data on flood frequency, this model confirms another finding of Kahn's, that countries with higher income are less likely to experience floods. We also find evidence of a significant effect of income on flood magnitude, but it differs by income level: it is negative in countries below the upper middle income level, and positive in countries at this level or above. In combination, these results imply that income indirectly reduces flood fatalities in lower income countries by reducing both the frequency and magnitude of floods but has offsetting effects in higher income countries. Contributions by White (Reference White, Brinkmann, Cochrane and Ericksen1975) and others in the hydrological literature on floods offer a possible explanation for this pattern of fewer but larger floods in higher income countries: the types of flood-control measures that those countries have implemented have curbed damage from frequent flooding in protected flood plains but increased the probability of catastrophic events.
Kahn and Kellenberg and Mobarak did not examine flood-related effects of governance, but studies on aggregate disaster fatalities or fatalities due to earthquakes have found that fatalities are lower in countries with governments that are more democratic, more stable and less corrupt (Kahn, Reference Kahn2005; Escaleras et al., Reference Escaleras, Anbarci and Register2007; Raschky, Reference Raschky2008; Keefer et al., Reference Keefer, Neumayer and Plümper2011). We use an aggregate governance index that incorporates these dimensions, and we similarly find that it has a negative effect on flood fatalities for most countries in the sample when we use the negative binomial model without country effects. Significance is lost, however, when we use the FE Poisson model with clustered standard errors, and evidence of a significant governance effect is also lacking for flood frequency and magnitude. In sum, our results point toward income having a significant effect on flood fatalities, but only through indirect channels and nonmonotonically, and governance not having any effect.
The next section of the paper describes the models estimated in the paper and related econometric issues. The section after that describes the data. The last two sections present the estimation results and discuss their implications.
2. Modeling approach
Development can conceivably affect flood fatalities through a variety of indirect and direct pathways. It might affect them indirectly through an impact on the frequency and magnitude of floods, by facilitating the construction, maintenance and retrofitting of dams, levees and other flood-management infrastructures, and by facilitating the adoption and monitoring of zoning regulations, as land use can affect flooding risks. For example, regulations that reduce the expansion of impervious surfaces associated with urbanization could result in less frequent and smaller floods.
Once a flood has taken place, development might affect the number of fatalities by keeping people out of harm's way. Zoning regulations limiting construction and settlement in flood plains can do this preemptively. Likewise, monitoring and information systems can facilitate evacuation from high-risk areas before flooding occurs (Sheets & Williams, Reference Sheets and Williams2001). Well-functioning emergency and healthcare systems can reduce the number of casualties after a flood has occurred (Athey and Stern, Reference Athey and Stern2002).
Our objective is not to identify the structural mechanisms through which development affects flood fatalities, but rather to identify development's reduced-form effects. We focus on two dimensions that have received the most attention in previous studies: per capita income and governance. These are aggregate indicators that proxy for many changes that occur during development. For example, rising per capita income is typically correlated with changes in economic structure, quality of infrastructure, education, and a host of other socioeconomic variables, while improvements in governance can refer to various institutional changes, including democratization, greater government stability and reduced corruption. Some previous studies have decomposed these indicators in order to investigate more disaggregated effects, and this is a useful and important line of inquiry. We intentionally focus on aggregate indicators, however, as our objective is to step back and ask a broader question: does the conventional wisdom about development's beneficial effects on natural disaster fatalities hold up when unobserved country effects and clustering of standard errors are taken more fully into account?
2.1. Flood fatalities
The unit of analysis in our model of flood fatalities is the number of people killed in an individual flood event. The number of fatalities is relatively small for most events in our sample, with a quarter of the events killing no more than three people and half of them killing no more than 10. Like most previous studies on natural disaster fatalities, we therefore used count-data models to analyze fatalities.Footnote 3
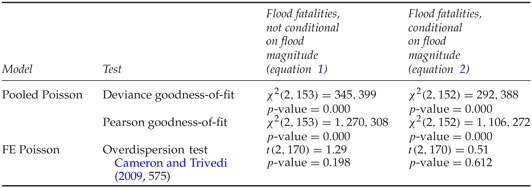
Previous studies have favored negative binomial models over the chief alternative count-data model, the Poisson model, because they have found that fatality data are overdispersed – the conditional variance exceeds the conditional mean – which violates a fundamental assumption of the Poisson distribution. As noted in the introduction, however, this does not necessarily make negative binomial models better models in a panel setting, as they control less robustly for unobserved country effects.Footnote 4 Moreover, the impacts of overdispersion on the FE Poisson model are not very consequential (Wooldridge, Reference Wooldridge2002: 674–676). The FE Poisson model's parameter estimates remain consistent when data are overdispersed, and its standard errors can be calculated using a sandwich estimator that ‘allows for any deviations from the Poisson distribution [including overdispersion and a large number of zeros] and arbitrary time dependence’ (Wooldridge, Reference Wooldridge2002: 676). Using a sandwich estimator addresses the consequences of overdispersion in a more robust way than modeling overdispersion by assuming a particular distribution, such as the negative binomial (Greene, Reference Greene2006: 916). A final point about overdispersion is that it can result from unobserved country effects, which the FE Poisson model directly controls for. This appears to be the source of overdispersion in our fatality model: standard goodness-of-fit tests strongly reject the null that there is no overdispersion if we estimate the model using a pooled Poisson model without fixed effects, but the test in Cameron and Trivedi, (Reference Cameron and Trivedi2009, 575) does not reject this null for the FE Poisson model (see appendix, table A1). Even if overdispersion were present in the FE Poisson model, the parameter estimates and the standard errors based on the sandwich estimator would remain consistent in this model.
We estimated two versions of the fatality model, one that did not control for flood magnitude and one that did. The former (‘unconditional’) model had the following specification:
 $$D_{ijt} = f_1 \lpar g_1 \lpar Y_{jt-1}\comma \; G_{jt-1}\rpar \comma \; P_{ijt-1}\comma \; {\bf Z}_{jt-1}\comma \; c_j\comma \; \theta_t\comma \; u_{ijt}\rpar \comma \;$$
where D is fatalities during flood event i in country j and year t, Y is per capita income, G is governance, P is the total population in the area affected by the flood, Z is a set of other observed country characteristics, c j and θt are unobserved effects for countries and years, and u ijt is an error term. All explanatory variables except population are measured at the country level; as described later, we generated an event-specific population variable by overlaying a digital global population map on the specific area within a country that was affected by a particular flood event. We lagged the explanatory variables one year to mitigate potential endogeneity (e.g., a flood affecting current per capita income). The notation g 1 (Y, G) indicates that, in addition to a linear specification, we estimated a specification that was quadratic in income, as in Kellenberg and Mobarak (Reference Kellenberg and Mobarak2008), and quadratic in governance, which resource economics studies outside the realm of natural disasters have found to be significant (e.g., Ferreira and Vincent, Reference Ferreira and Vincent2010).
Z included total annual rainfall and two proxies for land-use patterns: the urban population percentage, and total forest area as a percentage of total land area. An increased area of impervious surfaces associated with urbanization is believed to exacerbate flooding, by increasing the share of rainfall that runs off instead of infiltrating. Despite widespread belief that forests can reduce floods, the effect of forests on floods remains controversial (FAO and CIFOR, 2005). Bradshaw et al., Reference Bradshaw, Sodi, Peh and Brook2007 used global flood data to show that forests are associated with lower flood risk and severity. Using the same data, Van Dijk et al., Reference Van Dijk, van Noordwijk, Calder, Bruijnzeel, Schellekens and Chappell2009 offered an alternative explanation: floods are less likely to be reported if they affect a smaller population. Bradshaw et al. did not control for population, which could confound their estimated effect of forests because forest cover tends to be greater in less populated regions. As noted, we controlled for population in addition to forest area.
We treated the unobserved country effects (c j) as fixed, not random, and estimated equation (1) using a conditional FE negative binomial model in addition to the FE Poisson model. FE models are preferred conceptually to random effects models given the nature of our sample, which is the complete set of countries with recorded flood events instead of a random country draw (Wooldridge, Reference Wooldridge2002: 250–251). And in any event, the choice of fixed vs. random effects makes little difference in the results. If we estimate equation (1) using random effects instead of fixed effects, we obtain parameter estimates that are very similar to those in the FE models, with most estimates being identical to the second or even third digit. This similarity is not surprising: the random effects estimator weights within-country variation relatively more heavily than between-country variation as the time dimension lengthens, and our sample period is relatively long (24 periods) compared to typical microeconometric applications of random effects models.
We also estimated equation (1) using a pooled negative binomial model, which excluded the country fixed effects. Fixed effects control for time-invariant country characteristics that affect flood fatalities. Kahn (Reference Kahn2005, table 8) hypothesized that these characteristics include mean national elevation, absolute value of mean national latitude, and percentage of land within 100 km of ice-free coast. He included these three variables in his pooled negative binomial model. To parallel his analysis, we included them in our pooled negative binomial model, too.
We used dummy variables to control for the unobserved year effects (θt). These variables control for time-varying factors that affect all countries, such as changes in reporting procedures in the DFO archive. A caveat noted explicitly by the DFO is that the quality of the flood-event information varies from nation to nation: ‘[N]ews from floods in low-tech countries tend to arrive later and be less detailed than information from “first world” countries.’ This effect is captured by the country fixed effects as long as it is constant over time. If reporting improves over time, however, then the country effects will not control for the improvement. Year dummies will control for it as long as it is driven by, say, technological change (e.g., improvements in remote sensing, which DFO uses extensively) or international initiatives that are common to all the countries. The inclusion of the country fixed effects and year dummies thus reduces the risk that differences in flood reporting across countries and over time confound the effects of income and governance (e.g., less democratic countries systematically underreporting the number of casualties). Several previous studies have pointed out the need to control for changes in the reporting of natural disasters over time (Kahn, Reference Kahn2005; Cavallo et al., Reference Cavallo, Powell and Becerra2010; Wheeler, Reference Wheeler2010), with Kahn (Reference Kahn2005) using a time trend to control for them. Year dummies provide more flexible and rigorous control than a time trend.Footnote 5
As discussed in the introduction, a key issue with the error term (u ijt) is that it might not be independent within countries. Also as discussed there, we investigated this issue by calculating robust standard errors in the FE Poisson model with clustering by country. For the pooled and FE negative binomial models, however, we followed most previous studies and calculated regular standard errors (non-robust, non-clustered).
In addition to event-specific deaths, the DFO provides a measure of the physical magnitude of each flood event (M). This variable enabled us to estimate a ‘conditional’ fatalities model that isolates the direct effects of income and governance, i.e., their effects for a flood of given size:
 $$D_{ijt} = f_2 \lpar M_{ijt}\comma \; g_2 \lpar Y_{jt-1}\comma \; G_{jt-1}\rpar \comma \; P_{ijt-1}\comma \; {\bf Z}_{jt-1}\comma \; c_j\comma \; \theta_t\comma \; v_{ijt}\rpar \comma \;$$
where νijt is the error term and all other notation is the same as in equation (1). Previous studies on the effects of development on earthquake fatalities have controlled for event magnitude (Anbarci et al., Reference Anbarci, Escaleras and Register2005; Kahn, Reference Kahn2005; Keefer et al., Reference Keefer, Neumayer and Plümper2011), but studies on flood fatalities have not (Kahn, Reference Kahn2005; Kellenberg and Mobarak, Reference Kellenberg and Mobarak2008), as EM-DAT does not provide information on flood magnitude.Footnote 6 We applied the same set of estimators to this model as to equation (1).
2.2. Flood magnitude
In addition to including flood magnitude as a control in equation (2), we investigated the effects of income and governance on magnitude by estimating the following model:
 $$M_{ijt} = f_3 \lpar g_3 \lpar Y_{jt-1}\comma \; G_{jt-1}\rpar \comma \; P_{ijt-1}\comma \; {\bf Z}_{jt-1}\comma \; c_j\comma \; \theta_t\comma \; z_{ijt}\rpar \comma \;$$
where z ijt is the error term and Z includes the same variables as in equations (1) and (2). Unlike fatalities, magnitude is a continuous variable, not a count. We therefore estimated equation (3) using OLS and a regular (non-count) FE model, with robust standard errors clustered by country in both. Previous economic studies have not analyzed the effects of development on flood magnitude.
2.3. Flood frequency
Our final model investigates the effects of income and governance on flood frequency, measured by the number of floods (F) reported in the DFO for country j in year t. Like flood fatalities, flood frequency is a count variable consisting mainly of small numbers: about half of the observations in our sample equal zero, and another quarter equal one. We therefore applied the same count-data models as for flood fatalities, with the specification given by:
 $$F_{jt} = f_4 \lpar g_4 \lpar Y_{jt-1}\comma \; G_{jt-1}\rpar \comma \; P_{jt-1}\comma \; {\bf Z}_{jt-1}\comma \; c_j\comma \; \theta_t\comma \; \varepsilon_{jt}\rpar \comma \;$$
where ɛjt is the error term. Although this looks the same as equation (1), three differences are important to note. First, as already explained, the unit of observation is different: country-year instead of flood event. Second, P is now national population, not population just in the flood-affected area. Third, following Khan's (2005) model of flood probability, Z in the pooled negative binomial model includes total country area in addition to the variables in equations (1)–(3), as more floods are expected to be reported, ceteris paribus, in countries with more area that could be flooded.
3. Data
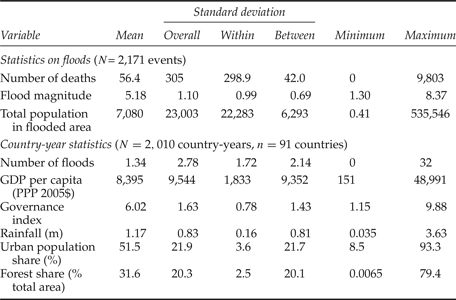
We created an unbalanced panel with observations on the number of people killed in flood events, as well as variables capturing the physical magnitude of floods and the affected population's exposure and vulnerability, for 2,171 floods in 92 countries during 1985–2008. We created a second unbalanced panel with observations on the number of floods by country and year for 91 countries during the same period. The second panel contained 2,010 observations, for a mean of 22.1 years per country. Table 1 presents descriptive statistics on the data.
Descriptive statistics

Notes: Flood magnitude = log (affected area × flood duration × flood severity). See text for detailed description of variables.
Source: DFO (2010) for flood-related data (deaths, magnitude, flooded area); CIESIN/CIAT (2005) for population in flooded areas; WDI (2010) for GDP per capita and urban population; PRS (2010) for governance indicators; Tyndall Centre for Climate Change Research (2011) for rainfall; FAO (2001, 2006, 2007) for forest area.
3.1. Flood fatalities, magnitude and frequency
The DFO records data on large floods, defined as ones with ‘significant damage to structures or agriculture, long (decades) reported intervals since the last similar event, and/or fatalities’.Footnote 7 Flood deaths recorded in disaster databases, including the DFO, are typically from drowning and severe injuries. Deaths from unsafe or unhealthy conditions following a flood are also a health consequence, but disaster statistics typically include only the deaths recorded while the event is ‘active’ (Combs et al., Reference Combs, Quenenmoen and Parrish1998; Jonkman and Kelman, Reference Jonkman and Kelman2005).
Because water bodies are not necessarily confined to national boundaries, some floods in the DFO (less than 10 per cent) are regional in scope. For these events, the reported number of deaths is the aggregate figure per event, with the split between the affected countries not reported. Because of this restriction, our sample excludes multi-country floods.
The fact that data on the number of deaths are only available for countries that experienced flood events could create a sample selection problem, incidental truncation. The data are also truncated due the fact that the DFO only includes data on ‘large’ floods. We applied the truncation test developed by Wooldridge (Reference Wooldridge2002, 667) and did not reject the null that there is no truncation bias.Footnote 8 This does not imply that there is no correlation between selection in a given period and the country effects or the explanatory variables, but it does rule out correlation between selection and the idiosyncratic errors.
Most events in our sample killed at least one person, as the proportion of events with zero deaths was just 9.7 per cent. Table 1 shows that the mean number killed was large, 56, with great variation: the standard deviation was more than five times as large. Examination of the frequency distribution of the fatality variable reveals that the large mean and standard deviation are due to a long right tail, as 84 per cent of the values are below the mean. We excluded one event from the sample, a 1991 flood in Bangladesh that had a death toll of 138,000, as it was more than an order of magnitude larger than the next largest event, a 1999 flood in India that killed 9,803 people.
The DFO reports the magnitude of a flood as the log of the product of three terms: area affected by the flood (in km2)× flood duration (in days) × flood severity. Regarding the third term, the DFO assigns floods to three severity classes depending on their estimated recurrence interval: class 1 floods have a 10–20 year recurrence interval between similar events, class 1.5 have a 20–100 year recurrence interval, and class 2 have a recurrence interval greater than 100 years. Flood magnitude varies much less than the number of deaths or the number of floods, with the standard deviation being smaller than the mean (table 1).
We created the flood frequency variable as the count of floods in a country-year. On average, there was just over one flood per country-year in the sample (table 1), but the number varied considerably, as the standard deviation was more than twice the mean.
3.2. Income and governance
The indicator of income is GDP per capita converted to constant 2005 international dollars using purchasing power parity exchange rates. It comes from the World Development Indicators (WDI, 2010). We expressed it in logarithmic form, which is a common transformation in the literature. We estimated the models with this transformation and without it, and we found that results were not very sensitive to it. We therefore adhered to convention and used the log of GDP per capita. GNI per capita more accurately measures the income of a country's population, but it was available for slightly fewer countries and years than GDP per capita. The choice between GDP per capita and GNI per capita is inconsequential: we estimated all the models using both measures, and results were virtually indistinguishable.
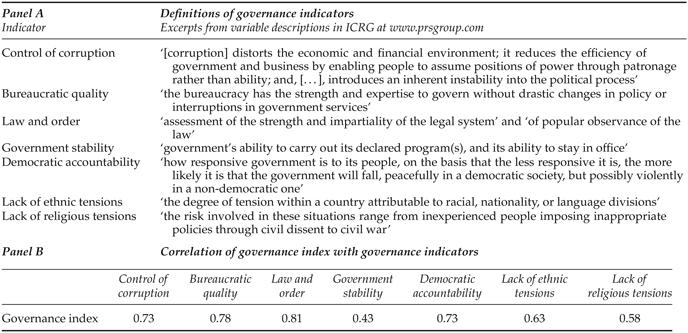
The governance indicators come from the International Country Risk Guide (ICRG) of Political Risk Services (PRS, 2010). The ICRG is a popular source of governance indicators used in cross-country studies. It includes indicators for control of corruption, bureaucratic quality, law and order, government stability, democratic accountability, lack of ethnic tensions and lack of religious tensions (see appendix, table A2, panel A). It offers broad country coverage, which reduces the risk of selection bias (Kaufmann et al., Reference Kaufmann, Kraay and Zoido-Lobaton1999; Johnston, Reference Johnston and Jain2001), and is available for a relatively long time period (1984 to the present), which covers the entire period that the DFO data are available, unlike governance indicators from other sources. Indicators in the ICRG database have values between zero and six (except bureaucratic quality and government stability, which have maximum values of four and 12, respectively), with higher values denoting better governance. We converted each to a 0–10 scale.
We formed an aggregate governance index by averaging all seven indicators. Many studies have averaged or, equivalently, summed governance indicators, with the rationale being that averaging reduces measurement error if the indicators pertain to similar underlying concepts of governance and have independent errors (Knack and Keefer, Reference Knack and Keefer1995; Mauro, Reference Mauro1995; Ferreira and Vincent, Reference Ferreira and Vincent2010). Nearly all of the individual indicators are reasonably highly correlated with the aggregate governance index (appendix, table A2, panel B).
The usual reason economists are reluctant to include fixed effects in cross-country panel models is a concern that the within-country variation in socioeconomic variables is insufficient to identify their effects. In our sample, this is a greater concern for income than for governance: as shown in table 1, the ratio of the within-country standard deviation to the between-country standard deviation was smaller for GDP per capita (about one-fifth) than for the governance index (about one-half).Footnote 9 Despite this, the results we present later provide stronger evidence of a significant effect of income than governance.
3.3. Population in flood-affected areas
Each entry in the DFO's register of major flood events has an associated GIS polygon representing the area affected by that event. The DFO uses news and governmental sources to determine this area. Using GIS, we overlaid flood maps with population maps from the Gridded Population of the World v3 (CIESIN-CIAT, 2005) to obtain estimates of the population exposed to each event. Population grid maps are available in five-year intervals since 1990. We completed the panel by calibrating an exponential curve for the remaining years.
The resulting estimates of population exposure to a flood are more accurate than the country-level population statistics used by previous studies. In our sample, mean population density in areas affected by floods is 387 persons/km2, while mean population density at the country level is 98 persons/km2. This difference reflects the fact that people have tended to concentrate in flood plains for millennia. Increased populations in flood plains is one explanation for the observed growth in the reported number of floods (Freeman et al., (Reference Freeman, Keen and Mani2003); IPCC, 2007; chapter 3), as floods are more likely to be reported if they affect human populations.
3.4. Other controls
A country's total population and urban population percentage come from the WDI (2010). Data on total forest area (km2) are available for 1990, 2000 and 2005 from FAO 2001, 2006, 2007. We interpolated estimates for other years by calibrating an exponential curve to the three observations for each country, and we expressed forest area as a percentage of total land area. Mean annual national precipitation comes from the Tyndall Center for Climate Change Research (2011).
4. Results
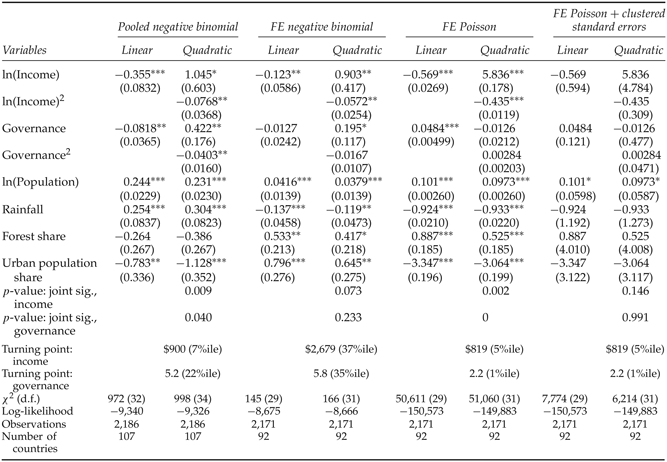
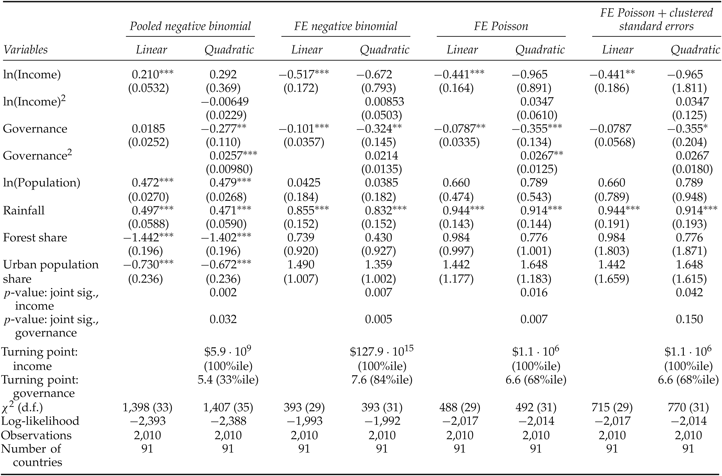
Tables 2–5 present the estimation results. All models include year dummies, which are not shown in the tables. The non-FE pooled models also include three time-invariant controls in tables 2–4 (mean national elevation, mean national latitude, mean coastal percentage) and four in table 5 (the previous three, plus ln(national area)); these are not shown either. For quadratic specifications, the tables show p-values for Wald tests of joint significance of the linear and squared income and governance terms, turning points for income and governance calculated using the parameter estimates on the linear and squared terms, and percentile values for the turning points using the distributions of income and governance in the estimation samples. As discussed earlier, in order to replicate the estimation procedures common in the literature, we do not cluster standard errors in the pooled and FE negative binomial models for fatalities and flood frequency, but we do cluster them in the FE Poisson model. Inference in the FE Poisson model can therefore differ from inference in the negative binomial models for two reasons: controlling more completely for unobserved country effects, and clustering the standard errors.
Flood fatalities, not conditional on flood magnitude
Notes: All models include year dummies. Pooled negative binomial models also include time-invariant controls for mean national elevation, mean national latitude and national coastal percentage. Standard errors, shown in parentheses, are not clustered unless indicated otherwise.
*Significant at p < 0.1; **significant at p < 0.05; ***significant at p < 0.01.
Flood fatalities, conditional on flood magnitude
Notes: All models include year dummies. Pooled negative binomial models also include time-invariant controls for mean national elevation, mean national latitude and national coastal percentage. Standard errors, shown in parentheses, are not clustered unless indicated otherwise.
*Significant at p < 0.1; **significant at p < 0.05; ***significant at p < 0.01.
Flood magnitude
Notes: All models include year dummies. OLS models also include time-invariant controls for mean national elevation, mean national latitude and national coastal percentage. Standard errors, shown in parentheses, are robust and clustered by country in all models.
*Significant at p < 0.1; **significant at p < 0.05; ***significant at p < 0.01.
Flood frequency
Notes: All models include year dummies. Pooled negative binomial models also include time-invariant controls for ln(national area), in addition to mean national elevation, mean national latitude and national coastal percentage. Standard errors, shown in parentheses, are not clustered unless indicated otherwise.
*Significant at p < 0.1; **significant at p < 0.05; ***significant at p < 0.01.
4.1. Flood fatalities
Controlling for unobserved country effects and clustering of standard errors have a great impact on results for the number of fatalities during a flood event (table 2). The linear and squared terms are jointly significant for both income and governance in the quadratic pooled negative binomial model, with income having a negative effect on fatalities for virtually all observations (the turning point is at the 7th percentile of the estimation sample, and the relationship is an inverted U) and governance having a negative effect for most (turning point at the 22th percentile, also an inverted U). The predominantly negative effect of income mirrors the result in Kahn's Reference Kahn2005 pooled negative binomial model. Joint significance drops for both variables when fixed effects are added to the negative binomial model, although the linear and squared income terms remain individually significant at p < 0.05. The relationship for income continues to be an inverted U, which mirrors the result in Kellenberg and Mobarak's (Reference Kellenberg and Mobarak2008) FE negative binomial model, although our turning point is lower than theirs ($2,679 at 2005 price levels, vs. $5,609 at 1995 prices).
Significance drops further when the estimator is changed to the FE Poisson model with clustered standard errors, with neither income nor governance having a significant effect at even p < 0.1 in either the linear or quadratic specification. Governance is especially insignificant. The comparison between the two FE Poisson models reveals that the loss of significance is due to the clustering of standard errors, as the linear and squared terms for both income and governance are jointly significant (p < 0.01) in the quadratic specification when standard errors are not clustered. In sum, even though we use a different data set, we are able to replicate previous results that indicate a significant effect of income on flood fatalities, but the significance vanishes when we use a model that is less prone to confounding by unobserved country effects and underestimation of standard errors than the models used in previous studies.
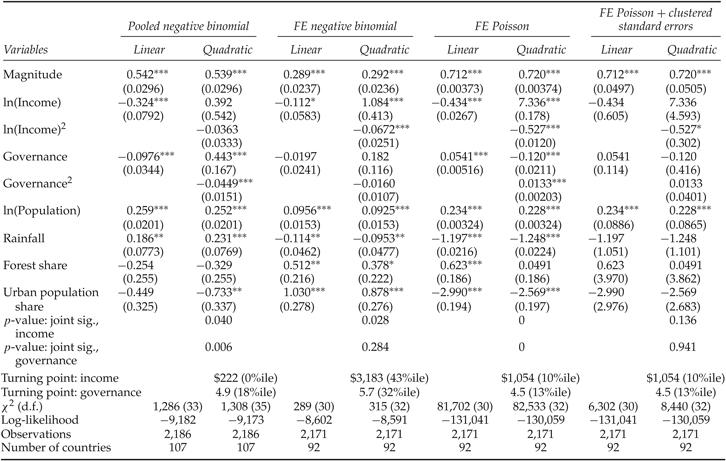
The DFO data on flood magnitude enabled us to disaggregate the effects of income and governance into two stages: direct effects on fatalities conditional on magnitude (table 3), and indirect effects via magnitude (table 4). Table 3 shows results for fatalities per flood event, controlling for flood magnitude. The layout is the same as in table 2 except for the addition of a row for the parameter estimates on flood magnitude, which are positive and highly significant (p < 0.01) for all estimators and specifications. There is thus robust evidence that fatalities are greater when floods are larger, which mirrors results for earthquakes (Anbarci et al., Reference Anbarci, Escaleras and Register2005; Kahn, Reference Kahn2005; Escaleras et al., Reference Escaleras, Anbarci and Register2007; Keefer et al., Reference Keefer, Neumayer and Plümper2011). Incomplete control for unobserved country effects causes this effect to be underestimated, however, as the parameter estimates on magnitude in the FE Poisson model are more than twice as large as the corresponding FE negative binomial estimates and are also larger than the pooled negative binomial estimates. The relative effect of magnitude is large: at sample means, the parameter estimates in the quadratic FE Poisson model imply that a 1 per cent increase in magnitude raises fatalities by 3.7 per cent.
Results for income and governance in table 3 are very similar to those in table 2: the significance of both variables tends to decline as the model is changed from the pooled negative binomial to the FE negative binomial and finally the FE Poisson with clustered standard errors. Comparison of the two versions of the FE Poisson model reveals that the reduced significance in the FE Poisson model with clustered standard errors is again due to the clustering. With clustering, governance does not have a significant effect at even p < 0.1 in either the linear or quadratic specification of the FE Poisson model, and income has a significant effect at this weak level only through the squared term in the quadratic specification. The latter effect is negative, implying that fatalities decline increasingly rapidly with income after controlling for flood magnitude. Without clustering, the linear and squared terms are jointly significant (p < 0.01) in the quadratic FE Poisson model for both income and governance.
4.2. Flood magnitude
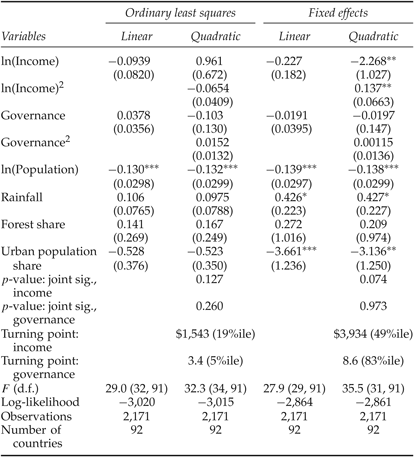
Because flood magnitude is a continuous variable, not a count, the estimators in table 4 are OLS and a standard FE model, both with clustered standard errors. Governance does not have a significant effect for either estimator, regardless of whether its effect is modeled as linear or quadratic. There is evidence of a quadratic effect of income in the FE model, as the two income variables are individually significant at p < 0.05 and jointly significant at p < 0.1. The effect is U-shaped, with a turning point at $3,934. This is at the 49th percentile of the sample, and so it implies a true turning point and not just a diminution of income's effect. The relative effect of income is small, however: at sample means, the parameter estimates in the quadratic FE model imply that a 1 per cent increase in income reduces magnitude by 0.04 per cent in countries with income below $3,934 and raises it by 0.07 per cent in countries with income above this level.
In combination, the results in tables 3 and 4 indicate that there is no evidence that governance affects fatalities either directly or indirectly through an effect on flood magnitude. On the other hand, income affects fatalities indirectly, by reducing magnitude in countries with income below $3,934, which tends to reduce fatalities due to the positive effect of magnitude on fatalities, and raising it in countries with higher income, which tends to raise fatalities. And as noted in the discussion of table 3, there is also weak evidence of a direct, negative effect of squared income on fatalities after controlling for magnitude. Given these opposing effects, it is not surprising that income has an insignificant effect on fatalities in the FE Poisson models in table 2, which do not control for magnitude.
4.3. Flood frequency
Flood frequency is a count variable, and so the results in table 5 are from the same types of count-data models as in tables 2 and 3. The dependent variable is now defined differently, however, being the number of floods per country-year instead of the number of fatalities per flood event. As in the case of flood magnitude, controlling for unobserved country effects reverses the estimated effect of income, and as in the case of fatalities, clustering the standard errors causes the estimated effect of governance to lose significance.
Tests of joint significance indicate that both income and governance have quadratic effects in the pooled negative binomial model, with the former being inverted U-shaped and the latter being U-shaped. The significant, U-shaped effect of governance persists when fixed effects are added to the negative binomial model, but the effect of income now becomes U-shaped too. The shapes remain the same when the estimator is changed to the FE Poisson model, but only income remains significant at p < 0.05. The income turning point lies far beyond the maximum value in the sample, indicating that increased income has a negative (but diminishing) effect on flood frequency in all countries. This is consistent with Kahn's Reference Kahn2005 finding that countries with higher income were less likely to experience floods. The relative effect is moderate: at sample means, a 1 per cent increase in incomes reduces the number of floods by 0.38 per cent. Governance is not significant at even p < 0.1 in the linear FE Poisson model, but the linear governance term is significant at this weak level in the quadratic FE Poisson model. Additional analysis reveals that the loss of significance of governance in the FE Poisson model is due to the clustering of standard errors, as the linear and squared governance terms are jointly significant at p < 0.01 if the standard errors are not clustered.
Taken together, the results in tables 2–5 provide at best weak evidence of an effect of governance on flood fatalities, through a reduction in flood frequency, but stronger evidence of a complex effect of income: income has a significant, negative effect on flood frequency; a significant, U-shaped effect on flood magnitude, which in turn has a significant, positive effect on fatalities; and a weakly significant, negative effect on flood fatalities conditional on magnitude. Focusing on effects that are significant at p < 0.05, income clearly has a net negative (i.e., beneficial) effect on flood fatalities in countries with per capita income below $3,934. Calculated at sample means for this country group, a 1 per cent increase in income reduces flood frequency by 0.46 per cent and, through the effect on magnitude, reduces fatalities per flood event by 0.16 per cent.
The net effect on fatalities in countries with per capita income above $3,934 is qualitatively ambiguous, as it depends on the relative strengths of the negative effect on flood frequency and the positive effect on fatalities per flood event. At sample means for this group, a 1 per cent increase in income reduces frequency by 0.32 per cent and raises fatalities per event by 0.25 per cent. Income evidently has an effectively neutral, or perhaps slightly negative, effect on fatalities in higher income countries.
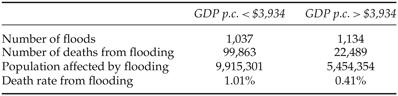
A cross-tabulation of observations in the estimation sample highlights important differences between countries above and below the income turning point for flood magnitude, $3,934 (appendix, table A3). Although the total number of floods is similar in the two groups (within 10 per cent), both the total population affected by flooding and the mean mortality rate from flooding are approximately twice as large for the lower income group, while the total number of deaths from flooding is nearly five times as large.
4.4. Variables other than income and governance
Although the effects of variables other than income and governance are not the focus of this paper, these variables have plausible effects in the FE Poisson models for frequency and fatalities and the FE model for magnitude. Rainfall has a significant, positive effect on frequency and magnitude, though only at p < 0.1 in the latter. Similar to results for other disasters (Anbarci et al., Reference Anbarci, Escaleras and Register2005; Kahn, Reference Kahn2005; Kellenberg and Mobarak, Reference Kellenberg and Mobarak2008; Keefer et al., Reference Keefer, Neumayer and Plümper2011), population in the flood-affected area has a significant, positive effect on fatalities, though only at p < 0.1 in the model that does not control for magnitude. It has a negative effect on magnitude, which suggests an effort by governments to direct flood protection measures toward areas where more people reside. A country's urban population percentage does not affect fatalities, which Kellenberg and Mobarak also found, but it has a negative effect on magnitude. The latter is unexpected if the primary effect of urbanization is increased runoff but, similar to the negative effect of population, it might reflect greater deployment of flood protection measures in more urbanized societies. Finally, the percentage of a country in forest has no effect on flood frequency, magnitude or fatalities, which is consistent with other evidence that contradicts the conventional wisdom that forests reduce floods and their consequences (FAO and CIFOR, 2005; Van Dijk et al., Reference Van Dijk, van Noordwijk, Calder, Bruijnzeel, Schellekens and Chappell2009; Ferreira and Ghimire, Reference Ferreira and Ghimire2012).
5. Discussion
We have examined the effects of two important dimensions of economic development, income and governance, on flood fatalities. Despite using a different, and in our view better, flood data set than previous studies have used, we are able to replicate the general form of those studies' findings on the effects of income on fatalities when we use estimators similar to theirs. When we control more completely for unobserved country effects and use clustered standard errors, however, we find little evidence that income has a direct effect on the number of fatalities that occur during flood events. Instead, we find evidence for an indirect effect: rising income reduces flood frequency, and it also affects flood magnitude. The latter effect is not monotonic: it is negative (income reduces magnitude) when GDP per capita is below $3,934 in 2005 dollars but positive above this level. This turning point is very close to the World Bank's dividing line between lower middle income and upper middle income countries.Footnote 10 Although income evidently has a beneficial effect in lower income countries, it has opposing effects in higher income countries: fewer floods, but larger ones. The opposing effects are of comparable magnitude, indicating that the net effect of income on flood fatalities in higher income countries is near zero, or at best a small negative amount.
The hydrological literature on floods supports and offers an explanation for our finding of fewer but larger floods in higher income countries. Higher income enables countries to invest more heavily in infrastructural solutions to flood control. While some infrastructural solutions, in particular dams, can reduce the frequency and magnitude of flood events, levees and channelization can increase river levels during heavy rain events (Pinter, Reference Pinter2005; Criss and Shock, Reference Criss and Shock2001). For example, levees and channelization have narrowed the channels of major rivers in the United States, and narrower channels exhibit more variable and higher discharges than broader, unimpounded rivers. This river engineering approach has continued even after disastrous floods have occurred, such as the great Midwestern flood of 1993 (Pinter, Reference Pinter2005). It may create a ‘safe development paradox’ (Burby, Reference Burby2006), with populations in low-lying areas overestimating the protection that it provides and thus exposing themselves to higher risks and failing to take private actions to protect themselves.Footnote 11 The large number of fatalities in New Orleans during Hurricane Katrina has been held up as an example of this (Burby, Reference Burby2006).Footnote 12
While this discussion highlights the evidently neutral effect of income on flood fatalities in countries above the $3,934 GDP per capita turning point, the beneficial effects of income growth that moves low income and lower middle income countries into this group should not be overlooked, given that the mean flood fatality rate is 60 per cent lower for the higher income countries (appendix, table A3). To put this in context, nearly half the world's population lives in low or lower middle income countries (WDI, 2010).
Regarding governance, we find little evidence of a significant effect on flood fatalities either directly or indirectly when we control for unobserved country effects and use clustered standard errors. Previous studies have not examined the effects of governance on flood fatalities, but they have reported that improved governance reduces fatalities aggregated across disasters or just for earthquakes. Governance's lack of significance in our study is not due to inadequate within-country variation in our governance index, which is significant in fatality and frequency models that control for unobserved country effects but do not use clustered standard errors. Moreover, in our sample, the within-country variation of governance exceeds the within-country variation of income, which as noted is significant in our frequency and magnitude models even when we use clustered standard errors in addition to controlling for unobserved country effects. There are two possible explanations for the difference in significance compared to previous studies: either floods are different from other types of natural disasters, with governance affecting the latter but not the former, or previous studies have exaggerated governance's significance by not controlling adequately for unobserved country effects and correlation of errors within countries. Our results do not provide a sufficient basis for determining which explanation is the right one, but they do open the possibility that the latter could be the case.
As with income, the non-economic literature on floods hints at a possible explanation as to why improved governance might not have a beneficial effect on flood fatalities independently of any indirect role that it might play by enhancing economic growth. This explanation involves a combination of what has been called the ‘local government paradox’ (Burby, Reference Burby2006) in the flood control and government disaster policy literature, and the emphasis on decentralization by institutional strengthening programs promoted by international development organizations. The local government paradox is the proposition that local governments take natural hazards less seriously than central governments do. Although elected officials at the national level may face distorted incentives to invest in disaster preparedness – Healy and Malhotra (Reference Healy and Malhotra2009) show that voters reward incumbents for delivering disaster relief but not for investing in disaster prevention – Burby (Reference Burby2006) argues that this distortion is more marked at the local level. In the US there are examples of local officials resisting proposals to reduce storm risks because they did not want to pay the local share of the cost of federal projects. White (Reference White, Brinkmann, Cochrane and Ericksen1975) also noted that:
[t]he prevailing social environment which puts the large burden of responsibility on the shoulders of the Federal government may have added to the increase in loss potential. The large-scale relief and rehabilitation programs, as well as improved forecasting and warning, are believed to reduce the flood hazard in the eyes of the flood plain manager and make flood plain occupation less hazardous. These may cultivate a general feeling that the [Federal] government will take care of the problem. White (Reference White, Brinkmann, Cochrane and Ericksen1975, 22)
Local officials, it is argued, care more about ‘tangible’ benefits like attracting employers and constructing new schools than protecting against risks that may not materialize during their time in office.
Decentralization has been at the center stage of institutional reform over the last 30 years in a large number of developing and transition economies, and it might have inadvertently made the local government paradox more prominent. If so, it might have offset other positive impacts associated with improved governance. Anecdotal evidence from the aftermath of Hurricane Mitch in 1998 supports this hypothesis:
Hurricane Mitch has highlighted the abilities and limitations of municipalities and other local actors in Central America to act in the immediate aftermath of a disaster and in the period of reconstruction. Local actors have mobilized a remarkable effort following Mitch; however they were often forced to respond in an ad-hoc fashion due to the inadequacy of both disaster preparation and internal capacities, and the lack of financial resources. As a result, the Hurricane has also re-energized the debate on decentralization as a factor in the region's reconstruction and long term development. (Inter-American Development Bank, http://www.iadb.org/regions/re2/consultative_group/groups/decentralization_workshop.htm)
In principle, we could test the potentially opposing effects of improved governance and decentralization by adding a variable that measures the degree of decentralization to our models. Unfortunately, decentralization indicators for our sample are not readily available, and so at this point we can only hypothesize that decentralization contributes to the lack of evidence of a significant effect of governance on flood fatalities.
Appendix