I. INTRODUCTION
Single-crystal deformation experiments are the most precise, but also among the most difficult experiments to interpret for identification of mechanical properties of metals. Recently, an efficient method was presented to derive single-phase mechanical properties from the combined application of nanoindentation, electron backscatter diffraction (EBSD) orientation mapping, atomic force microscopy (AFM) topographic measurements, and crystal plasticity finite element (CPFE) modeling.Reference Zambaldi and Raabe1 This article describes the results obtained by applying this approach to commercial purity titanium.
Titanium is an attractive low-density structural material, and its alloys are used because of their high density-corrected stiffness and strength, as well as their superior corrosion and high-temperature resistance.Reference Lütjering and Williams2 Alloys that consist mainly of the alpha-phase (α- and near-α alloys) are used because of their good ductility and high yield stress.Reference Bieler, Trevino and Zeng3 In these alloys, the hexagonal structure leads to considerable grain scale heterogeneity of plastic flow during deformation.
The anisotropy of plastic flow in hexagonal metals is a prominent feature of their deformation behavior.Reference Dunne, Walker and Rugg4–Reference Hutchinson and Barnett7 Different kinds of slip systems with a variability in their critical resolved shear stresses (CRSS) lead to selective activation of only a few deformation systems for many boundary conditions. The precise nature of the heterogeneous stress and strain fields has recently attracted renewed attention because of new analysis techniques such as x-ray microdiffraction,Reference Ungár, Ribárik, Balogh, Salem, Semiatin and Vaughan8, Reference Bettles, Lynch, Stevenson, Tomus, Gibson, Wallwork and Kimpton9 EBSDReference Bieler, Nicolaou and Semiatin10–Reference Yang, Wang, Bieler, Eisenlohr and Crimp12 and the CPFE method.Reference Wang, Barabash, Yang, Bieler, Crimp, Eisenlohr, Liu and Ice6, Reference Bieler, Eisenlohr, Roters, Kumar, Mason, Crimp and Raabe13
There is currently a high demand for improving the micromechanical understanding of polycrystalline titanium alloys. To gain a truly quantitative insight into the mechanically relevant microstructure–property relationships, our proposed method for fast acquisition of single-crystal deformation characteristics will be beneficial because it allows for a separation of the intrinsic single-phase mechanics from the influence of microstructure interfaces. To develop mechanical microstructure–property relationships of crystalline materials, two key issues must be considered: first the intrinsic mechanical response of a constituent at the single-crystal level needs to be known. Second, the distribution of one-, two-, and three-dimensional defects and their interfacial relationships with constituent phases in the microstructure will strongly affect the mechanical behavior. Although a complete understanding of the effect of defects such as grain or phase boundaries is not easy to identify, the quantification of the single-crystal mechanical properties remains important.
The types of deformation systems in metals and alloys and their atomistic features are often well known from careful TEM studies on deformed material.Reference Zaefferer14 However, it is difficult to assess the CRSS values of different slip modes from TEM examinations, as they lack statistical volumetric significance. More often, the slip activity threshold is determined using single or polycrystal deformation experiments. Due to the anisotropic flow behavior of titanium single crystals, the stress and strain fields in such an experimental approach involving polycrystal deformation are very heterogeneous and cannot be approximated in a simple manner. On the other hand, the conduction of single-crystal deformation experiments involves complicated and time-consuming steps such as growing single-crystal or coarse grained starting material, characterizing its orientation via Laue or EBSD diffraction methods, and preparing oriented cuts from these crystals. Once these are cut, they are usually somewhat different from the intended orientation, leading to challenges in interpretation when they are deformed and characterized. Even for only a few target orientations this procedure takes so much experimental effort, that good quality data on single-crystal deformation is only available for a very limited number of metals and alloys such as copperReference Franciosi and Zaoui15, Reference Franciosi16 and a few others.
The plan of this article is as follows. First, the current understanding of hexagonal titanium plasticity is concisely reviewed. Then, the experimental and computational methods are described, including our optimization approach for single-crystal indentation topographies. The “Results” section presents the first experimentally acquired inverse pole figure of pileup topographies for commercially pure titanium. Additionally, crystal plasticity simulations are used to investigate the influence of the indent on local topographies arising from the relative shear strains by the competing deformation systems in titanium. The resulting constitutive parameters from the nonlinear optimization procedure are given. The discussion of aspects of the experimental and computational techniques is followed by a general discussion of our combination of these methods. This combined approach forms a novel tool for accurate quantification of the single-crystal plastic response of any microstructural constituent with large enough crystallites to place a nanoindent in it.
II. CRYSTAL PLASTICITY OF α-TITANIUM
The plastic deformation of α-titanium has been investigated experimentally.Reference Zaefferer14, Reference Churchman17–Reference Williams, Baggerly and Paton22 These studies show that the CRSS of titanium alloys is very sensitive to alloying composition and experimental design. The state of stress in uniaxial compression or tensile tests is not truly uniaxial, especially at ends of the specimen, where friction, misalignment, or shoulder regions affect the local stress state.Reference Raabe, Ma and Roters23 In general, prismatic <a> slip is most easily activated. However, by increasing the concentration of alpha stabilizer elements such as Al, the c/a ratio is increased, which decreases the atomic spacing on basal planes to make them closer to the ideal hcp structure, where c/a = 1.633. Under these conditions, basal slip becomes more favorable. In some alloys, the difference in CRSS between basal and prism slip is small, e.g., 20%, and this difference diminishes with increasing temperature. Because neither prism or basal <a> slip can alter the dimensions of a crystal in the <c> direction, and because there are fewer than 5 degrees of freedom for deformation using <a> slip, twinning or <c + a> slip are necessary to allow deformation to occur in a compatible way along grain boundaries. Mechanical twinning is commonly observed in pure titanium, and less so with increasing alloying elements. Four types of mechanical twins are possible, but the  extension twins are most easily activated, and because of the small shear associated with these twins, it is possible for them to become quite thick. Twins are not predictably observed based upon Schmid factors alone; nucleation at grain boundaries is an important activation barrier for their operation.Reference Wang, Eisenlohr, Yang, Bieler and Crimp24, Reference Beyerlein, Capolungo, Marshall, McCabe and Tome25 With increasing alloy elements, or increasing temperature, twinning is less active, and <c + a> slip on pyramidal planes is favored.
Because <c + a> slip resistance is 3 or more times greater than <a> slip, very little < c + a > slip is observed and may not be observed at all in some grains if neighboring grains can accommodate the required shape change without invoking < c + a > slip. It is most commonly observed in grain orientations with very low Schmid factors (e.g., <0.3) for <a> slip, and these grains deform much less than neighboring grains that activate <a> slip.Reference Bieler, Nicolaou and Semiatin10 One of the main purposes of the present study is to identify the relative slip resistance between these different deformation systems.
III. EXPERIMENTAL METHODS
Two samples, A and B, of commercial purity titanium (CP-Ti) were prepared by electron discharge machining, mechanical grinding and polishing, and finally electropolished. The material was of grade 2 quality, and the content of interstitial oxygen was not determined. By the collection of large area EBSD scans, suitable microstructure patches were identified, which provided a variety of crystallographic orientations. These areas were carefully chosen for later nanoindentation using a Hysitron Triboscope (Hysitron Inc., Minneapolis, MN). Regular patterns of indentations were made into the previously identified regions. The spacing of the rectangular indent grids was chosen in the range of 10–20 μm. A sphero-conical diamond tip with a nominal tip radius of 1 μm and a nominal cone angle of 90° was used. Load-controlled indentations were performed with a maximum load of 6 mN, using a trapezoidal loading with a time of 5 s each for loading, dwell, and unloading time.
Hardness values were calculated based on the Oliver–Pharr method with an area function that was calibrated on poly(methyl methacrylate). On the two CP-Ti samples, 1424 indents were placed in total. The precise locations of the indents were checked by EBSD and secondary electron imaging in the scanning electron microscope (SEM).
Topographic characterization of selected indents was carried out with a Veeco dimension 3100 AFM (Veeco Instruments Inc., Plainview, NY) in tapping mode. Care was taken to document the sample positions inside the SEM, the nanoindenter, and the AFM to enable later correlation of the experimental data with the simulations.
IV. ANALYSIS OF THE INDENTATION DEFORMATION BY CPFE SIMULATIONS
A. A simplified constitutive model for α-titanium crystal plasticity
An existing crystal plasticity model,Reference Roters26, Reference Roters, Eisenlohr, Hantcherli, Tjahjanto, Bieler and Raabe27 following the implementation of Kalidindi et al.,Reference Kalidindi, Bronkhorst and Anand28 was adapted to the slip characteristics of hexagonal titanium. A short summary is given in the following: the kinematic description of large-strain elastoplasticity is based on the multiplicative decomposition of the deformation gradient, F, as F = F*Fp, into the plastic part, Fp, and F*, containing elastic stretch and rotation.Reference Lee29 The plastic velocity gradient, Lp, can be calculated from  . Deformation of crystals by dislocation glide can be described by the Orowan equation,
 , with the crystallographic shear rate,
 , the Burgers vector length, b, the mobile dislocation density, ρ mobile, and the dislocation glide velocity, v. However, the dislocation densities and velocities in titanium are not known. To be able to simulate the constitutive response, it is, therefore, useful to retreat to the quantitative description of the shear rates resulting from the different types of dislocations.
Since only shear on the deformation systems is allowed to contribute to plastic deformation, Lp is calculated from the sum of the shear rates,  , on all deformation systems, α, as

The unit vectors d0 and n0 indicate the shear direction and the normal on the glide plane of the slip system α, respectively. Shear rates,  , are taken as a viscoplastic function of the resolved shear stresses, τα, on the deformation systemsReference Hutchinson30–Reference Asaro and Needleman32
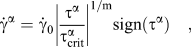
where  and m are material parameters. The slip resistances,
 , evolve with the shear rates,
 , of all systems (index β) according to

with the hardening matrix,  . The hardening matrix is calculated from the self-hardening, hβ, and the cross-hardening matrix,
 , with its diagonal elements equal to unity. Typically, in fcc crystals, the values of
 are chosen to be 1.4 for non-coplanar and 1 for coplanar slip.Reference Peirce, Asaro and Needleman33 The hardening contribution from self-hardening, hβ, is given by
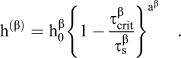
Note the change in comparison to the original formulationReference Kalidindi, Bronkhorst and Anand28 from constant values, h 0, τs, a, for all slip systems, to  ,
 , aα, now being dependent on the individual characteristics of the slip systems. This leaves four parameters for the description of the flow behavior: the initial slip resistance, τ 0; the saturation slip resistance, τ s; the parameter h 0, which determines the initial hardening slope; and the hardening exponent, a, which influences the shape of the self-hardening curve.
Because the primary meaning of the reference shear rate,  , and the strain rate sensitivity parameter, m, in the scope of the present work is more important for numerical stability than micromechanical properties, they are assumed constant in all simulations. The parameter m provides strain rate sensitivity of the flow stress in the model. Also, to approximate time-independent behavior, its value is constrained to be small, but large enough to assist robust convergence of the time-integration procedure. Time-integration of the constitutive law is achieved through the implicit scheme by Kalidindi et al.Reference Kalidindi, Bronkhorst and Anand28 Since different values of τ 0 are allowed for, convergence is tested against the minimum value of all
 . The tolerance for the inner stress integration loop is chosen to be 10−4 min(
 ). The outer loop reaches convergence when the maximum change in the components of the calculated shear strengths becomes much smaller than the minimum initial shear strength of all systems, max(Δ
 ) < 10−3 × min(
 ).
Twinning deformation systems were not included into the model formulation since no twinning activity was observed in the experiments.
B. Finite element simulations of the three-dimensional indentation deformation
The crystal plasticity formulation was integrated into the finite element method (FEM) by using the material subroutine hypela2 of the commercial FEM system MARC.34 A three-dimensional FE model of the indentation process was generated. Deformation of the sphero-conical indenter was neglected by assuming it to be a rigid body. The sample was discretized by hexahedral eight-node elements. The maximum used number of 4320 elements has been previously shown to be a good compromise between computational costs and accuracy of the predicted indentation response.
The exact tip geometry was not known a priori. Therefore, an initial series of simulations was performed, to adjust the tip radius. Iteratively, the tip radius of the simulations was changed until the difference between the simulated and the measured remaining indent topographies became minimal. This procedure resulted in a tip radius of 1.4 μm.
Friction is known to have a minor effect on the load–displacement response of indentation.Reference Bhattacharya and Nix35 However, Liu et al.Reference Liu, Wang, Yoshino, Roy, Lu and Komanduri36 have shown that the value of the coefficient of friction might affect the maximum height of the formed pileup. A coefficient of friction of 0.2 was assumed in all simulations. A finite amount of friction improved the stability of the CPFE simulations because it reduced large mesh distortion close to the contact region, which is often observed in simulations without friction.
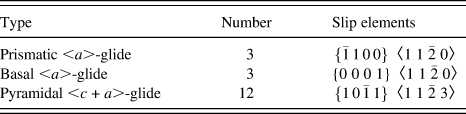
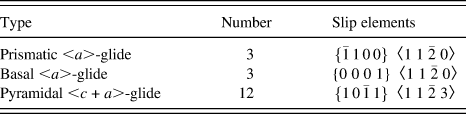
The elastic constants c 11 = 162.4 GPa, c 12 = 92.0 GPa, c 13 = 69.0 GPa, c 33 = 180.7 GPa, c 44 = 49.7 GPa, c 66 = 76.5 GPa were used.Reference Simmons and Wang37 Different material parameters for the simulation of inelastic deformation could be assigned for each of the three types of deformation systems. The used constitutive model allowed for shear contributions from 18 slip systems in total that were split in three types of slip systems as given in Table I. For the cross-hardening parameter, q αβ, a constant value of 1.0 was chosen for coplanar and non-coplanar deformation systems.
Types and numbers of slip systems in the used crystal plasticity formulation.
C. Identification of the crystal plasticity hardening parameters by nonlinear optimization
Optimization of a subset of the crystal plasticity constitutive parameters was carried out; namely the initial shear resistances and the saturation resistances of the three slip types were chosen as the free parameters. A custom implementation of the downhill simplex method after Nelder and Mead was used as the optimization algorithm.Reference Nelder and Mead38, Reference Press, Teukolsky, Vetterling and Flannery39 The optimization of crystal plasticity parameters with the simplex method has been demonstrated by Grujicic and Batchu,Reference Grujicic and Batchu40 and our implementation of the algorithm followed their description.
The objective function, i.e., the function that is to be minimized by the optimization routine, was calculated from the deviation of the simulated topographies from the measured ones. To this end, the experimental data were rotated into the coordinate system used by Zambaldi and RaabeReference Zambaldi and Raabe1 and the imprint was centered on the z-coordinate (the indentation axis). Rotations and additional three-point plane corrections of the zero level were performed on the AFM data with help of the Gwyddion software.41 The surface profile data was then interpolated to a domain of size 2.5 × 2.5 μm2 at a step size of 0.1 μm. The simulated CPFE topographies were exported from the FEM result file and interpolated to the same domain. Then, the topographic contribution, G topo, to the objective function, G, was calculated as the sum of unsigned height differences, Δzi, at all points, i, of the regular X–Y grid

Additionally, this intermediate value was multiplied with the deviation of the simulated maximum load,  , from the experimental maximum force,
 . To ensure that the deviations in the maximum load did not disturb the optimization in progressing toward a good match with the pileup profile, the load penalty was down-weighted by a factor of 0.2. Thus, the final value of the objective function, G, followed

For simultaneous optimization of the constitutive parameters for more than one experimentally measured orientation, the individual values of the objective function were simply summed up over all orientations. The variable parameters of the iterative optimization were the initial shear strength, τ 0, and the saturation shear strengths, τ s, of the basal and prismatic <a>-glide and of the pyramidal <c + a>-glide, leading to a number of free parameters of n = 6. The initial n + 1 = 7 sets of constitutive parameters were initialized in a random fashion without prior bias of probable shear strength ratios.
Since the initial sets of constitutive parameters were chosen randomly, the initial convergence behavior was slow. Pileup topographies simulated in this beginning stage of the optimization often differed considerably from the experimental ones, showing piling-up of material in locations where no pileup was observed experimentally. To improve the performance of the optimization routine in the initial stage, coarser discretizations of the indentation process were used. Finite element models with 704, 1088, and 4320 hexahedral elements were used successively during the optimization.
To summarize from above, the following steps were carried out during the nonlinear optimization of the constitutive parameters:
(1) Acquire and select suitable experimental indent data and corresponding topographies;
(2) Carry out the CPFE simulations for the selected orientations;
(3) Postprocess the finite element results to extract the simulated topographies and maximum loads;
(4) Calculate the objective function by comparison of the simulation results with the experimental data;
(5) Update the simplex to generate the next set of constitutive parameters;
(6) Repeat steps 2–5 until the constitutive parameters converge to the optimum values.
The results of the iterative optimization procedure are found when the decrease of the objective function stagnates on a minimum level that is determined by the accuracy of the experimental data sets and of the simulation method.
V. RESULTS
A. Experimental results
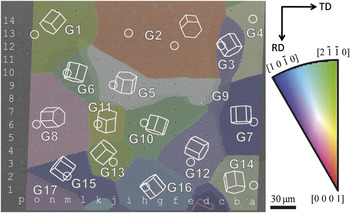
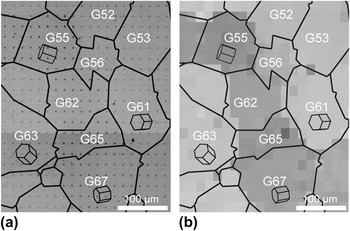
The applied grid of indents on the CP-Ti specimen is shown in Fig. 1. Figure 2 demonstrates how the maximum indentation depth relates with the grain orientation. The microstructure as measured by EBSD and represented by the high-angle grain boundaries is approximated in good agreement by the grayscale map of indentation depths. The measured depths were reasonably homogeneous inside individual grains with small scatter: the standard deviation of the maximum indentation depths was usually around 2% of the mean value for a given grain.
The grid of indents applied on the microstructure of commercial purity titanium (CP-Ti), sample A. Indents were spaced by 20 μm × 16 μm respectively. A semitransparent orientation map with inverse pole figure coloring is superimposed on a backscattered electron image. Because of the transparency, the colors correspond only approximately to the inverse pole figure legend.

(a) Micrograph of the indented area of CP-Ti, sample B, shown together with reconstructed high-angle grain boundaries from the electron backscatter diffraction scan. (b) Grayscale map of the maximum indentation depth, each grayscale pixel corresponds to one indent and darker pixels correspond to larger maximum indentation depths. The data of the labeled grains are also included in Fig. 3.

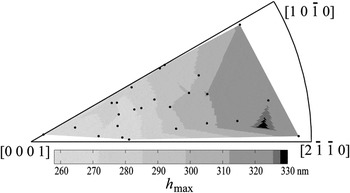
Figure 3 presents the anisotropic maximum indentation depth, based on 1200 indentations in a microstructure patch of 1200 μm × 320 μm. A total of 26 of the larger grains in this area were analyzed further; an average depth per grain was approximated, taking into account variation of the depths inside one grain and by making efforts to avoid possible influence from the surrounding microstructure. The variation in the maximum indentation depth over all orientations was about 70 nm with a minimum at just below 260 nm close to a c-axis indentation direction and a maximum at 330 nm for indentation near the  axis. A general trend of decreasing hardness, i.e., increasing maximum depths, was observed with the indentation axis rotating away from the basal plane normal [0 0 0 1]. Hardness values as calculated after Oliver and Pharr varied from 0.75 GPa for indentation close to 〈1 1
 0〉 to a maximum at just over 1 GPa for indentation of the basal plane.
Anisotropic indentation response of CP-Ti, sample B: inverse pole figure of the maximum indentation depth, h max, based on grain-averaged depths from 26 of the larger grains.

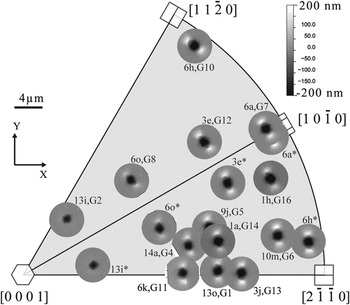
The grain size of sample A was large enough that often several indents of the 14 × 16 (=224) grid were within one grain. For the subsequent AFM topographic measurements, indents in the center of the grains were selected, away from the grain boundaries to the adjacent grains. Through the 2D display of the microstructure, it cannot be guaranteed that there is no interface close to the surface below the indent. However, assuming that the microstructure is equiaxed (as it appears on plots), then the distance to another grain boundary is maximized if the indent is near the center of the grain. The AFM topographies are presented in Fig. 4 using a grayscale color legend that emphasizes the pileup patterns around the indents. Analysis of the indent topographies showed that indentations were performed by the rounded part of the tip with little influence of the conical part.
Inverse pole figure of pileup topographies of CP-Ti, sample A, maximum load was 6 mN. The indents are in-plane rotated according to the convention defined in Ref. Reference Zambaldi and Raabe1. The indents in the upper half of the inverse pole figure (IPF) are also displayed in the lower half by a mirroring operation through the (1 0  0) plane and marked with an asterisk.
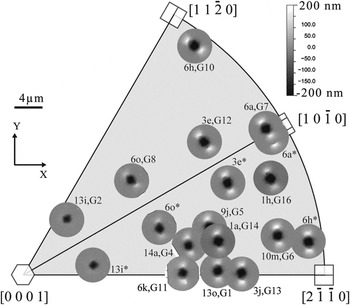
The topographies in Fig. 4 are positioned at the inverse pole figure representation of the corresponding indent axis and are rotated by the convention defined in Zambaldi and Raabe (2010).Reference Zambaldi and Raabe1 To generate the inverse pole figure representation of pileup topographies, the following steps were applied to the data:
(i) The experimental Euler angles as recorded by the EBSD system were converted into an orientation matrix g. The indentation axis, Z, in the crystal frame is then given by Z = ge3.
(ii) The polar coordinates (ζ,η) after convention were calculated from vector Z.
(iii) Bunge Euler angles after convention were calculated as (ϕ 1, Φ, ϕ 2) = (270° + ζ, η, 90° − ζ).
(iv) The angle between the x- and y-axes of the experiment and for the Euler angles after convention was calculated.
(v) Back-rotation of the pileup pattern by this angle was performed.
(vi) Finally, the topography was placed in the unit triangle at the inverse pole figure projection of its indentation axis at an appropriate scale.
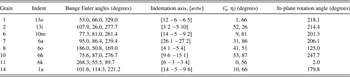
The results of steps (iii) and (iv) are also given in Table II for selected indents.
Experimentally measured orientations of selected indented grains of commercial purity titanium (CP-Ti), sample A.

The indentation axis indices are calculated with a misorientation tolerance of 1°.
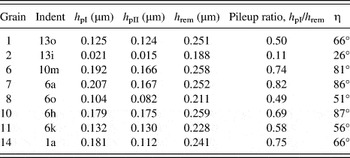
All indented grains with orientations away from the c-axis showed a piling-up behavior that exhibits two dominant pileup hillocks on opposite sides of the indent. By taking into account the indented crystallographic orientations, it was found that the two opposing pileup maxima are aligned with their connection roughly perpendicular to the c-axis of the indented grain. Piling up is most pronounced for the orientations on the (0 0 0 1) great circle. Table III gives the experimentally measured pileup heights of the highest, h pI, and second highest, h pII, pileup for selected indents in sample A. The remaining indent depths decreased toward smaller dihedral angles, η, between the indentation axis and the [0 0 0 1] axis. The pileup heights and the ratio of highest pileup to the remaining indent depth, however, decrease even faster. This behavior is especially obvious in a comparison of grains 2 and 7: indent 13i of grain 2, with an indentation axis 26° away from the c-axis, had a remaining indent depth of 0.19 μm and a maximum pileup height of about 20 nm, corresponding to a pileup ratio of about 10%. In grain 7 on the other hand, with the indentation direction almost perpendicular to the c-axis (η = 86°), the maximum pileup height of indent 6a was 0.21 μm, corresponding to a pileup ratio of 82%. Therefore, in the experiments, about an order of magnitude change in the pileup heights was found for the indentation directions between close to the c-axis and on the (0001) great circle.
Experimentally measured pileup heights of highest, h pI, and second highest, h pII, pileup for selected indents in sample CP-Ti 2-3. Also given is the remaining indent depth, h rem, as measured by atomic force microscopy, the pileup ratio, defined as h rem/h pI, and the angle between the indentation axis and the c-axis of the crystal, η.

Although it is known that twinning deformation plays an important role in the deformation of polycrystalline titanium, the experimental results from indentation into several orientations did not show any sign of twinning activity and this observation is discussed below.
B. CPFEM simulation of the orientation-dependent upheaval and parameter identification
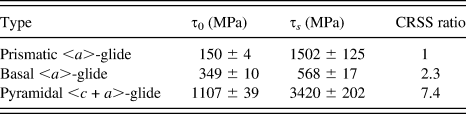
Table IV presents the values for the initial shear strength, τ 0, after 300 iterations of the simplex optimization procedure. Also given is the standard deviation of the parameters from the seven parameter sets that resulted in the minimum values of the objective function. The parameters h 0 and a were fixed to values 200 MPa and 2.0, respectively. The strain rate sensitivity parameter, m, was set to 20 and the reference shear rate,  , was 0.001 s−1.
Identified parameters of the crystal plasticity model for prismatic 〈a〉-dislocation glide, basal 〈a〉-dislocation glide, and pyramidal 〈c + a〉 systems.
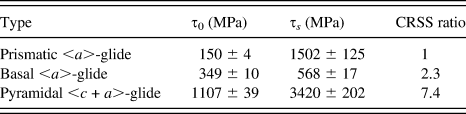
The identified parameters were the initial slip resistances, τ 0, and the saturation slip resistances, τs. The CRSS ratios were calculated from the initial shear strengths. The constant parameters of the model were m = 20,  = 0.001 s−1, h 0 = 200 MPa, a = 2.0.
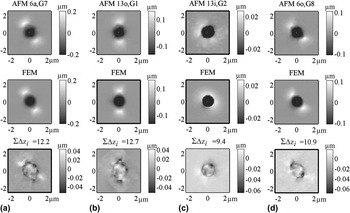
The two selected indents for which the simultaneous optimization was carried out are shown in Fig. 5 together with the corresponding AFM topographies. Indent 6a/G7 had an indentation axis close to [1 0 1 0] and the axis of indent 13o/G1 was close to the [2  1] direction.
(a, b) Experimental (top row) and simulated (middle row) topographies for indents 6a and 13o from sample A, which were selected for identification of the crystal plasticity finite element (CPFE) parameters. Also shown is the difference between the experimental and simulated surface profiles (bottom row), which was used to calculate the topography contribution, G topo = ∑ Δzi, to the objective function. (c, d) The results for two additional orientations that were simulated with the identified parameters from (a, b). Note that the color legends of the surface upheaval are consistent only for each column’s experimental and CPFE topographies.

13o had comparable Schmid factors for prismatic and basal glide if uniaxial compression is assumed.
To validate the identified set of parameters, two additional orientations from Table II were simulated to compare the results directly to the AFM data from experiments. For the orientation of indent 13i/G2, a maximum indentation depth of 0.21 μm was prescribed resulting in a remaining depth of 0.17 μm after unloading. For the simulation of indent 6o/G8 the maximum depth was 0.250 μm, which on unloading relaxed exactly to the remaining indent depth of the experimental counterpart (0.21 μm). In both of the validation simulations, the topographic error was smaller than for the indents on which the optimization was based. For indent 13i/G1a, very low level of pileup was predicted as also present in the experiments. The simulated pileup pattern of indent 6o/G8 is very similar to the one recorded by AFM.
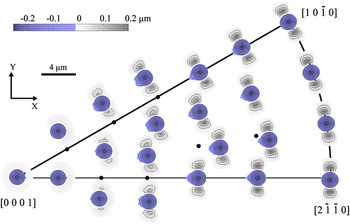
Figure 6 shows the orientation-dependent pileup behavior of α-titanium as simulated with the identified CPFE parameters. All simulations were performed for a maximum indentation depth of 0.3 μm. Good agreement was found with the experimentally observed pileup profiles. The pileup heights decrease for indentation closer to the c-axis as it was also observed in the experiments.
Simulated inverse pole figure of pileup topographies of α-titanium. A number of orientations (22) throughout the unit triangle of α-Ti were simulated with the parameters given in Table IV. Regions below the zero level are shown in blue and pileup is shown in grayscale. The contour lines are starting at −0.04 and 0.04 μm for sink-in and pileup, respectively, and lines are drawn every 0.04 μm. The in-plane orientation of the topographies follows Ref. Reference Zambaldi and Raabe1 and is described in the text. To avoid overlap, seven topographies are positioned next to the stereographic projection of their respective indentation axes, which are marked by a dot.

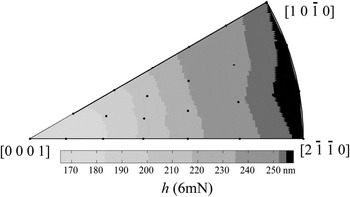
Figure 7 presents the orientation dependence of the simulated indentation depths at 6 mN load. There is remarkable agreement with the experimental data (Fig. 3) for the general trend of decreasing indentation depths toward the [0 0 0 1] indentation axis. Both figures also seem to agree in that of the soft directions [2  0] is possibly slightly easier to indent in comparison to the [1 0
 0] direction.
Simulated orientation dependence of the indentation depth, h, at 6-mN load. The values are reported for the loaded condition of the finite element model.

VI. DISCUSSION
A. Pileup and hardness anisotropy of α-titanium
The measured orientation dependence of the hardness is in good agreement with the literature.Reference Viswanathan, Lee, Maher, Banerjee and Fraser42, Reference Merson, Brydson and Brown43 Using Berkovich indenters, the previous authors have found a similar hardness anisotropy as observed in the present experiments with a maximum for [0001]-indentation. Recent research has shown that quantifying the hardness based on the Oliver–Pharr approach is problematic in the presence of pronounced piling-up.Reference Lee, Hahn, Nahm, Jang and Kwon44 Therefore, instead of hardness values, we mostly present indentation depths here. The orientation dependence of indentation depths is not affected by possibly significant systematic errors that might be introduced during the calculation of a nanohardness based on an estimation of contact areas solely from the depth.
The experimentally measured pileup topographies from different grains with nearly identical crystallographic indentation direction are virtually identical when rotated into a common coordinate system as described above and in Ref. Reference Zambaldi and Raabe1. This means that the indentation into a certain crystallographic direction reproducibly results in characteristic pileup patterns that are largely unaffected by possibly existing heterogeneous residual stress fields or other influences in the microstructure.
The variation of the pileup ratios over about an order of magnitude seems to be characteristic for the orientation-dependent indentation response of α-titanium. The change in pileup heights is much larger than what could be explained by the different indentation depths. Clearly the orientation dependence of crystallographic slip mechanisms is related to the formation of the pileup.
The anisotropic pileup of CP-titanium is in good agreement with previously reported data on Vickers indentation of beryllium at 300 °CReference Tsuya45 showing pronounced prismatic slip activity. It is also in good agreement with pileup figures recorded for axisymmetric indentation of hexagonal α 2-Ti3Al.Reference Zambaldi46
B. Absence of mechanical twins after single-crystal indentation of CP-Ti
No twins were found in EBSD maps taken after indentation. The AFM topographies did not show any twin-shaped surface features as reported in other works.Reference Gaillard, Macías, Muñoz-Saldaña, Anglada and Trápaga47 Furthermore, the load–displacement curves did not exhibit load drops that could be connected to subsurface twinning. The absence of mechanical twins could either be due to the quasi-single-crystal indentation in which no stress concentrations by incompatible plastic deformation at grain boundaries occurred. Another possible explanation is that the deformation under the indent is more constrained than for uniaxial deformation experiments. Small-scale compression experiments on micropillars showed twinning to operate at pillar diameters of 8 μm.Reference Yu, Shan, Li, Huang, Xiao, Sun and Ma48 During nanoindentation into a single-crystalline half-space, there are much fewer degrees of freedom as compared to deformation of samples with a high surface-to-volume ratio. The twins that developed in micropillar compression studies may have formed because the free surface can easily accommodate the large shape changes at the surface without having to plastically accommodate the necessary shape changes that arise from twinning. In contrast, for the case of nanoindentation, the elastic strain energy must be used to distort the untwinned surrounding material and to accomplish plastic deformation of both, the twins and the parent material. This situation is also closer to the conditions in the interior of polycrystalline materials, where grain deformation is constrained by the compatibility requirements imposed by neighboring crystallites.Reference Britton, Birosca, Preuss and Wilkinson11 The main difference is that uniaxial deformation does not impose a hydrostatic state of stress in the manner caused by indentation.
However, a counterexample may be considered with regard to the micropillar deformation experiments presented by Yu et al.,Reference Yu, Shan, Li, Huang, Xiao, Sun and Ma48 which demonstrated a size dependence of mechanical twinning with a transition to pure dislocation glide, which operated for pillar diameters below 1 μm. In contrast, larger pillars and earlier studies of macroscale single-crystal deformation of titanium often showed high twinning activities.Reference Paton and Backofen18 It should also be mentioned that no twinning has been observed for nanoindentation into the γ-TiAl phase.Reference Zambaldi and Raabe1 In the presence of grain and phase boundaries, however, γ-TiAl is known to show pronounced twinning.
The results suggest that the lack of grain boundaries and/or the hydrostatic compression component of the stress tensor may frustrate twin nucleation in titanium.
C. Discussion of simulation results
Remarkable agreement was observed between details of the experimentally measured pileup and the simulation results. The pronounced piling-up of material on opposite sides of the indent in all orientations away from [0001] indentation was captured in the simulations. Analysis of the shear contributions from the individual deformation systems revealed a high slip activity on the prismatic slip systems in these orientations. This finding could be expected based on the assumed easy activation of prismatic slip in the model and on the significant resolved shear stresses on prismatic slip systems for orientations perpendicular to the c-axis. Correspondingly, the easy activation of prismatic slip in the studied material was identified as the dominant influence on the indentation pileup behavior of α-titanium.
Finer details of the anisotropic pileup behavior were also observed. For example, there is an extended sink-in groove of semielliptical shape to the left of indent 13o/G1, Fig. 4. Its depth is approximately 10 nm at its center, and the formation of this very slight sink-in is reproduced also in the corresponding CPFE result. On the other hand, many indentations in the cluster of indented orientations around indent 1a/G14, close to the [2  1] axis, showed a slight asymmetry of the pileup heights between the upper and lower protrusions. This behavior is not reproduced exactly in the CPFE results. It is improbable that this pileup asymmetry is due to tip-shape deviations from the ideal geometry that was used in the simulations, because the topographies are measured with differently orientated tip positions. The discrepancies could be explained by the relatively crude approach to the latent hardening or other unidentified insufficiencies of the constitutive model. Liu et al.Reference Liu, Ma, Lu and Komanduri49 have shown the influence of the strain rate sensitivity on the load–displacement curves. In the present simulations, the parameter m was fixed. The reason was that the simulation work focused on identifying activated slip systems based on the surface topography of the indent rather than on the load–displacement curves.
D. Automated identification of constitutive parameters by nonlinear optimization
Bolzon et al.Reference Bolzon, Maier and Panico50 performed the first optimization of constitutive parameters based on surface topographies. This initial contribution was later extended to the optimization of Hill’s anisotropic perfect elastoplasticity parameters.Reference Bocciarelli, Bolzon and Maier51 In these previous works, the simulated topographies were compared against pseudoexperimental pileup topographies. Yonezu et al.Reference Yonezu, Kuwahara, Yoneda, Hirakata and Minoshima52 have presented the inverse analysis of anisotropic pileup from spherical indentation of polycrystals. Here, we demonstrated the first identification of single-crystal constitutive parameters based on pileup topographies from indentation experiments.
From initial optimization runs based on individual experimental data sets, it was found that a single indent orientation will often not produce satisfying results during the parameter identification. If all Schmid factors for one of the potentially activated slip system families are very low, and consequently negligible amounts of shear are expected, the optimization showed bad convergence behavior. This was observed for example for indent 6a/G7 with an orientation close to [1 0  0]. In this case, the basal slip systems are difficult to activate because the basal plane is nearly perpendicular to the indented surface (η = 86°). Consequently, unsatisfactory convergence was observed with large oscillations of the basal <a>-glide slip and hardening parameters.
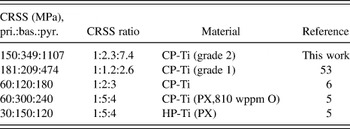
To avoid this erratic behavior, simultaneous optimization of the constitutive parameters on more than one indented orientation was performed. In the case of indent 13o/G1, the basal plane is inclined by 66° with the indented surface and therefore significant resolved shear stresses act on the basal slip systems. This orientation is better suited to identify the effect of different CRSS ratios of the prismatic and basal slip systems. The most robust convergence behavior, however, is observed if both orientations are taken into account for the optimization process. For such sets of two suitably selected orientations, the optimization routine converged reproducibly toward the same CRSS values for the basal, prismatic, and pyramidal deformation systems. The identified parameters, and especially the relative CRSS values as expressed by the CRSS ratios, were in good agreement with the values that are found in the literature, Table V. It is an important aspect of our approach to the extraction of single-crystal CRSS and hardening parameters that it allows such a direct comparison of the determined single-crystal mechanical properties to results from other types of deformation experiments.
Comparison of CRSS values and ratios from this work and from literature.

The CRSS value for the most active prismatic slip systems is expected to be determined with good accuracy by the parameter identification. The values for the less active slip systems should be taken with caution. For the saturation shear stress values, τ s, other influences of the constitutive formulation used have to be taken into account. For example, the latent hardening description used in the simulations is most probably not adequate for a realistic description of the complex interactions of different types of dislocations moving on various glide planes.
Here, the choice of only a few identified parameters was made to simplify and accelerate the optimization process. The method, however, is not limited to the set of free parameters used. With a more appropriate set of constitutive parameters that also includes the cross-hardening coefficients, the determination of the constitutive response with better precision seems possible. In general, the quality of the identified constitutive response is expected to be limited mainly by the accuracy of the experimental data and of the used constitutive description.
E. Methodological aspects
The advantages of using conical indenters include minimization of experimentally imposed anisotropic deformation, so that the measured anisotropy is only from the material. In contrast, pileup topographies from Berkovich indentations increase the effort required for evaluation of the pileup pattern because the in-plane orientation of the indenter has to be taken into account. Specimen preparation is also much simpler than the use of micropillars, where surface and size effects introduce important variables that must be considered. Only a flat (electro-) polished surface of a moderately large grain size sample is needed to perform the experiments. The only geometric influence comes from the indenter tool. Axisymmetric geometries with small tip radii are difficult to make. Since precise control of the tip radius at length scales below 1 μm seems to be impossible today, indentation loads that will produce indents of sufficient size to reduce the tip radius influence are necessary. The influence of different tip shapes can be largely excluded if the same tip is used for comparative studies as in the present example. The more anisotropic the plastic flow of the investigated material is, the more important is the use of axisymmetric indenters.
It would be beneficial to perform indentation to a constant depth and analyze the orientation dependence of the peak load. Force measurement is, however, the most precise and robust data acquisition method during instrumented indentation. Force measurements are not affected by thermal drift or calibration of the indenter stiffness. It is also not affected by many other mechanical influences such as tip alignment from replacement of the tip during multiple session experiments and unforeseen variations from more complex loading strategies.
Open questions exist for the presented approach that have not been addressed above: non-Schmid effects and a tension/compression asymmetry seem to influence the slip properties of titanium.Reference Williams, Baggerly and Paton22 Due to the high hydrostatic stresses that are present during indentation, the slip response might be modulated. Also, size effects that might influence the plastic flow at the investigated length scale need further attention.Reference Demir, Raabe, Zaafarani and Zaefferer54, Reference Pharr, Herbert and Gao55
Finally, the identification of active slip and cross-slip mechanisms that cause the observed pileup profiles certainly requires further efforts from experimentation and modeling. Improved understanding of the orientation-dependent plastic flow during indentation for several related alloys will provide a method to produce and study specific dislocation reactions with reduced effort in comparison to classical single-crystal and TEM experiments.
VII. CONCLUSIONS
The recently developed combined technique of nanoindentation, EBSD, pileup analysis, and CPFEM simulation was successfully applied to commercial purity titanium to analyze the deformation mechanisms. The relative activity of plastic deformation mechanisms is more easily analyzed using an axisymmetric indenter. The pileup analysis showed that prismatic glide is the predominant deformation mechanism in α-titanium of commercial purity. This is in good agreement with other studies that used different deformation methods. The absence of mechanical twinning during nanoindentation indicates that homogeneous nucleation of twins is more difficult in single-crystal conditions under combined uniaxial and hydrostatic compression used with indentation. Thus, the pronounced twinning commonly observed on surfaces of deformed α-Ti may be related to stress concentrations that arise from incompatible flow of the highly anisotropic grain disorientations.
The evaluation of orientation-dependent pileup shapes allows for rapid assessment of the prevailing deformation systems in plastically anisotropic materials. The method is generally applicable to crystals with arbitrary symmetries. Once the orientation-dependent pileup shapes have been charted, they can be used as look-up tables: the most probably activated deformation systems of less-understood or novel compounds could be quickly derived because the orientation-dependent pileup is similar for different phases that have a similar crystallographic structure and primary deformation systems.
The systematic study of orientation-dependent pileups from axisymmetric indentation can be applied to analyze the single-crystal deformation of α-titanium with good accuracy. The largest advantage in comparison with classical single-crystal experiments is that the laborious growth and orientated cutting of the specimens is avoided completely by the method. The method could be extended straightforwardly to investigate elevated temperature plasticity and effects of alloying. New methods or materials may be required for indentation at high temperatures. Extension to alloyed titanium could provide information about the deformation behavior of the α-phase in alloys for which the α-phase cannot be grown in monocrystalline form.